
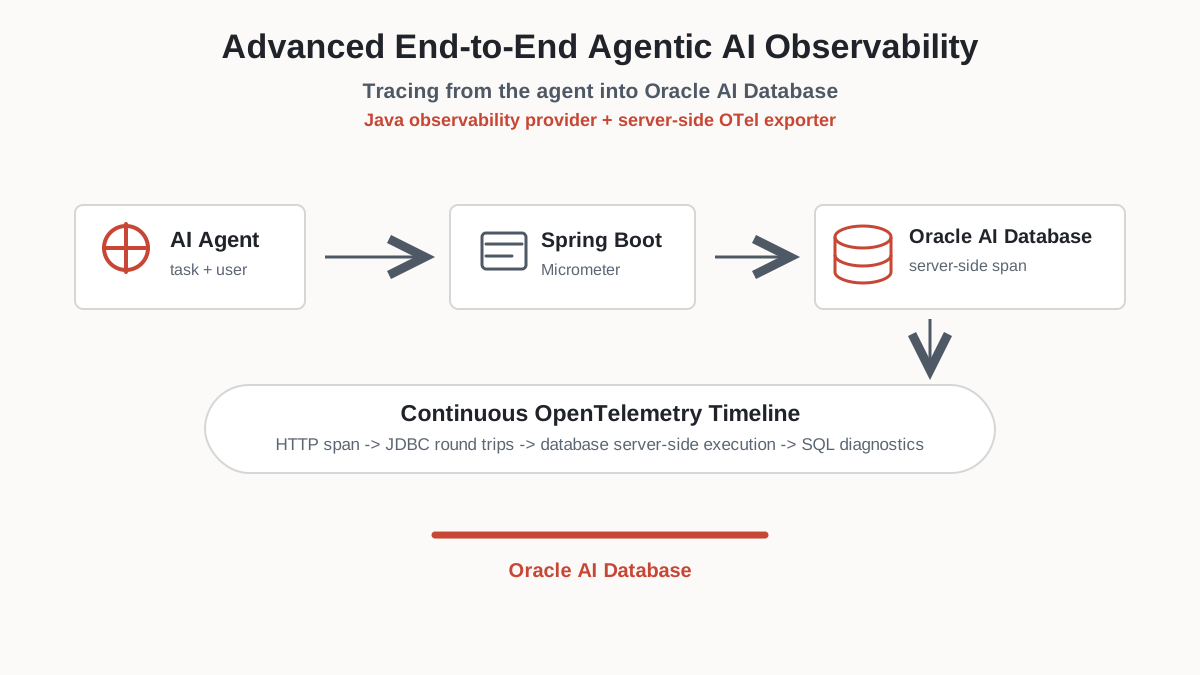
Build one continuous trace across a Spring Boot agent workload, Oracle JDBC, and Oracle AI Database server-side execution.
All source code, configuration, scripts, and supporting docs for the demo are available in the observability folder on GitHub.
Key Takeaways
- Oracle AI Database lets the trace continue into database server-side execution instead of stopping at the database edge.
- Spring Boot and Micrometer create the application trace context, while Oracle JDBC adds database client spans.
DBMS_OBSERVABILITYexports Oracle AI Database server-side spans to OpenTelemetry-compatible observability tools; this demo uses Jaeger.- Agent metadata,
MODULE,ACTION, andCLIENT_IDENTIFIERcreate a foundation for security and audit correlation.
This walkthrough answers a practical question for agentic applications: can you see one trace that starts with an AI agent request, crosses the Spring Boot and JDBC layers, and continues inside Oracle AI Database? Yes. With Spring Boot, Micrometer, Oracle JDBC observability providers, and DBMS_OBSERVABILITY, the same request can appear in any OpenTelemetry-compatible observability backend as application spans, JDBC spans, and Oracle AI Database server-side spans. This walkthrough uses Jaeger because it is simple to run and easy to inspect, but the same signal can be viewed in any OpenTelemetry-compliant observability tool.
That database-internal span is the important part. Typical database observability stops at the database edge: the application trace shows that JDBC waited on the database, then the user must switch tools and manually investigate inside the database. Oracle AI Database keeps the trace continuous. Developers, DevOps teams, and security reviewers can see how long the database actually took, correlate it to database-side evidence, and use the same trace for performance profiling, troubleshooting, and security context.
Video walkthrough and summary: Tracing from Agents into the Oracle AI Database.
What We Are Building
The demo app lives in observability/springboot-oracle-db-otel-demo. It is a Spring Boot app with two main endpoints:
| Endpoint | Purpose |
|---|---|
GET /trace/roundtrip | Simple app-to-database trace showing Spring Boot, Micrometer, JDBC, and database server-side spans. |
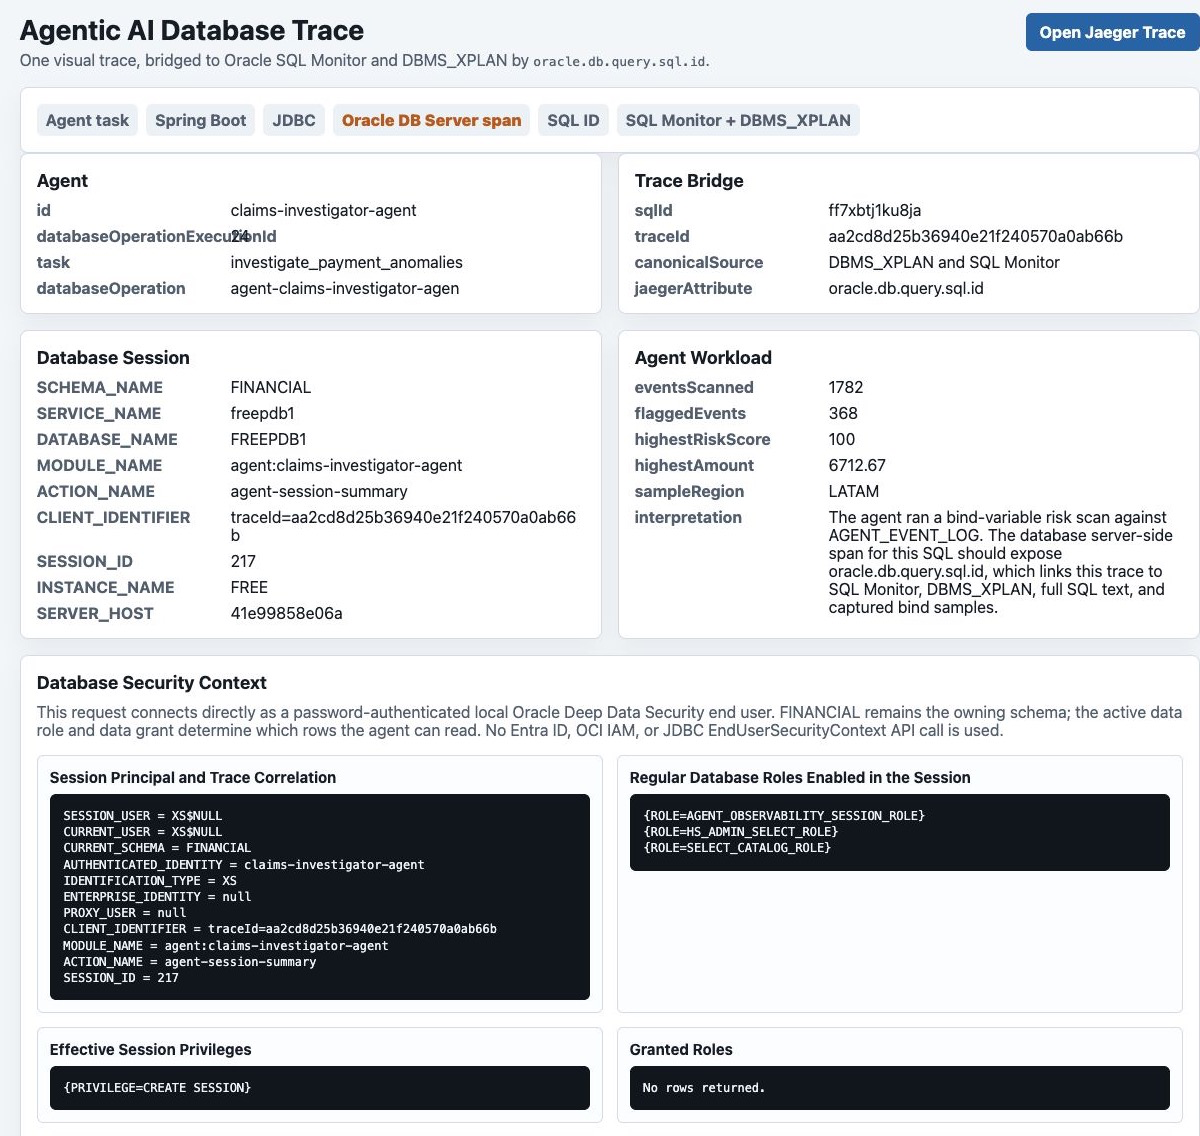
GET /trace/agent-task/view | Browser-friendly agentic demo that returns the trace id, agent id, database session metadata, database security context, SQL ID, SQL text, bind values, SQL Monitor preview, DBMS_XPLAN, and an embedded Jaeger trace on one page. Jaeger is the demo viewer; the telemetry is OpenTelemetry-compatible. |
The intended trace shape is:
Browser or curl
  -> Spring Boot HTTP span
  -> Micrometer observation
  -> Oracle JDBC provider spans
  -> Oracle AI Database DB Server span
  -> HTTPS OTLP endpoint
  -> OpenTelemetry-compatible observability backend (Jaeger in this demo)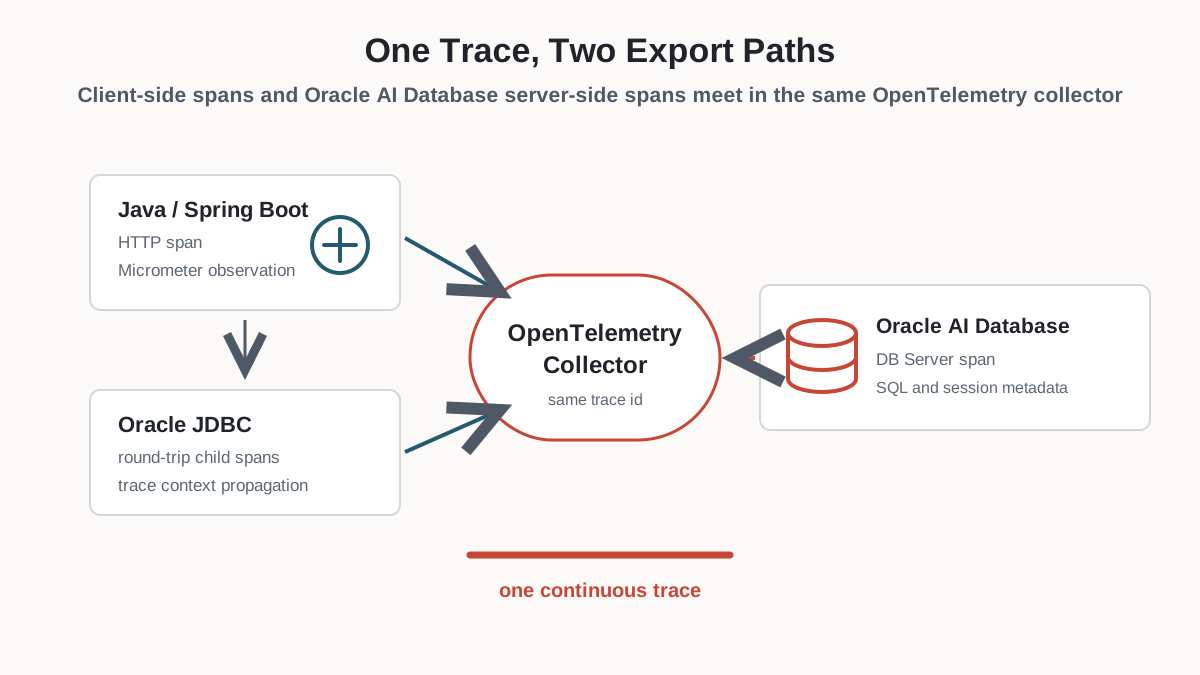
How Do You Set Up and Run the Example?
The demo can run on any Linux environment or VM with enough memory for Oracle Database Free, Jaeger, an HTTPS proxy, and the Spring Boot app. You can also use an Autonomous Database in Oracle Cloud instead of a local database; the important requirements are JDBC connectivity and a database server-side exporter that can reach an HTTPS OTLP endpoint.
A clean OCI Linux VM verification with Oracle Database Free 23.26.2.0 produced the expected Spring Boot, Oracle JDBC, and oracle-db server-side spans without setting hidden KSTRC instance parameters. The normal setup below uses documented DBMS_OBSERVABILITY configuration, a reachable HTTPS OTLP endpoint, network ACLs, and the database disttrc trust wallet.
- Install Java 25, Maven, Git, Podman, curl, jq, and OpenSSL.
- Run Oracle Database Free on Linux, or provision an Autonomous Database in Oracle Cloud.
- Clone the source from
github.com/oracle-devrel/oracle-ai-for-sustainable-devand use theobservabilityfolder. - Start Jaeger with OTLP HTTP enabled. In the sample setup, Jaeger receives app and JDBC spans on
http://127.0.0.1:4318/v1/traces. - Put a small HTTPS proxy in front of Jaeger’s OTLP endpoint for database server-side export. The sample uses NGINX as
otel-tls-proxy, forwardinghttps://otel-tls-proxy:4318/v1/tracesto Jaeger’shttp://oracle-db-otel-jaeger:4318/v1/traces. - Configure
DBMS_OBSERVABILITY, network ACLs, and the database wallet/trust path so Oracle AI Database can push server-side spans to the HTTPS OTLP endpoint. - Configure, build, and run the Spring Boot app, then open the agent task view or call the JSON endpoint to generate a trace.
sudo dnf install -y podman git java-25-openjdk java-25-openjdk-devel maven jq curl openssl
export JAVA_HOME=/usr/lib/jvm/java-25-openjdk
export PATH="$JAVA_HOME/bin:$PATH"

git clone https://github.com/oracle-devrel/oracle-ai-for-sustainable-dev.git
cd oracle-ai-for-sustainable-dev/observability/springboot-oracle-db-otel-demo
mvn -DskipTests package
Keep database credentials and runtime endpoints outside the repository:
export DB_URL='jdbc:oracle:thin:@//127.0.0.1:1521/FREEPDB1'
export DB_USERNAME='FINANCIAL'
export DB_PASSWORD='<app-user-password>'
export OTLP_TRACES_ENDPOINT='http://127.0.0.1:4318/v1/traces'
export TRACE_SAMPLE_PROBABILITY=1.0
export ORACLE_JDBC_SERVER_TELEMETRY_TRACES_ENABLED=true
export ORACLE_JDBC_SERVER_TELEMETRY_LOGGING_ENABLED=false
export ORACLE_JDBC_TRACEPARENT_CLIENT_INFO_ENABLED=true
export ORACLE_JDBC_TRACELEVEL_CLIENT_INFO_ENABLED=true
java -jar target/springboot-oracle-db-otel-demo-0.0.1-SNAPSHOT.jar
curl -sS http://127.0.0.1:8080/trace/roundtrip | jq .
curl -sS \
'http://127.0.0.1:8080/trace/agent-task?agentId=claims-investigator-agent&task=investigate_payment_anomalies' \
| jq .For the cohesive browser view, open:
http://127.0.0.1:8080/trace/agent-task/view?agentId=claims-investigator-agent&task=investigate_payment_anomaliesMaven Dependencies and the Oracle JDBC Observability Provider
The app uses Java 25, the Oracle JDBC 23.26 line from Maven Central, the published Maven Central ojdbc-provider-observability artifact, and the Oracle JDBC 17 production dependency.
<properties>
  <java.version>25</java.version>
  <oracle.jdbc.version>23.26.2.0.0</oracle.jdbc.version>
  <oracle-database.version>${oracle.jdbc.version}</oracle-database.version>
  <ojdbc.provider.observability.version>1.1.0</ojdbc.provider.observability.version>
</properties>

<dependency>
  <groupId>org.springframework.boot</groupId>
  <artifactId>spring-boot-starter-actuator</artifactId>
</dependency>

<dependency>
  <groupId>io.micrometer</groupId>
  <artifactId>micrometer-tracing-bridge-otel</artifactId>
</dependency>

<dependency>
  <groupId>io.opentelemetry</groupId>
  <artifactId>opentelemetry-exporter-otlp</artifactId>
</dependency>

<dependency>
  <groupId>com.oracle.database.jdbc</groupId>
  <artifactId>ojdbc17-production</artifactId>
  <version>${oracle.jdbc.version}</version>
  <type>pom</type>
</dependency>

<dependency>
  <groupId>com.oracle.database.jdbc</groupId>
  <artifactId>ojdbc-provider-observability</artifactId>
  <version>${ojdbc.provider.observability.version}</version>
</dependency>
Spring Boot Actuator creates the observation infrastructure, Micrometer bridges those observations to OpenTelemetry, and the OTLP exporter sends spans to the collector. The oracle-database.version property keeps Oracle JDBC, UCP, wallet/security, and related transitive artifacts aligned on 23.26.2.0.0.
The Oracle JDBC observability provider implements the JDBC driver TraceEventListener interface and publishes JDBC events into OpenTelemetry. Those events include database round trips and connection behavior, with attributes such as connection id, database operation, database user, tenant, and SQL ID. SQL text and connection details are treated as sensitive and are disabled by default unless explicitly enabled.
How Do the Spring Boot and JDBC Spans Get Created?
The Oracle JDBC OpenTelemetry extensions expect the application to already have an active OpenTelemetry context. They do not create the root application trace by themselves. In this demo, Spring Boot Actuator and Micrometer provide the HTTP and application observations, and the Oracle JDBC provider adds child spans for JDBC driver events such as database round trips. The provider also propagates the trace context to Oracle AI Database so the database can export its server-side span into the same trace.
If you do not want to add application instrumentation directly, use the OpenTelemetry Java agent for zero-code Java instrumentation. The Oracle JDBC extensions can then add database round-trip spans as children of the current application span and propagate that context to the server.
Spring Boot sends application and JDBC spans through OTLP HTTP. The demo sends them to Jaeger, but the same OpenTelemetry signal can be collected by any OpenTelemetry-compatible observability platform. Oracle JDBC provider properties enable the JDBC trace listener and identify the Java service in the collector.
spring:
  application:
    name: springboot-oracle-db-otel-demo
  datasource:
    url: ${DB_URL}
    username: ${DB_USERNAME}
    password: ${DB_PASSWORD}
    oracleucp:
      connection-factory-properties:
        "[oracle.jdbc.provider.traceEventListener]": observability-trace-event-listener-provider
        "[oracle.jdbc.provider.traceEventListener.unique_identifier]": springboot-oracle-db-otel-demo

management:
  otlp:
    tracing:
      endpoint: ${OTLP_TRACES_ENDPOINT:http://localhost:4318/v1/traces}
  tracing:
    sampling:
      probability: 1.0
How Do We Export Database Server-Side Spans?
The database server-side exporter needs a reachable HTTPS OTLP endpoint. The verified Linux demo uses Jaeger, which accepts OTLP HTTP on port 4318, and puts a small HTTPS proxy in front of it for database server-side export. In the sample, that proxy is NGINX with a trusted local certificate:
Oracle AI Database -> https://otel-tls-proxy:4318/v1/traces
otel-tls-proxy -> http://oracle-db-otel-jaeger:4318/v1/traces
Replace Jaeger with another OpenTelemetry-compatible collector or backend by changing the OTLP endpoint. The important requirement is that Oracle AI Database can reach the endpoint over HTTPS for server-side trace export.
Configure the database with DBMS_OBSERVABILITY, grant network ACL access to the user executing the SQL session, and place the trusted wallet where the distributed trace exporter expects it: WALLET_ROOT/<PDB_GUID>/disttrc.
begin
  dbms_observability.add_endpoint(
    endpoint_type => dbms_observability.otel_traces,
    endpoint => 'https://otel-tls-proxy:4318/v1/traces',
    credential_name => null);

  dbms_observability.enable_endpoint('https://otel-tls-proxy:4318/v1/traces');
  dbms_observability.enable_service_option(dbms_observability.capture_traces);
  dbms_observability.enable_service_option(dbms_observability.show_extra_metadata);
  dbms_observability.enable_service(dbms_observability.all_services);
end;
/
A clean verification run on Oracle Database Free 23.26.2.0 showed that the documented DBMS_OBSERVABILITY endpoint setup, the HTTPS OTLP proxy, the network ACL, and the WALLET_ROOT/<PDB_GUID>/disttrc trust wallet were sufficient for database server-side spans. Older local diagnostic runs used hidden KSTRC parameters while debugging export failures, but those settings are not part of the normal demo setup.
How Does JDBC Propagate the Trace Context?
The app uses the published ojdbc-provider-observability dependency. It is currently necessary to force a server telemetry state change before enabling traces, so the driver piggybacks the telemetry state to the database.
EnumSet<OracleConnection.ServerTelemetry> requestedTelemetry =
    EnumSet.of(OracleConnection.ServerTelemetry.Traces);

oracleConnection.setServerTelemetry(
    EnumSet.noneOf(OracleConnection.ServerTelemetry.class));
oracleConnection.setServerTelemetry(requestedTelemetry);
How Do We Make the Database Span Useful?
A generic DB Server span proves that the trace crossed into the database, but the demo makes it more useful by setting database session fields before the SQL runs. The app uses the Oracle JDBC end-to-end metrics API for this metadata, so it does not need a separate PL/SQL round trip just to set MODULE, ACTION, and CLIENT_IDENTIFIER.
String[] metrics = new String[OracleConnection.END_TO_END_STATE_INDEX_MAX];
metrics[OracleConnection.END_TO_END_MODULE_INDEX] = "agent:claims-investigator-agent";
metrics[OracleConnection.END_TO_END_ACTION_INDEX] = "agent-workload-query";
metrics[OracleConnection.END_TO_END_CLIENTID_INDEX] = "traceId=<trace-id>";
metrics[OracleConnection.END_TO_END_ECID_INDEX] = "<trace-id>";
oracleConnection.setEndToEndMetrics(metrics, (short) 0);
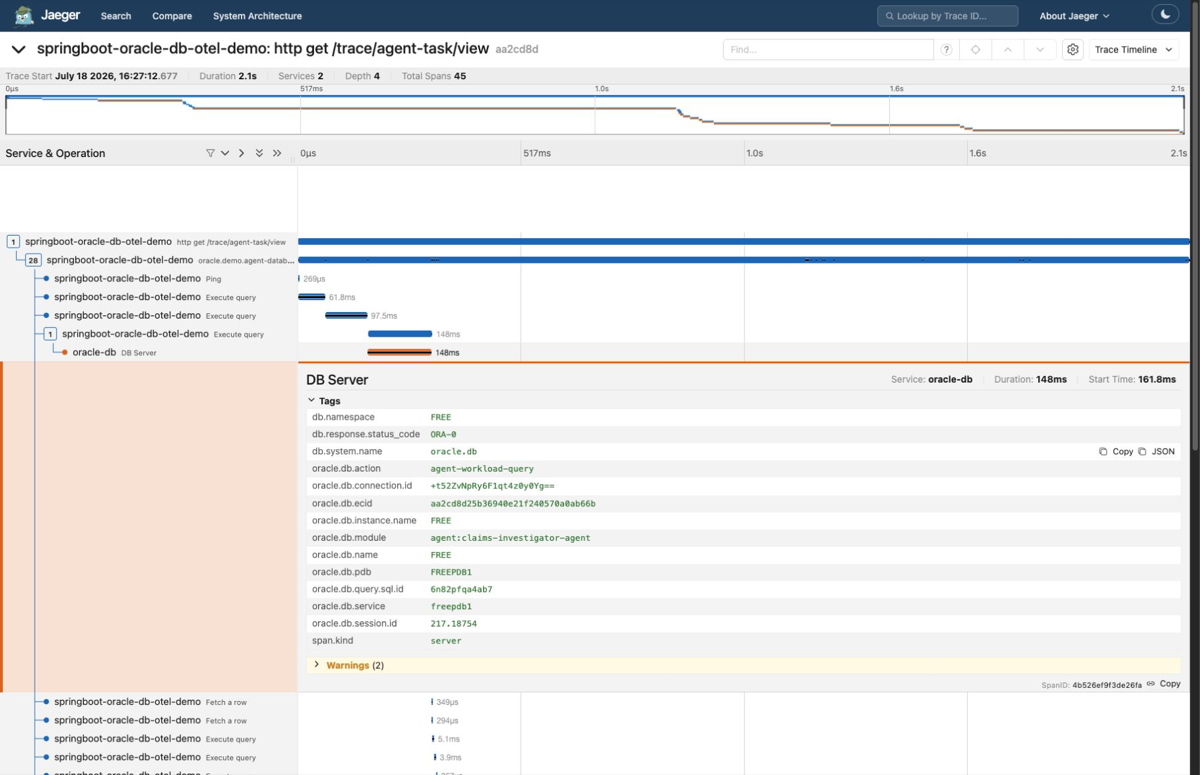
In Jaeger, the orange oracle-db / DB Server span then carries database-side evidence such as oracle.db.module, oracle.db.action, oracle.db.session.id, oracle.db.pdb, and oracle.db.query.sql.id.
Some of these names can also appear in client-side JDBC spans because the driver can receive database metadata and the application deliberately sets MODULE, ACTION, and CLIENT_IDENTIFIER. The important difference is provenance and timing: the oracle-db / DB Server span is emitted by Oracle AI Database itself, with database-side duration, response status, session context, and SQL identity attached to the server’s view of the work. A client span can time the Java round trip, but it cannot by itself prove the database server’s own span timing in the same trace.
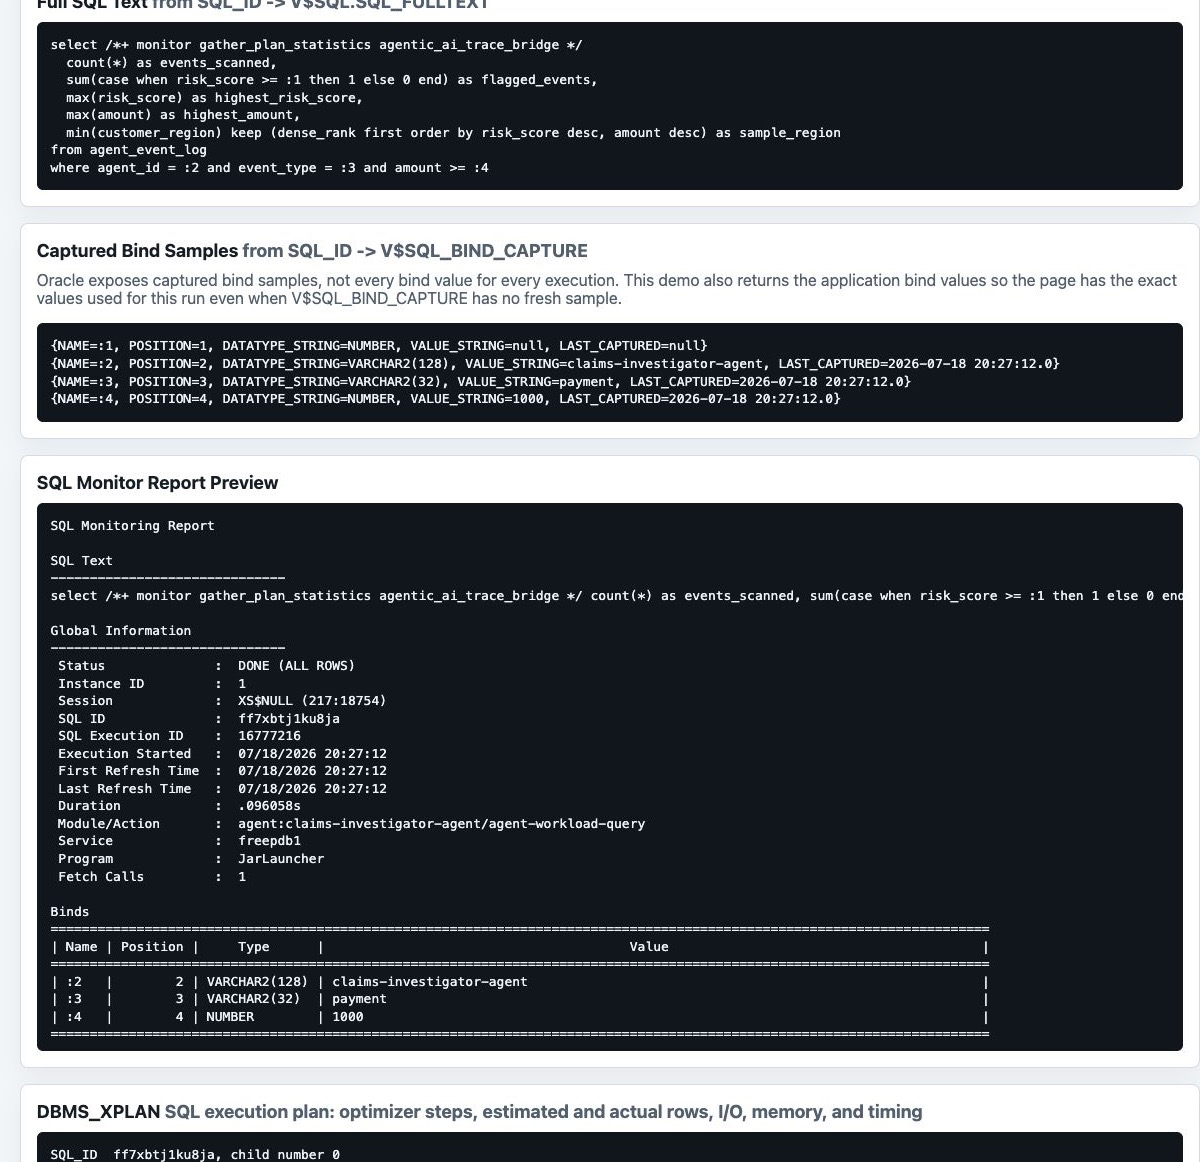
How Do We Link the Trace to SQL Diagnostics?
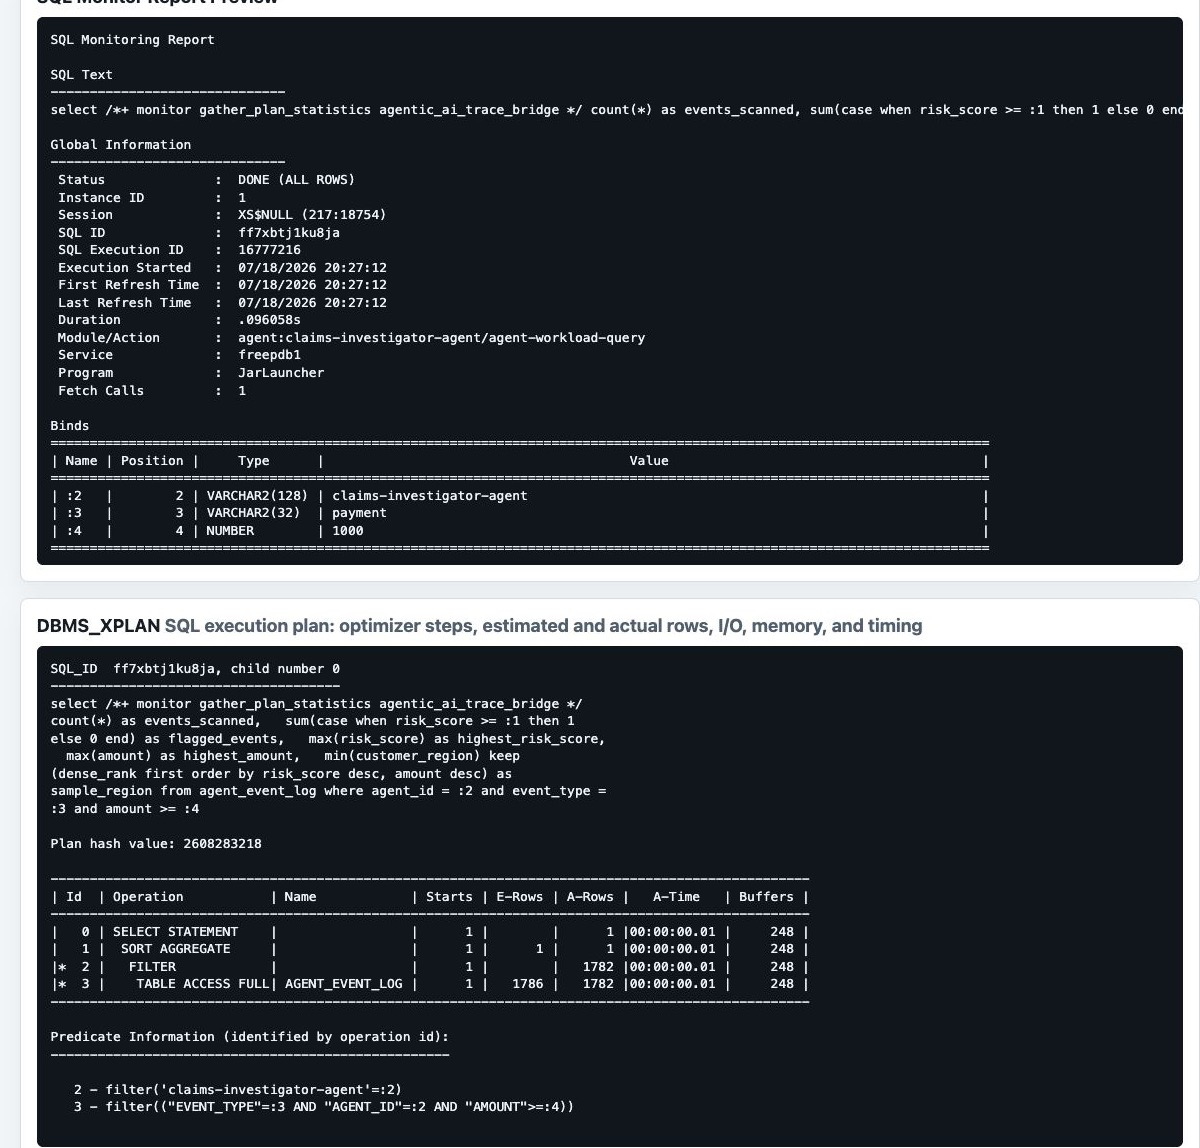
The demo returns a canonical SQL ID from the cursor used for its DBMS_XPLAN and SQL Monitor lookups. Oracle JDBC spans and database-exported spans can also expose oracle.db.query.sql.id, but do not assume that every layer will report the same cursor. A verified run for the screenshots in this article returned one canonical SQL ID on the demo page and a different SQL ID on the selected oracle-db / DB Server span.
Keep the correlation intact with the trace id, database ECID, MODULE, ACTION, and session id. Then use the canonical SQL ID returned by the page for its V$SQL, bind capture, SQL Monitor, and DBMS_XPLAN drill-down. A SQL ID on a particular span remains useful evidence, but it identifies that span’s database cursor rather than a guaranteed cross-layer identifier.
| Evidence | Where it comes from |
|---|---|
| Visual trace and database server evidence | Trace id, ECID, module, action, session id, and any layer-specific oracle.db.query.sql.id attribute |
| Full SQL text | Canonical SQL_ID -> V$SQL.SQL_FULLTEXT |
| Captured bind samples | SQL_ID -> V$SQL_BIND_CAPTURE |
| Runtime plan | DBMS_XPLAN.DISPLAY_CURSOR, the SQL execution plan with optimizer steps, estimated and actual rows, I/O, memory, and timing |
| SQL Monitor report | DBMS_SQL_MONITOR.REPORT_SQL_MONITOR |
The demo also calls DBMS_SQL_MONITOR.BEGIN_OPERATION around the agent task. That call is different from setting JDBC end-to-end metrics: it creates a named database operation for SQL Monitor so the agent task has a database-side operation id and attributes. The trace and SQL-ID bridge still work without it, because the workload SQL uses the MONITOR hint and the app queries V$SQL, V$SQL_BIND_CAPTURE, SQL Monitor, and DBMS_XPLAN by SQL ID. Keeping BEGIN_OPERATION makes the demo stronger by giving SQL Monitor a named server-side operation for the agent task; removing it would simplify privileges and code, but would lose that named database-operation evidence.
What Does the Agentic AI Demo Page Show?
The browser endpoint keeps the demo cohesive by returning the agent story, database diagnostics, and Jaeger trace on one page:
http://localhost:8080/trace/agent-task/view?agentId=claims-investigator-agent&task=investigate_payment_anomaliesThe page includes:
- Agent id and task name.
- Trace id and SQL ID bridge.
- Database session context, including module/action/client identifier.
- Application bind values used by this exact request.
- Full SQL Text heading labeled
from SQL_ID -> V$SQL.SQL_FULLTEXT. - Captured Bind Samples heading labeled
from SQL_ID -> V$SQL_BIND_CAPTURE. - SQL Monitor and
DBMS_XPLANoutput. - An embedded Jaeger trace loaded after a short delay so spans have time to flush.
What Does Success Look Like?
In the verified Linux environment, Jaeger showed a single trace containing both services: springboot-oracle-db-otel-demo from the Java process and oracle-db from Oracle AI Database server-side export.
{
  "services": [
    "oracle-db",
    "springboot-oracle-db-otel-demo"
  ],
  "ops": [
    "DB Server",
    "Execute query",
    "Fetch a row",
    "http get /trace/agent-task",
    "oracle.demo.agent-database-investigation"
  ]
}
Oracle Database Metrics Exporter (External)
Server-side OpenTelemetry spans answer request-scoped questions: which agent request reached the database, how long that database work took, which SQL ID was involved, and how the database span fits into the same trace as the Java service. For fleet-level and time-series questions, pair that with the external Oracle AI Database Metrics Exporter from oracle/oracle-db-appdev-monitoring.
The exporter is a separate process or container that connects to one or more Oracle AI Database instances and exposes database metrics in standard Prometheus/OpenTelemetry formats. Oracle’s exporter project includes default metrics, custom metrics defined in YAML or TOML, support for single instance, clustered, Autonomous, cloud, on-premises, Kubernetes, and container-based databases, plus sample Grafana dashboards.
| Signal | Best question | How it complements this demo |
|---|---|---|
| Server-side OpenTelemetry trace export | What happened during this specific agent request? | Shows the database span in the same trace as Spring Boot, JDBC, SQL ID, module/action, and agent metadata. |
| Oracle AI Database Metrics Exporter | What is happening across the database over time? | Adds dashboards and alerts for resource use, sessions, waits, workload health, and custom business or security metrics. |
A practical setup is to run both signals into the same observability platform. Keep this demo’s OTLP trace path for request-level causality, and deploy the exporter beside the database environment for database metrics:
Spring Boot + Oracle JDBC provider -> OTLP traces -> collector/backend
Oracle AI Database server-side exporter -> HTTPS OTLP traces -> collector/backend
Oracle AI Database Metrics Exporter -> Prometheus/OpenTelemetry metrics -> collector/backend
Used together, traces and metrics give a stronger agentic AI operations story: the trace explains one request all the way into Oracle AI Database, while the metrics exporter shows whether that request happened during broader database pressure, session growth, wait spikes, alert-log events, or workload-specific metric changes.
How Does the Trace Connect to Security and Auditing?
The demo correlates its trace with Oracle AI Database Deep Data Security. Observability shows what the agent did; database security explains why Oracle AI Database allowed or denied it. The trace already carries the join keys needed for that correlation:
trace.traceIdidentifies the distributed request.agent.ididentifies the AI actor in the application span.oracle.db.module=agent:<agent-id>identifies the same actor inside Oracle AI Database.oracle.db.actionidentifies the database phase.CLIENT_IDENTIFIER=traceId=<trace-id>gives database security and audit policy a compact correlation value.oracle.db.query.sql.idbridges the trace to SQL text, SQL Monitor,DBMS_XPLAN, and later audit records.
The sample app now includes a Database Security Context panel backed by a real password-authenticated local Deep Data Security end user. It works without Entra ID, OCI IAM, OAuth tokens, or a JDBC EndUserSecurityContext call. The page correlates the trace with ORA_END_USER_CONTEXT.username, the associated schema, MODULE, ACTION, CLIENT_IDENTIFIER, enabled database roles, effective privileges, the granted data role, the applicable data grant, and V$END_USER_DATA_ROLE for this request. A row-filtering proof runs in that same traced session and shows both the number of rows allowed by the data grant and zero visible rows for other agents.
The panel deliberately separates regular Oracle Database roles from Oracle AI Database Deep Data Security data roles. A role such as SELECT_CATALOG_ROLE is a normal session role and appears in SESSION_ROLES. A DDS data role such as AGENT_CLAIMS_INVESTIGATOR appears in DBA_DATA_ROLES and receives data grants in DBA_DATA_GRANTS. The local setup script observability/sql/setup_local_deep_data_security.sql creates the local end user claims-investigator-agent, assigns AGENT_CLAIMS_INVESTIGATOR with GRANT DATA ROLE, and grants that role SELECT access to only the agent’s event-log rows. The FINANCIAL database user remains the owning schema rather than the runtime principal.
A Deep Sec local end user is distinct from a conventional database user. Data roles cannot be granted directly to the FINANCIAL schema account. Direct password login as the local end user establishes the end-user security context in Oracle AI Database and activates the assigned data role without application-side token propagation. The Entra ID and OCI IAM provider/API examples remain the right pattern when an application must propagate externally managed end-user identities through a shared pool user.
A security-aware version can run the same agent workload against protected tables, then show effective database user, enabled roles, policy decisions, rows allowed or filtered, and a denied-operation example. After that, a scoped audit policy can record the same actor, module, action, SQL ID, and trace id so the page shows one story: this agent made this request, Oracle AI Database enforced these policies, and the audit trail recorded it.
The trace itself is not auditing. It is observability: useful for debugging, performance, causality, and visual correlation. Auditing requires durable database records, such as Unified Auditing or Fine-Grained Auditing entries, retained under a security-controlled policy. The best pattern is to use traces to explain the execution path and audit records to prove the security-relevant facts.
A companion design note expands this direction: Agent Security Observability With Oracle AI Database.
How Can This Connect to Model Observability?
Agent observability should not stop at infrastructure traces. The same task can also be correlated with model-level telemetry: prompt, model, tool calls, retrieval steps, latency, token usage, evaluator scores, and final answer quality. Tools such as LangSmith, OpenTelemetry-based GenAI semantic conventions, or enterprise AI observability platforms can capture those model and agent workflow details.
The useful pattern is to carry the same task or trace identifier through the agent workflow, the Java service, Oracle JDBC, and Oracle AI Database. Then one investigation can answer: which agent ran, which prompt or plan it used, which tool call reached the database, how long the database took, which SQL ran, and which database security policies applied. That ties model observability, application observability, database observability, and security review into one storyline.
References
- Source code for this demo
- Oracle JDBC Observability provider
- Oracle JDBC OpenTelemetry provider
- Oracle
DBMS_OBSERVABILITY - Oracle SQL monitoring and tracing
- Oracle AI Database application tracing
- Oracle AI Database Metrics Exporter project
- Oracle Database Metrics Exporter
- Video Day One and Beyond – MultiCloud Observability & Management for Oracle Database@X, Sonali Malik
- AI Agent Observability: Understand How AI Agents Behave in Gen AI Applications and Ecosystems, Royce Fu and Alex Birzu
- OpenTelemetry Java agent
- OpenTelemetry protocol exporters
- Spring Boot tracing
FAQ
Does this replace database auditing?
No. The trace is observability, not an audit trail. Use Oracle AI Database Unified Auditing or Fine-Grained Auditing when you need durable security evidence about users, roles, objects, SQL, and policy decisions.
Do I have to use Jaeger?
No. Jaeger is used here because it is easy to run and inspect, but the demo exports OpenTelemetry traces. The same approach can feed any OpenTelemetry-compatible observability tool that can receive the app/JDBC spans and the Oracle AI Database server-side spans.
What makes this different from ordinary database tracing?
Ordinary application traces often stop at the database edge. Oracle AI Database can export database server-side spans into the same trace, so the database portion is visible without breaking continuity or switching immediately to a separate diagnostic workflow.
Why frame this as an AI agent workload?
Agentic applications need explainability across application and database boundaries. Adding agent id, task, module, action, client identifier, and SQL_ID makes the trace useful for operations, security review, and future audit correlation.