The number of PX servers that a SQL statement needs depend on the execution plan and the degree of parallelism (DOP) of the statement. Most statements use DOP*2 number of PX servers as a result of the producer/consumer model used in parallel execution.
We sometimes get questions from users about statements using many more PX servers than they expect. They say “I have a statement with a DOP of 8 and I see that it uses 64 processes”. These types of statements typically involve multiple parallelizers. We have looked at how you can identify such statements in the previous post, that post also covers basic terminology so please read that post before going into this.
In this post we will look at a few example cases that can generate plans with multiple parallelizers and how those plans behave at runtime. We will also talk about the implications of having such statements in your system. The examples used here are based on 12c. Ideally a user should be able to control the number of PX servers for a statement, this is not the case when you have multiple parallelizers. We are trying to minimize cases of multiple parallelizers but I wanted to explain what the current behavior is.
Multiple nonconcurrent parallelizers
The typical case where you can see multiple parallelizers is temp table transformation. With temp table transformation Oracle creates temporary tables at runtime, stores intermediate results in those tables and queries them during the execution of the statement. The optimizer can decide to use temp table transformation with subquery factoring a.k.a. WITH clause, grouping sets, star queries, and in-memory aggregation.
Let’s look at a simple query with grouping sets as an example to understand how multiple parallelizers work.
SELECT /*+ parallel(2) */ channel_desc, calendar_month_desc, SUM(amount_sold)
FROM sales, times, channels
WHERE sales.time_id=times.time_id
AND sales.channel_id= channels.channel_id
GROUP BY GROUPING SETS(channel_desc, calendar_month_desc);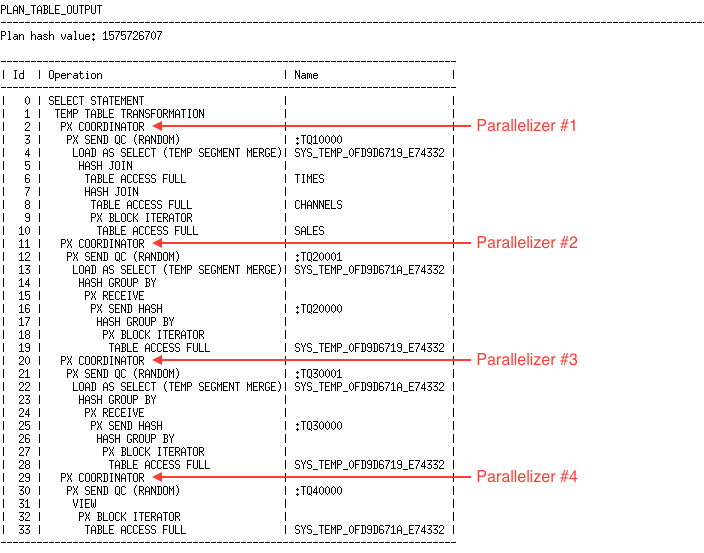
This plan has 4 parallelizers (Line Ids 2, 11, 20, 29). The parallelizers #1 and #4 have one DFO each which means each of them needs one PX server set (2 PX servers as the DOP is 2). The parallelizers #2 and #3 have 2 DFOs each which means they need 2 PX server sets (4 PX servers as the DOP is 2). The important question here is, will these parallelizers execute concurrently? If they are concurrent this statement will use 12 PX servers, if they are not concurrent the statement can run with fewer PX servers.
In the case of temp table transformation parallelizers do not execute concurrently, they run one after the other. Here is a timeline of execution for this plan.

T0: First parallelizer #1 starts and allocates 2 PX servers, it joins three tables and loads the result set into a temporary table (SYS_TEMP_0FD9D6719_E74332).
T1: When this parallelizer finishes it releases the PX servers back to the pool. These PX servers are now available for anyone to use.
T2: Now parallelizer #2 can start, it allocates 4 PX servers from the pool, these may be the same ones released by the previous parallelizer or they may be different PX servers from the pool. This parallelizer reads from the temporary table created previously, does the group by operation and loads the results into a new temporary table (SYS_TEMP_0FD9D671A_E74332).
T3: Now it releases the PX servers back to the pool and these PX servers become available in the system.
T4, T5: Parallelizer #3 does the same thing, it allocates 4 PX servers and releases them when it finishes.
T6, T7: Now the last parallelizer (#4) starts, it allocates 2 PX servers, reads from the temporary table created previously (SYS_TEMP_0FD9D671A_E74332), sends the results to the user and releases the PX servers when it finishes.
This sequence of execution shows that the maximum number of PX servers used concurrently was 4, not more. In this case we used DOP*2 number of PX servers concurrently even though we had multiple parallelizers. This is because a parallelizer allocates PX servers only when it starts and releases them when it finishes. A parallelizer is started only when it is needed in the runtime execution of the plan.
Here is what v$pq_sesstat shows after running this query.
STATISTIC                      LAST_QUERY SESSION_TOTAL     CON_ID
------------------------------ ---------- ------------- ----------
Queries Parallelized                    1             1          0
DML Parallelized                        0             4          0
DDL Parallelized                        0             0          0
DFO Trees                               1             5          0
Server Threads                          2             0          0
Allocation Height                       2             0          0
Allocation Width                        1             0          0
Local Msgs Sent                        86          3113          0
Distr Msgs Sent                         0             0          0
Local Msgs Recv'd                      90          3123          0
Distr Msgs Recv'd                       0             0          0
DOP                                     2             0          0
Slave Sets                              1             0          0
Even though we used 4 PX servers concurrently it shows we used 2 (Servers Threads), this is because v$pq_sesstat only shows stats from the last active parallelizer which was Line Id 32 in this case.
To find the actual number of PX servers used concurrently you need to look at v$px_session when the statement is running. Here is what that view shows when the statement is running and the second parallelizer is active (my session’s SID which is also the QC SID was 26 in this case).
select qcsid,sid,server_group,server_set,server#
from v$px_session where qcsid=26
     QCSID        SID SERVER_GROUP SERVER_SET    SERVER#
---------- ---------- ------------ ---------- ----------
        26        791            1          1          1 <--- Server Set #1, PX Server #1
        26         14            1          1          2 <--- Server Set #1, PX Server #2
        26        786            1          2          1 <--- Server Set #2, PX Server #1
        26         33            1          2          2 <--- Server Set #2, PX Server #2
        26         26                                    <--- Query Coordinator
This shows that at the time I looked at v$px_session there were 5 sessions working for my query, one was the QC (sid=26), the others were 4 PX server sessions. There was one parallelizer active (server_group=1) and it had 2 PX server sets (server_set) and 4 PX servers (server#). As the statement proceeds you will see that this view will show the active parallelizers and PX servers.
SQL Monitor also nicely shows which parallelizers are active by showing the active operations in the plan.
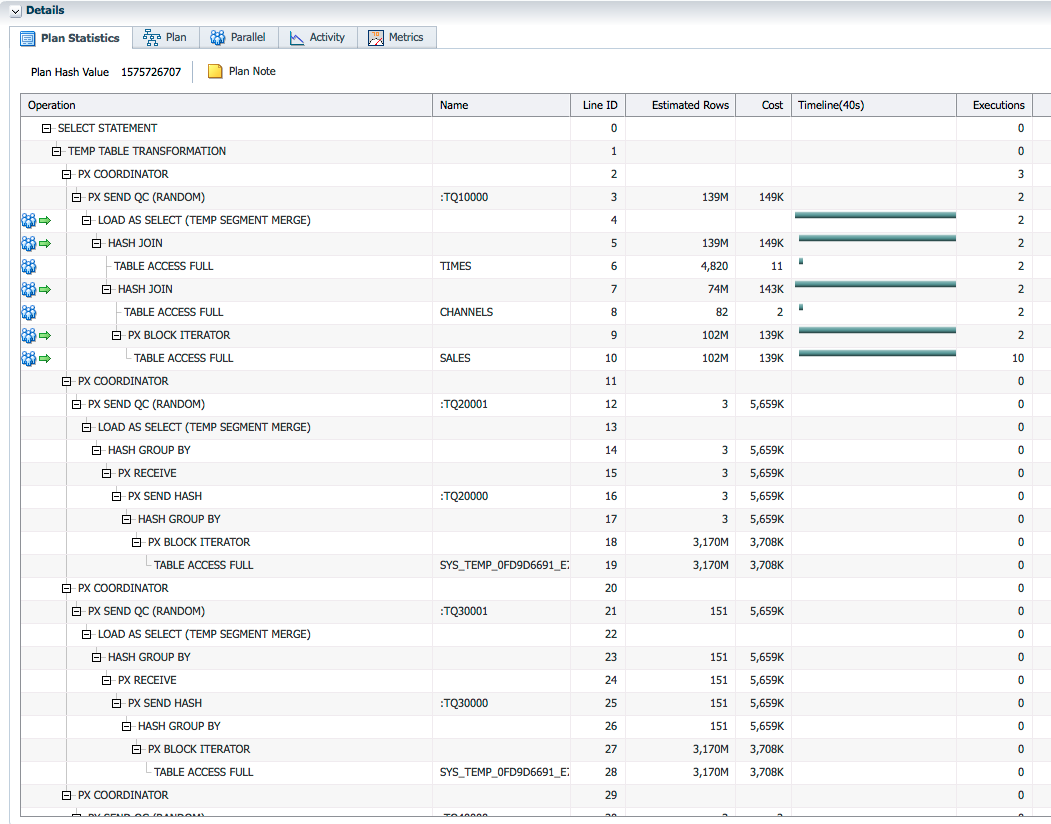
In this screenshot you can see that only the first parallelizer is active at this time.
Multiple concurrent parallelizers
A typical case where multiple parallelizers run concurrently is noncorrelated subqueries. Here is an example showing this case.
SELECT /*+ parallel(2) */ DISTINCT prod_id
FROM sales
WHERE amount_sold >
  (SELECT AVG(amount_sold) FROM sales)
AND quantity_sold >
  (SELECT AVG(quantity_sold) FROM sales)  ;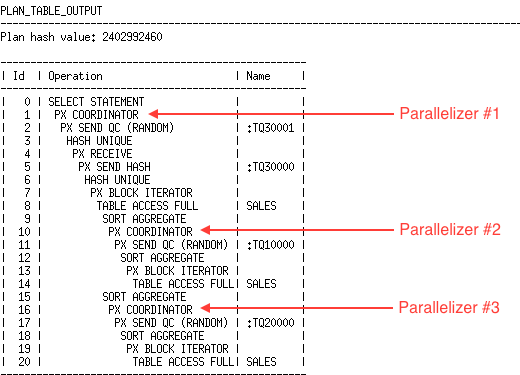
We have 3 parallelizers in this plan, Line Ids 1, 10, and 16. Here is a timeline of the execution for this plan.
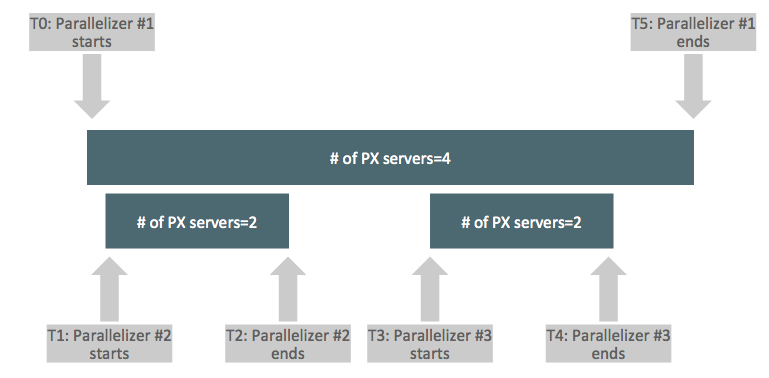
T0: This plan starts with parallelizer #1, since this parallelizer needs 2 PX server sets it allocates 4 PX servers as the DOP is 2. This parallelizer requires the outputs of the filter subqueries so now the other parallelizers will be started.
T1: While still keeping the initial 4 PX servers allocated we now start the second parallelizer (#2), this parallelizer only needs one PX server set, so it allocates 2 PX servers. We now have a total of 6 PX servers concurrently allocated for this query.
T2: When the first subquery finishes running this second parallelizer is now finished, so it releases 2 PX servers it allocated.
T3, T4: Now the third parallelizer (#3) starts, allocates 2 PX servers and releases them when it finishes.
The first parallelizer now has the results of both subqueries and can continue scanning and filtering the sales table. So, this query starts at most 2 parallelizers concurrently and uses 6 PX servers concurrently at any point.
UPDATE, 14 Dec 2015: The actual order of allocating PX servers is parallelizer #1, #3, and #2. Please see the comments for this correction.
If we look at v$pq_sesstat after this query ends it reports 8 PX servers (Server Threads), not 6. This is because this view does not show the number of PX servers used concurrently, but shows the accumulated number of PX servers during the execution even if the same PX servers were released and allocated.
STATISTIC                      LAST_QUERY SESSION_TOTAL     CON_ID
------------------------------ ---------- ------------- ----------
Queries Parallelized                    1             3          0
DML Parallelized                        0             0          0
DDL Parallelized                        0             0          0
DFO Trees                               3             7          0
Server Threads                          8             0          0
Allocation Height                       2             0          0
Allocation Width                        1             0          0
Local Msgs Sent                       120           296          0
Distr Msgs Sent                         0             0          0
Local Msgs Recv'd                     120           296          0
Distr Msgs Recv'd                       0             0          0
DOP                                     2             0          0
Slave Sets                              4             0          0
Again, if you want to find out the number of PX servers allocated concurrently for statements with multiple parallelizers use the view v$px_session instead.
Implications of multiple parallelizers
Downgrades
A statement with a single parallelizer allocates the required number of PX servers at the start and uses them without releasing until it finishes. So the number of PX servers throughout the execution is constant. Statements with multiple parallelizers are different as we saw in the above examples, they allocate PX servers when each parallelizer starts. Since parallelizers can start at different times during the execution each parallelizer may be running with a different number of PX servers based on the number of available processes in the system. Basically the rules about DOP downgrades I talked before apply to each parallelizer individually.
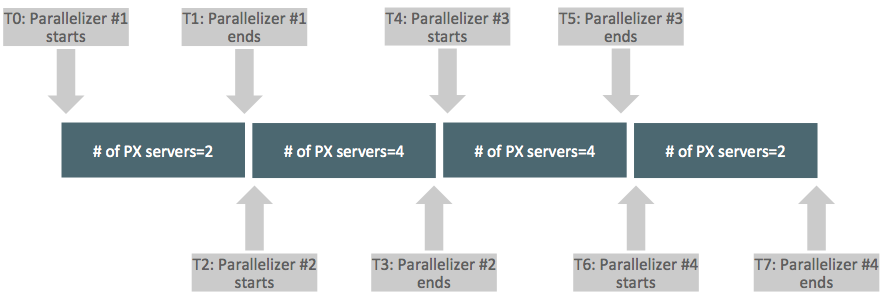
Consider the sequence of execution above. When parallelizer #1 starts it will try to allocate 2 PX servers. Assuming there are enough available PX servers in the system it will get those processes. When it finishes and releases them parallelizer #2 will start and try to allocate 4 PX servers. If at this point there are no available PX servers in the system this parallelizer will run serially. The same is true for the subsequent parallelizers.
Parallel Statement Queuing
Parallel Statement Queuing decides to queue or run a parallel statement based on its DOP and the number of available PX servers. It assumes no statement will use more than 2 PX server sets (thus DOP*2 number of PX servers). Consider the case where the DOP is 8 and there are 16 PX servers available below parallel_servers_target. Oracle will allow this query to run, but if this statement uses multiple concurrent parallelizers and starts using 24 PX servers the queuing point will be exceeded. When a statement is picked from the queue and allowed to run it is free to allocate any number of PX servers it needs. Depending on the number of these kinds of statements running at the same time all PX servers in the system can be consumed. This effectively eliminates the benefit of queuing and statements may start getting downgraded because of PX server shortage in the system. So, if you are using Parallel Statement Queuing and if you see that parallel_servers_target is exceeded look for statements with multiple parallelizers as possible suspects. We are working to fix this behavior in future releases. Until then make sure there is enough gap between parallel_servers_target and parallel_max_servers to prevent downgrades.
Database Resource Manager DOP limits
We have had some users setting DOP limits using Database Resource Manager (DBRM) and expecting all statements to be limited to DOP*2 number of PX servers. As of today that expectation is not true for statements with multiple concurrent parallelizers. For example even if DBRM limits the DOP to 2, a statement with a DOP of 2 can use 6 PX servers concurrently as we saw in example #2.
Summary
Here is a short summary of what we have discussed in this post.
1. Multiple parallelizers can run concurrently or nonconcurrently.
2. Each parallelizer allocates PX servers when it starts, the number of PX servers allocated by each parallelizer depends on the number of PX server sets and can be at most DOP*2.
3. v$pq_sesstat may show incorrect information depending on the concurrency of multiple parallelizers, watch the behavior at runtime instead.
4. Each parallelizer may or may not get the required number of PX servers depending on the number of available PX servers in the system.
5. Parallel Statement Queuing assumes each statement will use DOP*2 number of PX servers, this can cause statements with multiple parallelizers to be allowed to run and exceed the queuing point (parallel_servers_target). To prevent downgrades in this case make sure there is enough gap between parallel_servers_target and parallel_max_servers.
I am planning to cover Parallel Statement Queuing in detail in a future post, we will come back to this topic in there, so please come back for that one too.
In each release we are trying to decrease the number of cases that can generate plans with multiple parallelizers. If you are on 11g you will see that some plans with multiple parallelizers will switch to using a single parallelizer when you upgrade to 12c. In the next post I will talk about those cases and compare 11g to 12c in this regard.
