Introduction
SQL Trace has always been one of the greatest performance monitoring tools that have come along in the Oracle Database. It’s part of a suite that includes AWR, ASH, ADDM, SPM. SQL Trace is designed for those really difficult problems that requires deep SQL execution analysis.
Usually the tracing operation required access to the OS. Now, with the evolution to Autonomous Database, OS access is no longer a necessary requirement. In fact, trace files can be stored in an object store in your cloud account, which opens up more performance tuning opportunities for developers and DBAs.
The SQL trace is useful to help you identify the source of an excessive database workload, such as a high load SQL statement in your application.
The purpose of this guide, is to complement the documentation reference and to explain with an example how extract a trace from ADB, download it and make it readable.
Steps:
- Configure SQL Tracing on Autonomous Database
- Enable SQL Tracing on Autonomous Database
- Enabling the trace using a trigger
- Disable SQL Tracing on Autonomous Database
- View Trace File Saved to Cloud Object Store on Autonomous Database
- Conclusions
1. Configure SQL Tracing on Autonomous Database
In this section, the preliminary steps will be explained, before proceeding to activate the trace command.
First, create a standard object storage bucket with public access, to host our trace files. This guide can help to achieve it Create an Object Storage Service.
Once the bucket is created, set up the credential to access that bucket from ADB. You can access the ADB with ADMIN, or any other user, and run this command:
BEGIN
  DBMS_CLOUD.CREATE_CREDENTIAL(
    credential_name => '<credential_name>',
    username => '<tenancy_user>',
    password => '<token_tenancy_user_psw>'
);
END;
/
All the specifics parameters are explained in this page.
The password parameter refers to the Authentication Token credential account. The procedure is explained in the following guides How can I create an OCI Auth Token? or in the LAB6-TASK5 of this livelabs Create an Object storage Auth Token.
Once the credentials are set up, I can check them with this command:
select owner, credential_name,username,comments,enabled
from dba_credentials
order by owner, credential_name;
Now I can verify access to the bucket, listing the bucket’s files using the DBMS_CLOUD.LIST_OBJECTS function. I have used the parameters from a real example:
select object_name, round(bytes/1024/1024,3) file_size_MB, created, last_modified
from DBMS_CLOUD.LIST_OBJECTS(
    credential_name => 'OBJ_STORE_CRED',
    location_uri => 'https://objectstorage.eu-frankfurt-1.oraclecloud.com/n/fro8fl9kuqli/b/end-bucket/o/trace');
In my example I also added a folder called “trace” in the bucket where the trace will end up.
Next, set two database properties: DEFAULT_LOGGING_BUCKET and DEFAULT_CREDENTIAL
- DEFAULT_LOGGING_BUCKET: specifies the logging bucket destination on Cloud Object Storage using the same URI specified before. So, accessing again to ADB with ADMIN user
ALTER DATABASE PROPERTY SET DEFAULT_LOGGING_BUCKET = '<object_storage_uri>';
For example
ALTER DATABASE PROPERTY SET DEFAULT_LOGGING_BUCKET = 'https://objectstorage.eu-frankfurt-1.oraclecloud.com/n/fro8fl9kuqli/b/end-bucket/o/trace/';
Note: the trailing slash after the /trace/ is important since this is setting the “root” from where trace files will be created.
- DEFAULT_CREDENTIAL: defines the credential we will be using to access that specific bucket. In the example I’ll use the ones I created in the previous steps:
ALTER DATABASE PROPERTY SET DEFAULT_CREDENTIAL = '<user>.<credential_name>';
For example:
ALTER DATABASE PROPERTY SET DEFAULT_CREDENTIAL = 'ADMIN.OBJ_STORE_CRED';
Verify the DEFAULT_CREDENTAILS and DEFAULT_LOGGING_BUCKET using the following query:
select * from database_properties
where property_name IN ('DEFAULT_CREDENTIAL','DEFAULT_LOGGING_BUCKET');
2. Enable SQL Tracing on Autonomous Database
If you enable SQL tracing your application performance for the session may be degraded while the trace collection is enabled. This negative performance impact is expected due to the overhead of collecting and saving trace data.
Before enabling the tracing process there are two optional settings: the client identifier and the module name:
- Set a Client identifier for the application this step is optional but is recommended. SQL tracing uses the client identifier as a component of the trace file name when the trace file is written to Cloud Object Store. I can issue this with the application user or ADMIN.
For example:
BEGIN
  DBMS_SESSION.SET_IDENTIFIER('sqltrace_demo');
END;
/
- Set a Module name for the application This step is optional but is recommended. SQL tracing uses the module name as a component of the trace file name when the trace file is written to Cloud Object Store.
For example:
BEGIN
  DBMS_APPLICATION_INFO.SET_MODULE('shtest_adwstest', null);
END;
/
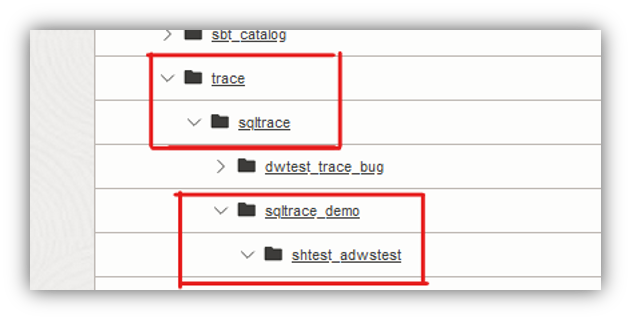
Enabling the two previous parameters (i.e. the identifier and the module) produces this tree path folder inside the object storage bucket:
Now we can enable the SQL Trace facility with this command:
ALTER SESSION SET SQL_TRACE = TRUE;
At this point it is possible to run the traffic to be tracked directly in this session.
Enabling the trace using a trigger
Alternatively, the trace can be fired through a customized TRIGGER. This mechanism gives the possibility of tracing the application traffic coming from any application user. The trigger can be easily installed under the ADMIN user. When the defined application session logs on and starts making traffic, the trace starts populating the trace file. As soon as the session disconnects, the trace ends and finalizes the file inside the bucket. All the configurations made in points 1 and 2 always apply.
In the example below, the TRIGGER named “trace_logon” is installed under ADMIN user. It automatically enables the trace as soon as the “SHTEST” user logs in to the database, imagining that this is part of an application session. It also creates a folder with client identifier called “TEST_TRACE” inside the folder path of the bucket. The tracing process ends as soon as the application user logs off. If the user logs in multiple times, it will generate multiple trace files.
create or replace trigger trace_logon
after logon on database
begin
  if sys_context('USERENV','SESSION_USER') = 'SHTEST'
  then
    DBMS_SESSION.SET_IDENTIFIER('TEST_TRACE');
    execute immediate 'ALTER SESSION SET SQL_TRACE = TRUE';
  end if;
END;
/
To delete the trigger:
drop trigger trace_logon;
3. Disable SQL Tracing on Autonomous Database
When you disable SQL tracing the collected data for the session is written to a table in your session and to a trace file in the bucket you configure when you set up SQL tracing. Tracing can be stopped by either setting sql_trace to FALSE or simply by disconnecting the user application session being monitored:
alter session set sql_trace = false;
Check if the trace file has been created properly under the bucket location by running the following query as the application user. The parameters are the same as before:
select object_name, round(bytes/1024/1024,3) file_size_MB, created, last_modified
from DBMS_CLOUD.LIST_OBJECTS(
    credential_name => 'OBJ_STORE_CRED',
    location_uri => 'https://objectstorage.eu-frankfurt-1.oraclecloud.com/n/fro8fl9kuqli/b/end-bucket/o/trace');
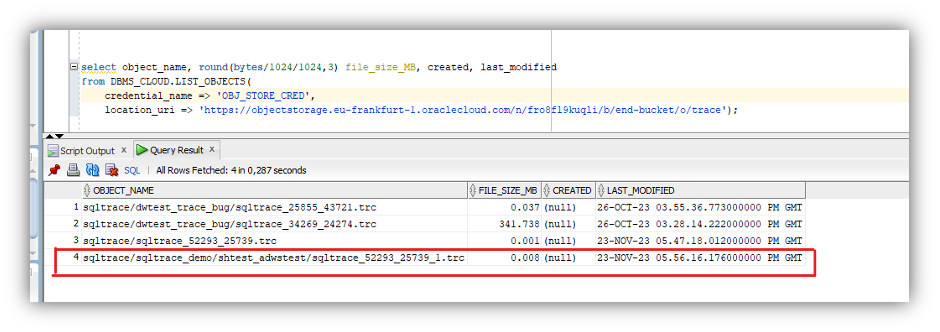
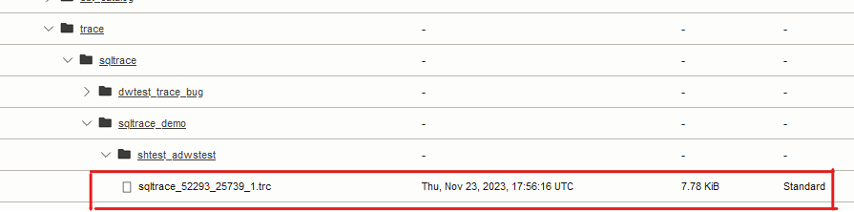
And we can find the same file in the bucket under the defined folder path. Now we can download it and analyze.
Optionally, once the logging activity is finished, you can remove the default_credential:
alter database property remove default_credential;
or
ALTER DATABASE PROPERTY SET DEFAULT_CREDENTIAL = '';
Optionally, once the logging activity is finished, you can reset the default logging bucket location:
alter database property remove DEFAULT_LOGGING_BUCKET;
or
ALTER DATABASE PROPERTY SET DEFAULT_LOGGING_BUCKET = '';
4. View Trace File Saved to Cloud Object Store on Autonomous Database
The SQL Trace facility will generate only one trace file if the analyzed query is executed serially. If instead it uses a degree of parallelism (DoP) greater than 1, the facility will produce multiple trace files with different numID1 and numID2 values, depending to the number of parallel processes opened during execution.
There are two options to view trace data:
1. View the trace file data saved to Cloud Object Store
Once the trace file has been identified, within the folder path inside the bucket, it is possible to download it locally or move it to another location (on a stage VM for example) through pre-authentication, with well-known file transfer methods such as cURL.
To convert the trace it into a readable output, use the TKPROF utility. For this tool, it is necessary to have an Oracle Home or full client installed. Instant Client is not sufficient because it only contains the basic libraries. Also, from the Cloud Shell it is not possible to directly launch a tkprof command but it is possible to jump to a vm or a database host that contains an Oracle Home.
Using tkprof to interpret the trace file collect is not the purpose of this blog but in this link points to a guide for using the tool explaining the parameters available.
2. You can also view the SQL Trace data using the view SESSION_CLOUD_TRACE. This is the same trace information that is saved to the trace file in the object storage bucket. Make sure you access the SESSION_CLOUD_TRACE view in the same session where the tracing was enabled.
The SESSION_CLOUD_TRACE view includes two columns: ROW_NUMBER and TRACE:
DESC SESSION_CLOUD_TRACE

Name       Null? Type

---------- ----- ------------------------------
ROW_NUMBER       NUMBER
TRACE            VARCHAR2(32767)
The ROW_NUMBER specifies the ordering for trace data. Each line of trace output written to a trace file becomes a row in the table and is available in the TRACE column.
After you disable SQL tracing for the session, you can run queries on the SESSION_CLOUD_TRACE view.
For example:
SELECT trace FROM SESSION_CLOUD_TRACE ORDER BY row_number;
The data in SESSION_CLOUD_TRACE persists for the duration of the session. After you log out or close the session, the data is no longer available. If SQL Trace is enabled and disabled multiple times within the same session, SESSION_CLOUD_TRACE shows the trace data for all the iterations cumulatively. Thus, re-enabling tracing in a session after previously disabling tracing does not remove the trace data produced by the earlier iteration.
5. Conclusions
Running SQL tracing and analyzing the trace file in Oracle Autonomous Database offers significant benefits for understanding and improving SQL performance. It enables detailed analysis, identifies bottlenecks, helps in troubleshooting complex issues, and provides opportunities for optimization, ensuring that your database workloads run efficiently and effectively.