Over time, I’ve been asked by many colleagues within Oracle as well as customers in the field to share a comprehensive guide on Parallel Replicat performance tuning. It’s a topic that comes up often, especially when latency issues surface in production environments. The question is usually the same:
“What should I do when Parallel Replicat starts lagging?”
It’s a great question, and one that deserves more than a quick answer. So in this post, I want to walk you through how I approach this challenge. Consider it a roadmap, built from experience for methodically identifying and fixing bottlenecks in Oracle GoldenGate’s Parallel Replicat.
Note: This blog focuses exclusively on Non-Integrated Parallel Replicat in Oracle GoldenGate for Oracle databases. It does not apply to non-Oracle databases or to Integrated Parallel Replicat mode.Unless your use case requires procedural replication or automatic conflict detection/resolution (CDR), Non-Integrated Parallel Replicat is the recommended and most performant configuration.Throughout this blog, whenever I refer to Parallel Replicat, I specifically mean Non-Integrated Parallel Replicat.
Let’s dive in.
The Engine Built for Speed
Parallel Replicat is a performance-first engine. It’s been designed from the ground up to run fast, really fast on modern hardware. It’s fully multithreaded and built to scale with your workload. When you give it the right conditions, solid CPU, memory, disk, and low-latency network, it can apply data with impressive throughput and help you meet even the toughest SLAs.
But sometimes, not everything is optimal. Maybe the infrastructure underneath is underpowered. Or the target database is under strain. Or maybe you’re dealing with a long-running batch transaction you didn’t even know existed.
That’s when latency creeps in, and tuning becomes essential.
Start with a Plan
Before diving into logs, metrics, or parameter tweaks, it’s important to take a step back. Performance tuning isn’t about instinct or trial and error. It’s about asking the right questions, understanding the architecture, and using a structured approach to find the problem.
When latency shows up, your goal is simple:
- Identify where the bottleneck is
- Figure out how to resolve it
To do that effectively, you need to understand how Parallel Replicat works behind the scenes.
Meet the Pipeline
Think of Parallel Replicat as a relay team, passing transactions from one stage to the next. Here’s how the data flows:
- Trail files (on disk)
- Mappers – Parse trail data and map it to relevant tables
- Merger (Collator) – Sorts records by SCN to preserve logical order
- Scheduler – Calculates dependencies between transactions
- Appliers (client-side) – Sends SQL to the corresponding server/shadow process in the target database for execution
- Network – Between the GoldenGate hub where Parallel Replicat is configured and the target server where Oracle RDBMS is hosted
- Applier server/shadow processes – Executes SQL on behalf of client applier sessions in the target database
All of this is orchestrated by a coordinator process, which owns and manages the pipeline. Some components are child processes (like mappers) of the coordinator process, while others are lightweight threads (LWPs in Linux).
Each part of the pipeline plays a critical role. For example:
- Mappers kick things off by reading trail data and performing mapping.
- The merger ensures SCN order.
- The scheduler handles dependency calculation.
- And the appliers do the final job of executing SQL in the target database.
The beauty of Parallel Replicat is in its design: it allows parallel execution without strict transaction ordering. That doesn’t mean it runs transactions out of order and breaks constraints, it performs dependency calculations and applies as many operations in parallel as possible, safely.
So Where’s the Problem?
Let’s say a customer reports lag. The target system isn’t getting data in real time. Now the detective work begins.
First, let’s define what we mean by lag: lag refers to latency, specifically the time difference between when a transaction was committed at the source database and when it was applied to the target database by Replicat. This tells you how far the replication is behind real-time.
As a best practice, the GoldenGate heartbeat table should be installed and enabled. When configured correctly, it captures and reports latency at regular intervals and highlights which part of the replication flow, extract, pump(or distribution server if you are using microservices) or replicat is contributing to it. It gives you a directional signal for your investigation, helping you decide where to dive deeper.
Additionally, it’s important to understand how Parallel Replicat applies transactions. It works within a boundary defined by a high watermark and a low watermark:
-
Below the low watermark, all transactions have been applied.
-
Between the low and high watermark, some transactions have been applied and others haven’t, depending on data dependencies such as foreign key relationships or other workload dependencies.
This means that even if you see a recent high watermark, there might still be lag in committed transactions that haven’t been applied due to unresolved dependencies. Understanding this behavior is key when interpreting latency metrics and deciding what to tune.
So ideally, your troubleshooting journey should start with the heartbeat table and then follow the trail, link by link, to isolate the source of the slowdown.
Before diving into database-level diagnostics, always review the Parallel Replicat report file first. The report file provides valuable insights, check the ReportCount(apply rate), and any logged messages that suggest performance degradation.
If the apply rate is low and there’s no obvious indication of serialization (we’ll cover clues for that in the Clues from the Report File section below), then it’s time to shift your focus to the database server as the likely bottleneck.
What the Database Is Trying to Tell You
When Parallel Replicat lag shows up and there is no obvious signs for serialization in the replicat report file, your next stop should be the AWR report, captured during the period of high latency.
I like to keep the AWR snapshot window short ~ 30 minutes is ideal. It keeps the signal clear and the noise low.
The Metric That Sets the Stage: DB Time/sec
Start by checking DB Time per Second (DB Time/sec). This metric gives you a sense of how hard the database was working during that interval.
Let’s interpret what it tells you:
- If DB Time/sec is high, especially if it’s close to the number of appliers defined in your replicat parameter file (and Parallel Replicat is the only workload in the target RDBMS), the database was actively processing transactions.
- Despite that if you’re still seeing lag, it likely means those transactions are hitting bottlenecks.
So we ask: where are those transactions spending their time?
Digging into Non-Idle Waits
Non-idle waits are silent performance killers. They slow things down without stopping them. These could be:
- I/O waits – db file sequential read, db file scattered read
- Concurrency waits – buffer busy waits, latch waits, mutex waits
There is a wide variety of non-idle waits. If these waits occupy a significant portion of total elapsed time, it’s time to dig deeper.
It is not practically feasible to list all of them and discuss how to mitigate each one of those waits. But the goal should be to mitigate those non-idle waits as much as possible.
Follow the Trail: SQL Ordered by Elapsed Time
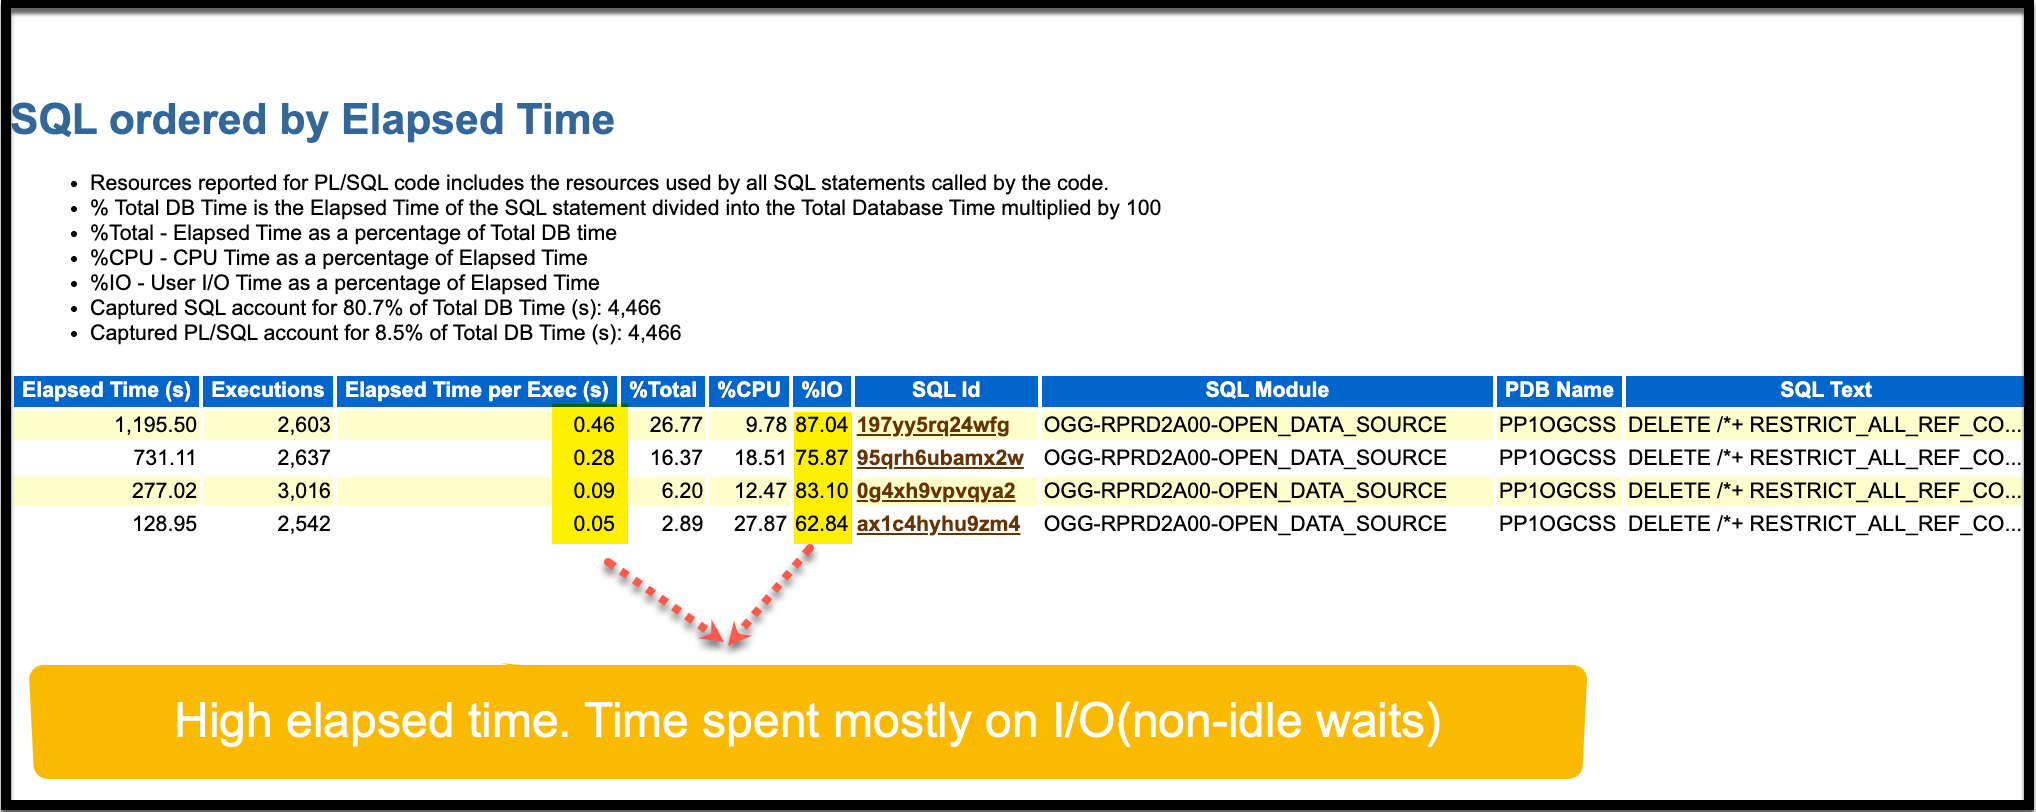
To begin your investigation, open the AWR (Automatic Workload Repository) report for the time window corresponding to the period of observed apply lag. Navigate to the section titled “SQL ordered by Elapsed Time.” This section lists the SQL statements that took the most cumulative time to execute during the snapshot interval and is one of the most effective starting points for identifying inefficient SQL driving bottlenecks.
Your objective here is to identify the SQLs issued by the Parallel Replicat applier sessions that are consuming excessive database resources.
How to do that?
Check the MODULE column to identify SQLs executed by the Parallel Replicat sessions. These entries represent DML or DDL operations being applied to the target database as part of your replication workload.
Once you’ve isolated the relevant SQLs, pay close attention to the “Elapsed Time” and “%DB Time” columns. These values indicate how much wall-clock time and proportion of total database time were spent executing each SQL. If a particular SQL has both high elapsed time and is associated with a Replicat module, it’s a prime candidate for further analysis.
Ask yourself:
- Is the elapsed time for these SQLs driven mostly by non-idle waits, such as I/O operations, latch contention, row-level locking, or high CPU usage?
- If the answer is non-idle waits, then you’ve found a likely bottleneck, one that should be prioritized for deeper investigation and tuning.
Understanding these non-idle wait events will help determine the underlying cause, whether it’s related to missing indexes, poor table design (e.g., no primary key), locking issues, or I/O constraints. From there, you can decide what corrective actions are appropriate: optimizing SQL, tuning the schema, or isolating slow tables into separate Replicat groups.
By starting with “SQL ordered by Elapsed Time” and focusing on non-idle waits in Parallel Replicat-applied SQL, you are zeroing in on exactly where database time is being consumed, allowing for targeted, high-impact tuning to reduce apply lag and improve throughput.
But what if the appliers are CPU-bound?
- Increase the the number of appliers. That should increase DB Time/sec, which in turn should boost apply throughput.
But if you observe high CPU usage in the target database along with a high number of buffer gets for the Parallel Replicat apply sessions, this is often indicative of inefficient data access paths during apply operations. One of the most common reasons for this is when the target table lacks a primary key (PK) or unique index (UI).
Without a defined PK or UI, the Replicat process cannot uniquely identify the target row based on the key values from the trail. As a result, it may be forced to perform full table scans or, in some cases, index range scans if there is a non-unique index present. These access paths are much more expensive in terms of logical I/O:
- A full table scan reads every block in the table to find a match, which can drive a large number of buffer gets, especially for wide or high-row-count tables.
- An index range scan, although slightly more efficient, may still access numerous index and table blocks if the index is not selective enough.
Over time, especially with high transaction volumes, these suboptimal access paths can severely impact CPU performance and cause significant contention for system resources like buffer cache and CPU cycles.
To mitigate this issue:
- If the application logic allows, consider temporarily adding primary keys or unique indexes on those target tables to help the Replicat process apply changes more efficiently.
- Alternatively, isolate such tables that lack PK/UI along with their associated child tables referenced through referential integrity into separate replicat groups. This ensures that even if those particular tables incur latency due to full scans, they do not become a bottleneck for other tables in the same Replicat configuration.
- Accept that replicats operating on tables without PK/UI will naturally perform slower for update and delete operations, but by decoupling them, you contain the performance impact and improve overall pipeline throughput.Taking these steps helps ensure that apply lag is localized to the problematic tables and does not cascade to otherwise well-performing parts of your replication workload.
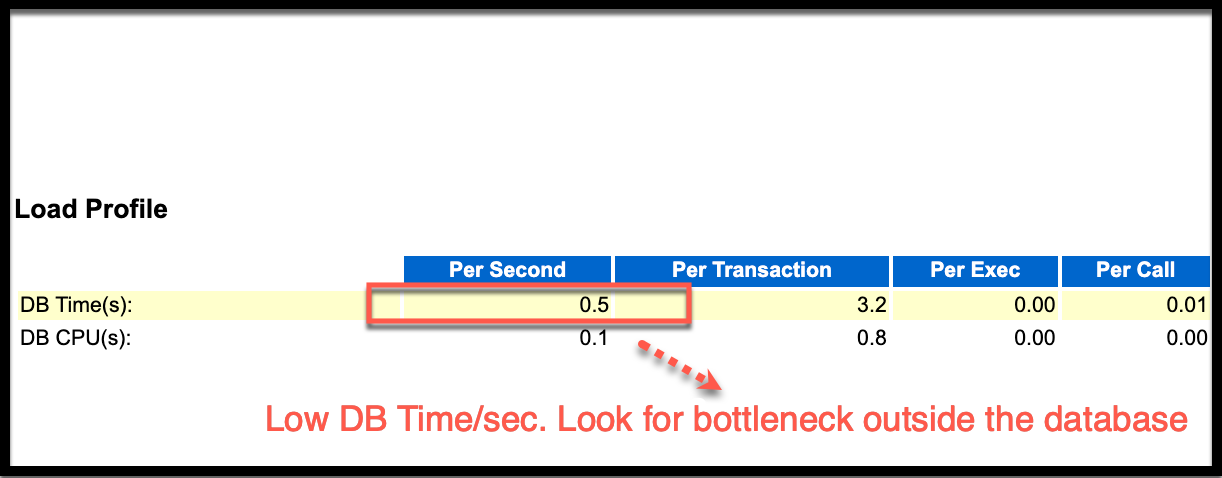
What If DB Time/sec Is Low?
If DB Time/sec is 1 or less, that tells a different story. It means the database isn’t doing much. Not because it’s idle, but because it’s not being fed work fast enough.
This points to a bottleneck outside the database, somewhere upstream in the replication pipeline.
That’s exactly where we go next.
Clues from the Replicat Report File
When the database isn’t the issue, your best friend is the Parallel Replicat report file. It logs crucial details, especially when the process falls back to serialized apply. A condition where Replicat temporarily disables parallelism and processes transactions one at a time. This usually happens when certain dependencies, metadata changes (DDLs) or other workload contraints, prevent safe parallel execution. While serialized apply ensures data integrity, it comes at the cost of performance, so understanding why it’s happening is key to resolving performance bottlenecks.
Here are the usual suspects and how to handle them
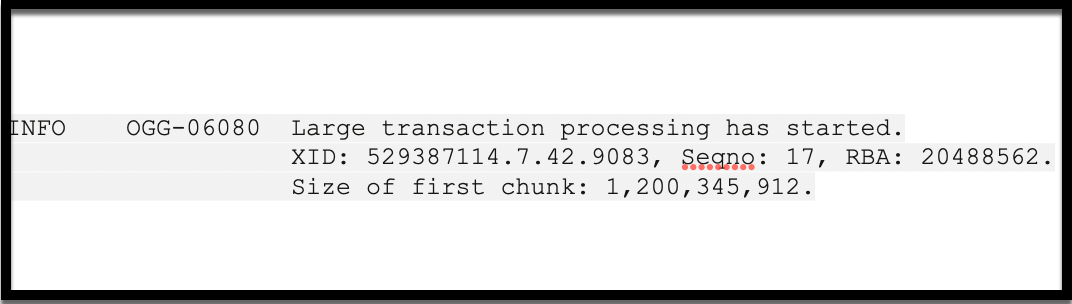
Long Transactions
One of the most common reasons Parallel Replicat may fallback to serialized apply is when it encounters a large transaction. By design, Parallel Replicat doesn’t break transactions by default. Each transaction is applied in full by a single applier thread to preserve atomicity and maintain referential integrity.
Whether a transaction is treated as “large” and forces serialization depends on the value of the CHUNK_SIZE parameter.
How CHUNK_SIZE Works
-
CHUNK_SIZE defines the maximum size in bytes for a transaction to still be considered safe for parallel apply.
-
The default value is 1 GB. If a transaction exceeds this threshold, Replicat treats it as barrier transaction, which forces serialization across the pipeline.
What Is a Barrier Transaction?
When Replicat encounters a barrier transaction:
- All prior transactions should be applied first.
- The large transaction is then applied serially by a single applier thread.
- Only after this transaction is fully applied and committed, Replicat resumes reading and scheduling other transactions.
This barrier behavior introduces a temporary full stop in parallel processing, so while Replicat remains active, it applies nothing else until the large transaction completes.
Examples to Illustrate Behavior
Let’s consider two transactions under the following configuration:
-
SPLIT_TRANS_RECS = 50000 -
CHUNK_SIZE is unset, meaning the default 1 GB applies
Example 1: Transaction size = 500 MB, number of changes = 200,000
Since this transaction is below the 1 GB CHUNK_SIZE, Replicat does not serialize it.
-
Replicat splits the transaction into four pieces:
-
(a) Changes 1–50,000
-
(b) Changes 50,001–100,000
-
(c) Changes 100,001–150,000
-
(d) Changes 150,001–200,000
-
-
These four pieces are evaluated for dependencies.
-
If no dependency exists, all four pieces can be applied in parallel, and they might even commit out of order.
-
If dependencies do exist (e.g., updates to the same rows), Replicat will enforce ordered apply, based on data dendencies. They may still be committed as four separate transactions if transactional boundaries allow.
-
Example 2: Transaction size = 100 GB, number of changes = 1,000,000 (LOB-heavy)
Though this transaction is broken into twenty pieces (50k changes each), each piece is still ~5 GB in size, exceeding the 1 GB CHUNK_SIZE.
-
In this case, even each piece is considered a large transaction.
-
Replicat marks the entire transaction as a barrier.
-
All other transactions are paused.
-
Transactions are applied serially by single applier thread.
-
No other scheduling occurs until these large transactions completes.
-
Best Practices
-
Avoid increasing CHUNK_SIZE unless you’re absolutely sure the system has enough memory headroom. A larger chunk size leads to greater memory consumption and may impact stability under load.
-
Instead, set SPLIT_TRANS_RECS to a reasonable value (e.g., 100,000). This enables large transactions to be divided into manageable pieces, which Replicat can potentially apply in parallel, provided dependencies allow.
-
Well-chosen SPLIT_TRANS_RECS values reduce the likelihood of hitting CHUNK_SIZE limits, enabling more scalable and efficient parallel apply.
EHCC (Exadata Hybrid Columnar Compression)
One of the lesser-known yet significant challenges in maintaining parallelism in Oracle GoldenGate Replicat is the presence of EHCC-compressed tables on the target. EHCC, or Exadata Hybrid Columnar Compression, is a space-saving technology used in Oracle databases, especially in Exadata, that organizes data by column within compression units, rather than storing each row individually.
Why EHCC Affects Parallel Replicat
EHCC changes the physical storage and locking behavior of the table:
-
Rows are grouped into compression units. These large blocks (potentially containing thousands of rows) that are compressed together.
-
When any single row in a compression unit is updated, the entire compression unit is locked at the storage level.
-
This means that even if two different threads are trying to update two unrelated rows, if those rows happen to exist in the same compression unit, Oracle will escalate the lock to that unit.
What’s the consequence?
When Parallel Replicat tries to apply changes using multiple applier threads:
-
Two appliers working on different rows may block each other unintentionally.
-
This can lead to deadlocks, blocking sessions, and hence forced fallback to serialized apply, degrading performance.
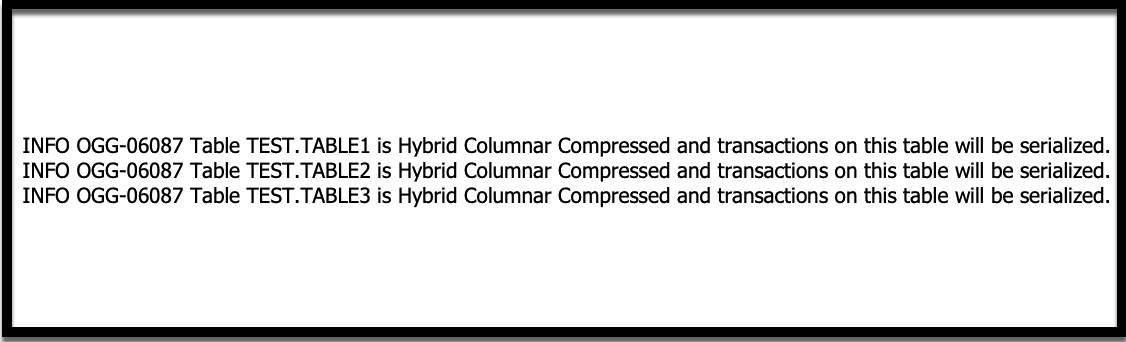
You’ll often observe warning messages in Replicat report file indicating serialization due to EHCC locking behavior.
Recommended Fixes
To avoid performance degradation and maintain parallel apply efficiency, you can:
Isolate EHCC Tables into a Separate Replicat Group
- By moving EHCC tables into their own dedicated Replicat, you ensure that any locking-related serialization does not impact the rest of your schema.
- It allows non-EHCC tables to continue benefiting from full parallelism, preserving throughput for the majority of the workload.
Set Hidden Parameter: _pr_serialize_ehcc = false—->(this parameter should be used only under guidance from Oracle support)
-
This disables the special EHCC-aware serialization logic in Replicat, allowing parallel apply even on EHCC tables.
-
Use with caution: Since EHCC locking is coarse-grained, this may increase the risk of deadlocks between applier threads. If a deadlock does occur, it will roll back the affected transaction and retry, potentially creating additional overhead or instability.
This parameter should only be used after careful testing and if you’re confident that the EHCC tables do not often cause contention under parallel apply.
If you’re running into EHCC-related apply lag and want to confirm the root cause, look for keywords like “Serialized apply” in the Replicat report file. These indicators can help pinpoint whether EHCC behavior is interfering with parallelism.
Other Reasons for Serialization
Certain advanced features can also trigger serialization in Parallel Replicat. For example, using SQLEXEC to execute custom SQL logic or enabling sequence cache replication, tables with non-scaler data types (BLOB) with deduplication enabled, tables with bitmap indexes, would force Replicat to serialize transactions to maintain order and consistency. Use these features judiciously in performance-sensitive environments.
DDL replication: Another Barrier to Parallelism
While most tuning efforts focus on DML workload, it’s important not to overlook the impact of DDL (Data Definition Language) statements on Parallel Replicat performance. Frequent or uncoordinated DDL changes, such as CREATE, ALTER, DROP operations, triggers serialization within the apply engine.
Why DDL Forces Serialization
By design, any DDL encountered in the trail file is treated by Parallel Replicat as a barrier transaction. This is a protective mechanism to ensure schema consistency and maintain a clear transactional boundary around structural changes.
Here’s what happens when a DDL statement is encountered in the trail:
- All preceding transactions must be fully applied first.
- The DDL operation is then executed serially by a dedicated applier thread.
- Only after the DDL is executed, does Replicat resume reading and scheduling subsequent transactions.
This ensures that DDL changes do not interfere with the integrity or correctness of in-flight DML operations. But it also temporarily halts parallel apply, which can introduce noticeable lag if DDLs are frequent or large in scope.
How to Manage DDL-Related Serialization
- Minimize unnecessary DDL operations in replicated environments, especially during peak apply periods or bulk loads.
- Consider batching or scheduling DDL changes during maintenance windows to prevent interference with high-throughput workloads.
- If your use case does not require schema replication, you may choose to exclude DDL from replication using GoldenGate parameter options like “DDL exclude”.
Dependency—The Hidden Bottleneck
Not all performance issues stem from hardware or configuration limitations. Sometimes, the true constraint lies within the structure and interrelationships of the data itself.
In Oracle GoldenGate’s Parallel Replicat, the ability to apply multiple transactions concurrently hinges on the assumption that those transactions are independent. But when referential integrity constraints like foreign keys exist between tables, GoldenGate must respect transaction order and dependencies to maintain data consistency. This can sometimes limit parallelism, even if the infrastructure is otherwise optimal.
Workload Type Determines Parallelism Potential
- Insert-heavy workloads (e.g., in staging tables or ETL pipelines) typically have minimal inter-row or inter-table dependencies, allowing GoldenGate to unleash its full parallel apply capabilities.
- Mixed DML workloads, especially those involving updates and deletes across tables with foreign key constraints creates dependency chains. These chains force many transactions to wait on one another, stalling parallelism and reducing throughput.
How to Detect Dependency Bottlenecks
Use the following commands during runtime to diagnose skew:
- SEND REPLICAT <name>, DEPENDENCYINFO
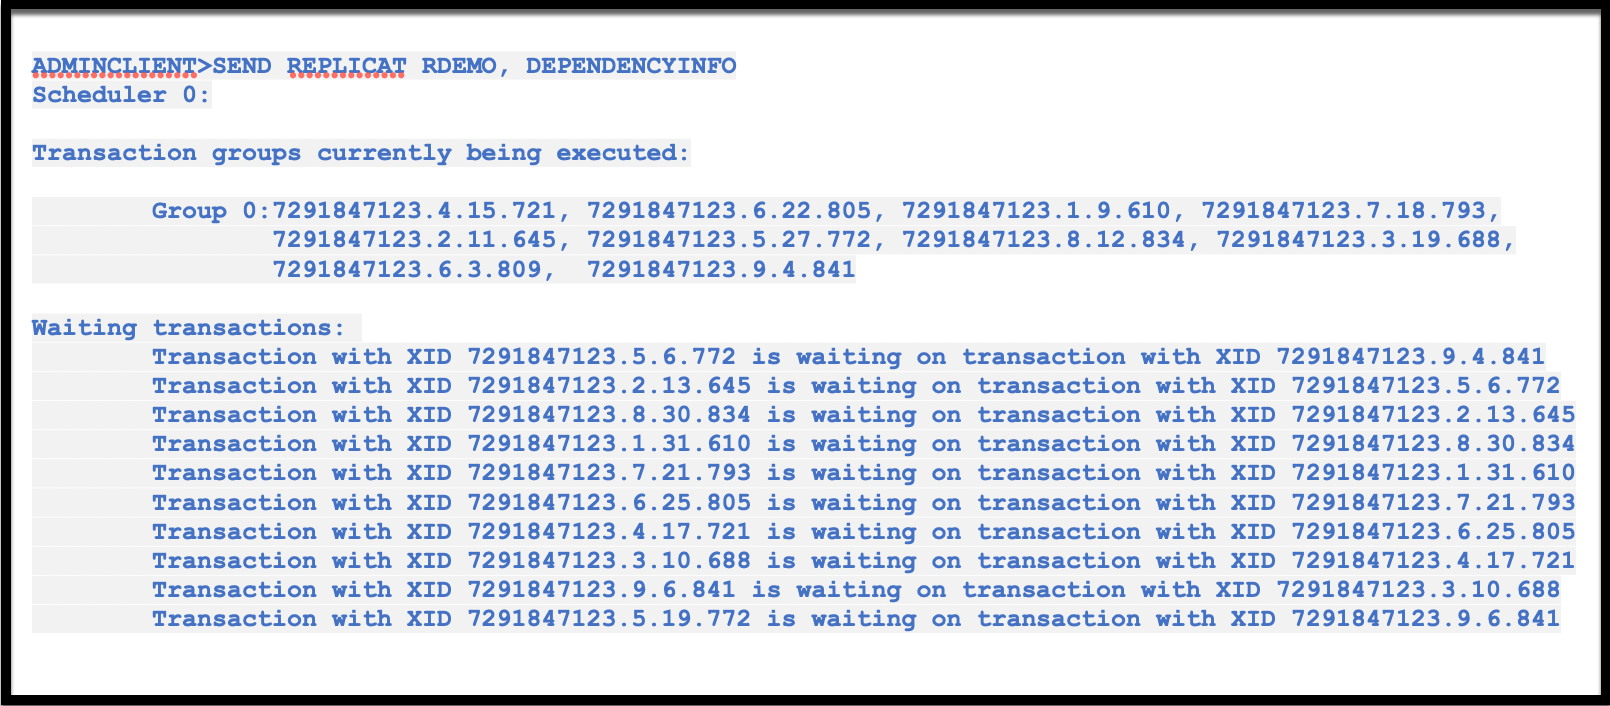
Reveals internal apply queues and the number of transactions waiting behind dependency fences.
- STATS REPLICAT <name>

Shows whether a small number of long-running transactions are blocking a large number of others, indicating dependency skew.
If you notice a high number of dependent transactions queueing up behind a few others, that’s a clear sign that data dependency, not infrastructure is throttling performance.
Fixes and Workarounds
- Disable Foreign Key Constraints during bulk loads or migrations, if your application logic can tolerate eventual consistency. This removes GoldenGate’s need to honor strict parent-child ordering and can significantly boost throughput.
- Consider isolating dependent workloads into a separate Replicat with reduced parallelism to minimize cross-transaction dependencies.
- Use BATCHSQL parameter to group DMLs for optimal performance
Network Latency
While CPU, I/O, and memory often dominate performance discussions, network latency can silently undermine the efficiency of Parallel Replicat, especially in high-throughput environments. Parallel Replicat relies on fast, low-latency communication between the applier (client-side) and the target database (server-side). Even small delays in round-trip communication can cascade into major bottlenecks when thousands of SQL statements are being applied per second.
Why Latency Matters for Replicat
Each SQL statement applied by Replicat involves a client-server exchange over SQL*Net. When the network introduces delay in this interaction, even as little as 5–10 milliseconds. it adds up rapidly across thousands of transactions. As a result, you’ll start to see waits like “SQL*Net more data from client”.
This indicates that the database server is waiting on the client (Replicat) to deliver more data. In most cases, it’s not that Replicat is slow, it’s that the network is too slow for the volume of traffic.
The ideal network round-trip latency for a high-performing GoldenGate deployment is:
- < 5 milliseconds, for optimal performance
- Never exceeding 10 milliseconds. Beyond this, throughput degradation becomes noticeable
This is particularly critical when the GoldenGate hub is deployed remotely from the target DB (e.g., across regions or cloud availability zones)
Fixes and Mitigations
Co-locate the GoldenGate hub and target database. The most effective fix is often architectural: move the GoldenGate applier processes closer to the target DB, ideally within the same data center or cloud availability zone. This minimizes round-trip time and network-induced wait events.
“Even the fastest database and most finely tuned Replicat won’t help if the network layer adds micro-delays to every SQL interaction. Network proximity isn’t optional, it’s foundational.”
Don’t Forget the Storage and Mappers
While most performance tuning efforts tend to focus on the apply side or database wait events, one often overlooked but critical part of the Parallel Replicat pipeline is the trail file reading and mapping layer specifically, the mappers. This component sits at the front of the pipeline and is responsible for reading and parsing trail files, performing initial transformation and routing, and feeding the applier threads.
If the storage backing the trail files or the mappers themselves become a bottleneck, your entire replication pipeline can slow down, even if the apply side and database are perfectly healthy.
When Storage Is the Bottleneck
The mapper threads rely on fast, consistent access to trail files. These files are read sequentially but may still experience delays if the underlying storage layer has high latency and/or low IOPS.
Why it matters:
- If storage is slow, mappers are unable to read trail data quickly enough.
- This creates gaps in the processing pipeline, effectively starving the applier threads of incoming data.
- The end result is lag, not due to the database or DML complexity, but simply because trail data isn’t being delivered fast enough to keep the pipeline full.
How to fix:
- Ensure that trail files are placed on high performance, low-latency storage, such as NVMe SSDs or fast SAN volumes.
- Periodically monitor read latency and I/O throughput on the filesystem or mount point where trail files reside. If read latency is high, applier throughput will suffer regardless of tuning elsewhere.
When Mappers Are CPU-Bound
Mappers themselves can become CPU bottlenecked, especially under high volume workloads. But please note, this only happens when the storage is optimal.
Symptoms of mapper CPU bottlenecks
CPU usage spikes for mapper threads while apply threads remain idle or underutilized.
How to fix:
- Increase the number of mapper threads using the MAP_PARALLELISM parameter. This enables more parallel processing of trail file records and better CPU utilization.
- Scale mappers cautiously. Too many mapper threads can saturate the input pipe.
Performance tuning is always a balance. The key is understanding the relationships between storage, CPU, and workload volume and tuning accordingly.
Putting It All Together: A Step-by-Step Tuning Workflow
Once you’ve encountered apply lag or throughput degradation in your Parallel Replicat setup, it’s easy to get lost in a sea of metrics and logs. To avoid that, it’s crucial to follow a systematic, layered approach that moves from the most visible symptoms down to the root causes.
Here’s a recap of the complete tuning journey you should follow:
Start with the AWR Report:
Begin with an AWR report that covers the lag window. This helps you determine if the problem lies within the database or outside it.
- High DB Time per second? Focus on non-idle wait events (like I/O waits, row-level locking, or buffer busy waits) or CPU usage associated with Replicat SQL.
- Low DB Time per second? The database is likely not the bottleneck. In that case, shift your attention to outside components, such as Replicat serialization, trail reading, or infrastructure issues like storage and CPU saturation.
This distinction is your first major fork in the troubleshooting path.
Scan the Parallel Replicat Report File
Once the database is ruled out, your next best source of insight is the Replicat report file. This file gives you the inside story of what’s happening inside the apply engine.
- Look for serialization messages that explain when and why parallelism was suspended.
- Common causes include:
-
Large transactions that exceed CHUNK_SIZE
-
EHCC-compressed tables causing unit-level locks
-
Too many DDL changes that needs to be replicated
-
Use of SQLEXEC
-
Sequence cache replication
-
By understanding these clues, you get direct insight into why Replicat is not scaling, even when hardware and the database seem healthy.
If your apply process is still lagging despite no clear signs of database or serialization issues, the problem may lie at the head of the pipeline: trail file reading and mapping.
- Slow storage means trail files are read too slowly, causing mapper starvation and pipeline underfeeding. Ensure trail files are on fast, low-latency storage such as SSD/NVMe with minimal I/O contention.
- Mapper threads CPU-bound? Mappers might be the chokepoint. Consider increasing the number of mapper threads, but do so cautiously to avoid saturating the input pipe. Mapper scaling must be in balance with downstream apply capacity.
The goal is to ensure a steady, balanced pipeline from trail read to final apply, without introducing new bottlenecks upstream.
Use GoldenGate Diagnostic Commands
When the cause isn’t obvious from logs or metrics, it’s time to dig deeper using GoldenGate’s built-in diagnostic commands. Use the “send replicat <replicat name>, DEPENDENCYINFO” or “stats replicat <replicat name>” commands to uncover inter-transaction dependencies that are forcing serialization
These tools give you real-time visibility into how the Replicat engine is behaving internally, helping you fine-tune based on workload patterns and bottlenecked threads.
Don’t Just Tune. Diagnose Smartly
Performance tuning in Parallel Replicat is not about guesswork or trial and error. It’s about methodical diagnosis and data-driven decision making. Each layer, from the database to Replicat internals to infrastructure, plays a role. The more precisely you understand the interaction between components, the better equipped you’ll be to restore throughput, reduce lag, and achieve long-term replication stability.
Final Thoughts: Tune Like a Detective, Not a Gambler
Parallel Replicat is a remarkably capable and high-performance apply engine, but only when it’s given the right conditions to thrive. As with any powerful system, getting the best out of it demands a mindset of structured investigation, not reactive guessing.
Performance tuning isn’t about tweaking random knobs and hoping for improvement. It’s about becoming a system detective, someone who:
- Collects evidence before making changes
- Looks at the full pipeline, from trail file to database
- Understands not just what is happening, but why it’s happening
Key Principles to Guide You
- Be relentlessly data-driven. Use metrics, wait events, AWR reports, GoldenGate stats, report files to back every observation. If you’re not measuring it, you’re guessing.
- Understand the system end-to-end. Don’t just look at the Replicat process in isolation. Zoom out. The issue might be upstream (e.g., Extract or network), downstream (e.g., target DB), or structural (e.g., workload dependency).
- Apply changes with clear intent. Every config change, parameter tweak, or architectural shift should have a specific goal and be validated through follow-up metrics. Guesswork leads to side effects, intentional tuning leads to stability.
By adopting a disciplined and methodical approach, you’ll not only resolve bottlenecks faster, you’ll also build a resilient GoldenGate environment that’s easier to maintain and scale over time.
References
https://blogs.oracle.com/dataintegration/post/parallel-replicat-parallelism-and-dependency-calculation
https://blogs.oracle.com/dataintegration/post/parallel-replicat-large-txns