The StatsD integration with Telegraf involves using Telegraf as an aggregator and processor of StatsD metrics before forwarding them to a time-series database such as Autonomous Database, InfluxDB or any other output supported by Telegraf.
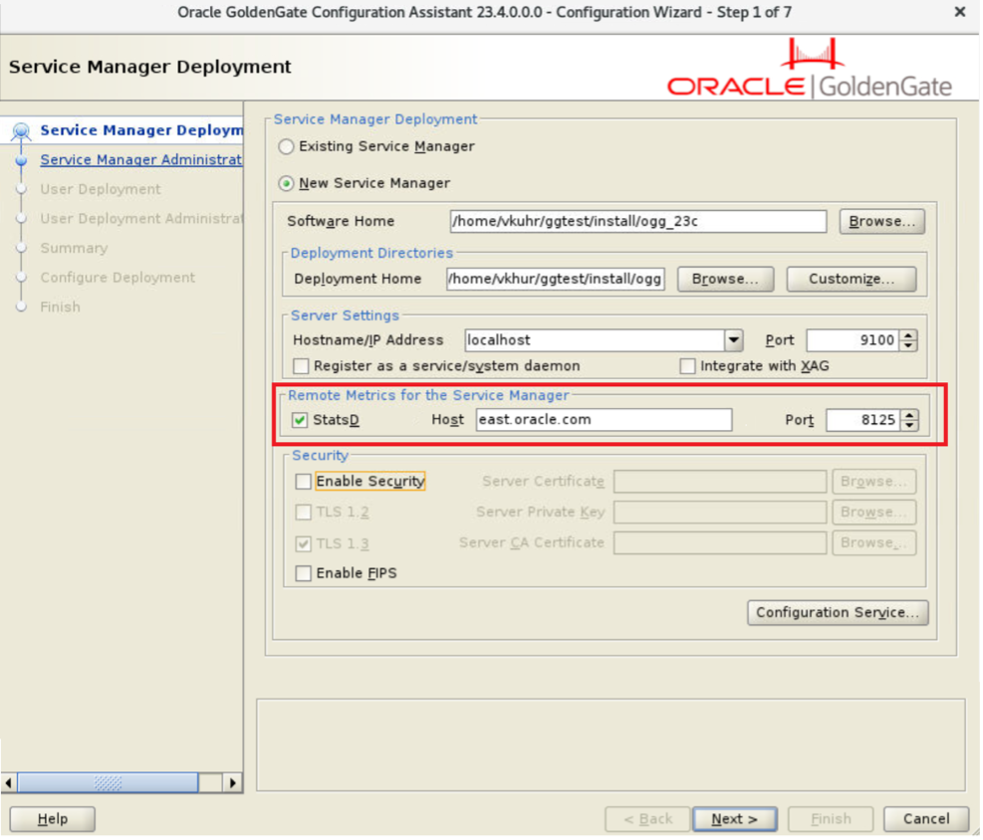
Oracle GoldenGate 23ai now includes StatsD formatted metrics out of the box, with 100+ metrics, which can be activated during deployment installation or later via the API.
OGGCA:
Rest API:
curl -svu username:password \
-X PATCH http://hostname:port/services/v2/deployments/deployment_name \
--data '{
       "metrics":
           {
              "enabled":true,
              "servers":
                   [
                      {
                         "type":"pmsrvr",
                         "protocol":"uds"
                      },
                      {
                         "type":"statsd",
                         "host":"<statsd_host>"
                      }
                   ]
           }
        }'
StatsD is a network daemon that listens for statistics, like counters and timers, sent over UDP or TCP and sends aggregates to one or more pluggable backend services (e.g., Autonomous Database, Graphite, InfluxDB, Prometheus, and TimescaleDB). It was originally developed by Etsy and is designed to improve the performance of tracking events, metrics, or status data points in real-time.
Telegraf on the other hand is a server-based agent developed by InfluxData, designed for collecting, processing, aggregating, and writing metrics from a variety of sources into a time series database. It is an open-source tool that is part of the InfluxData platform. Telegraf supports a plugin-driven architecture which allows it to integrate with a multitude of systems, services, and API data formats.
The GoldenGate 23ai integration of StatsD and Telegraf, means you can configure Telegraf to receive the GoldenGate 23ai metrics sent using the StatsD protocol. GoldenGate 23ai sends metrics over UDP because it’s lightweight and non-blocking to Telegraf which then inserts into a storage location, typically a time series database for permanent storage.
You can then consume the real-time and historical metrics from the time series database to build customized dashboards. This will give you the ability to visualize the metrics from all deployments in a single pane of glass.
Here is a detailed look at how this integration works:
StatsD Protocol Support:
- StatsD is a network daemon that listens for statistics, like counters and timers, sent over UDP and sends them to one or more pluggable backend services (e.g., a time-series database).
- Telegraf has a built-in StatsD server that can receive metrics sent in StatsD format. It acts as a StatsD “listener”.
Configuration:
- In the Telegraf configuration file, you can enable the StatsD input plugin (https://github.com/influxdata/telegraf/blob/master/plugins/inputs/statsd/README.md). This involves specifying the service address, metric collection interval, and other optional parameters such as logging of metrics, setting of tags, or defining additional processing like aggregations.
- Example configuration snippet:
[[inputs.statsd]]
  interval             = "5s"
Metrics Handling:
- Once enabled, Telegraf’s StatsD plugin listens for UDP packets on the specified port. It parses and aggregates the data according to the StatsD protocol (handling counters, gauges, sets, and timers).
- You can configure Telegraf to perform additional processing like adding tags, converting values, or aggregating metrics over time before sending them to the output.
Output:
- After processing, the metrics can be forwarded to various outputs supported by Telegraf, such as InfluxDB, Prometheus, Kafka, and many others. The output is also configured in the Telegraf configuration file.
- This makes the output from Telegraf very flexible, hence allowing the GoldenGate customers to build a highly customizable solution to monitoring.
Benefits:
- Using Telegraf with StatsD allows you to leverage Telegraf’s rich set of plugins (https://docs.influxdata.com/telegraf/v1/plugins/) for further data processing and enhancement before storage. It also simplifies the architecture by reducing the need for a separate StatsD server.
Below are the steps I used to create a test environment for the StatsD/Telegraf integration.
To make it simpler I built with a series of containers. I created one container for each service, but you can install Telegraf on GoldenGate host or somewhere else. In this case I created a dedicated host for Telegraf and GoldenGate pushes the metrics to that host.
Note: The metrics push for the databases are for illustration only and is not part of the demonstration.
1- Clone the GoldenGate scripts from GitHub and create a GoldenGate 23ai container image.
$cd to directory copied from GitHub
export ogg_release="XXXXXX"
docker build --tag=alexlima/goldengate234:${ogg_release}  --tag=alexlima/goldengate234:latest \
--build-arg INSTALLER=fbo_ggs_Linux_x64_Oracle_services_shiphome.zip .  2>&1 | tee build_${ogg_release}.log
2- Download all other images for repeatable deployments:
docker pull alexlima/oracle-free:23.3-slim-ogg

docker pull influxdb:2.7-alpine
docker image tag influxdb:2.7-alpine  alexlima/influxdb:2.7-alpine

docker pull telegraf
docker image tag telegraf:latest alexlima/telegraf:1.30.2

docker pull grafana/grafana
docker image tag grafana/grafana:latest alexlima/grafana:10.4.2
3- Download all files from my GitHub repository to a local directory (e.g: /u99/oggdemo):
4- Change directory to /u99/oggdemo
$cd /u99/oggdemo
$docker compose up -d
$docker compose logs -f
5- Check if all containers are healthy:
alexlima@alexlima-mac ~ % docker ps
CONTAINER ID   IMAGE                                COMMAND                  CREATED        STATUS                  PORTS                                                                     NAMES
ce26134db476   alexlima/grafana:10.4.2              "/run.sh"                26 hours ago   Up 26 hours             0.0.0.0:3000->3000/tcp, :::3000->3000/tcp                                 grafana-server
448b27e21d0c   alexlima/telegraf:1.30.2             "/entrypoint.sh tele…"   26 hours ago   Up 26 hours             8092/udp, 8125/udp, 8094/tcp, 0.0.0.0:8125->8125/tcp, :::8125->8125/tcp   telegraf
d5f50bd685d4   alexlima/oracle-free:23.3-slim-ogg   "/opt/oracle/run.sh"     26 hours ago   Up 26 hours             0.0.0.0:1524->1521/tcp, :::1524->1521/tcp                                 db233demoW
72a7fbc3e09b   alexlima/oracle-free:23.3-slim-ogg   "/opt/oracle/run.sh"     26 hours ago   Up 26 hours             0.0.0.0:1525->1521/tcp, :::1525->1521/tcp                                 db233demoE
d2c7fc3d4547   alexlima/goldengate234:latest        "/usr/local/bin/depl…"   26 hours ago   Up 26 hours (healthy)   22/tcp, 80/tcp, 0.0.0.0:281->443/tcp, :::281->443/tcp                     ogg234demo
0745051c0710   alexlima/influxdb:2.7-alpine         "./entrypoint.sh"        26 hours ago   Up 26 hours             0.0.0.0:8086->8086/tcp, :::8086->8086/tcp                                 influxdb
6- Create Bi-Directional Replication
$./create_replication.sh
7- Enable StatsD
$./enable_statsd.sh
Note: Other Important files to understand are .env which set all the environments variable to build the lab, entrypoint.sh which set up the database and telegraf.conf for telegraf configuration.
8- Login to GoldenGate
https://localhost:1055/

oggadmin / Welcome##123
9- Navigate to Admin Service
You should see two extract and two replicat.
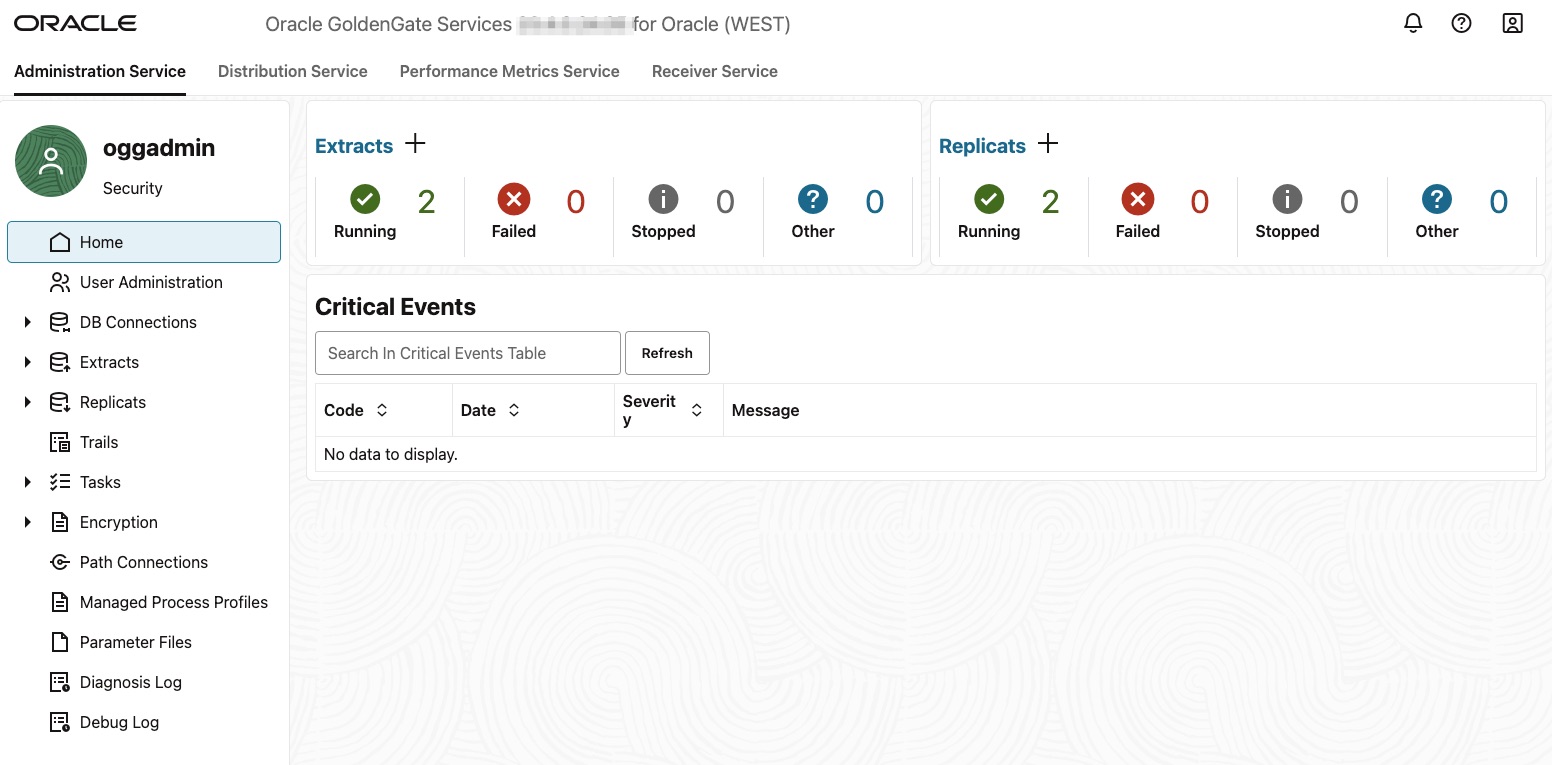
Note: Before proceeding, please stop and re-start all extracts and replicats.
10- Now let’s look in InfluxDB and see if the Metrics from GoldenGate are populating the database.
Login to InfluxDB

http://localhost:8086/

admin / Welcome##123
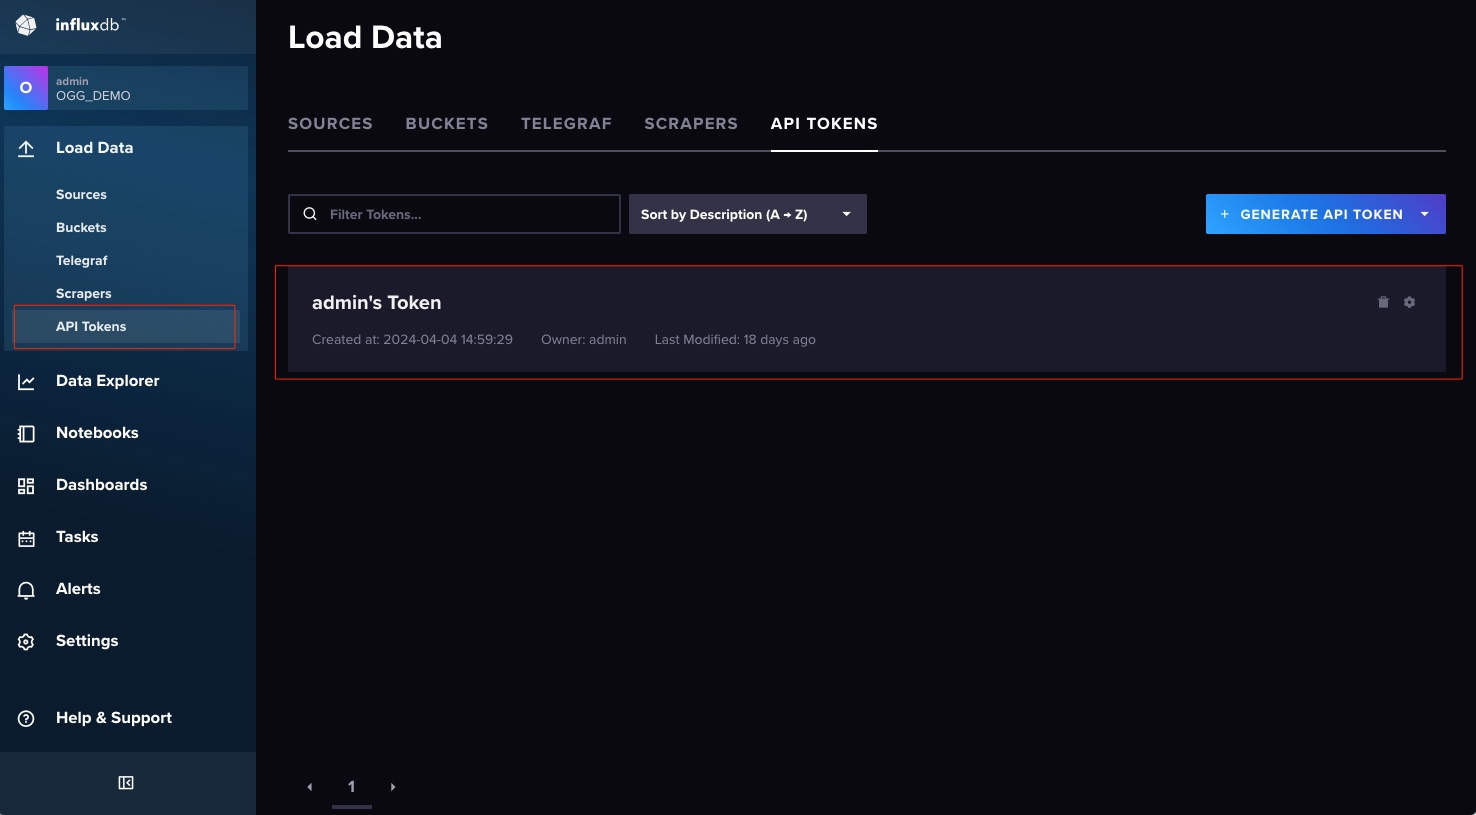
To avoid manual steps at this stage an Admin Token and a Bucket were created during the build of the container. Look into the “DOCKER_INFLUXDB_INIT_ADMIN_TOKEN” variable in the .env file. Keep that handy as you will need it to create connection from Grafana to InfluxDB
Next let’s look if the Bucket got created. Look into the file entrypoint.sh file, that how the bucket was created.
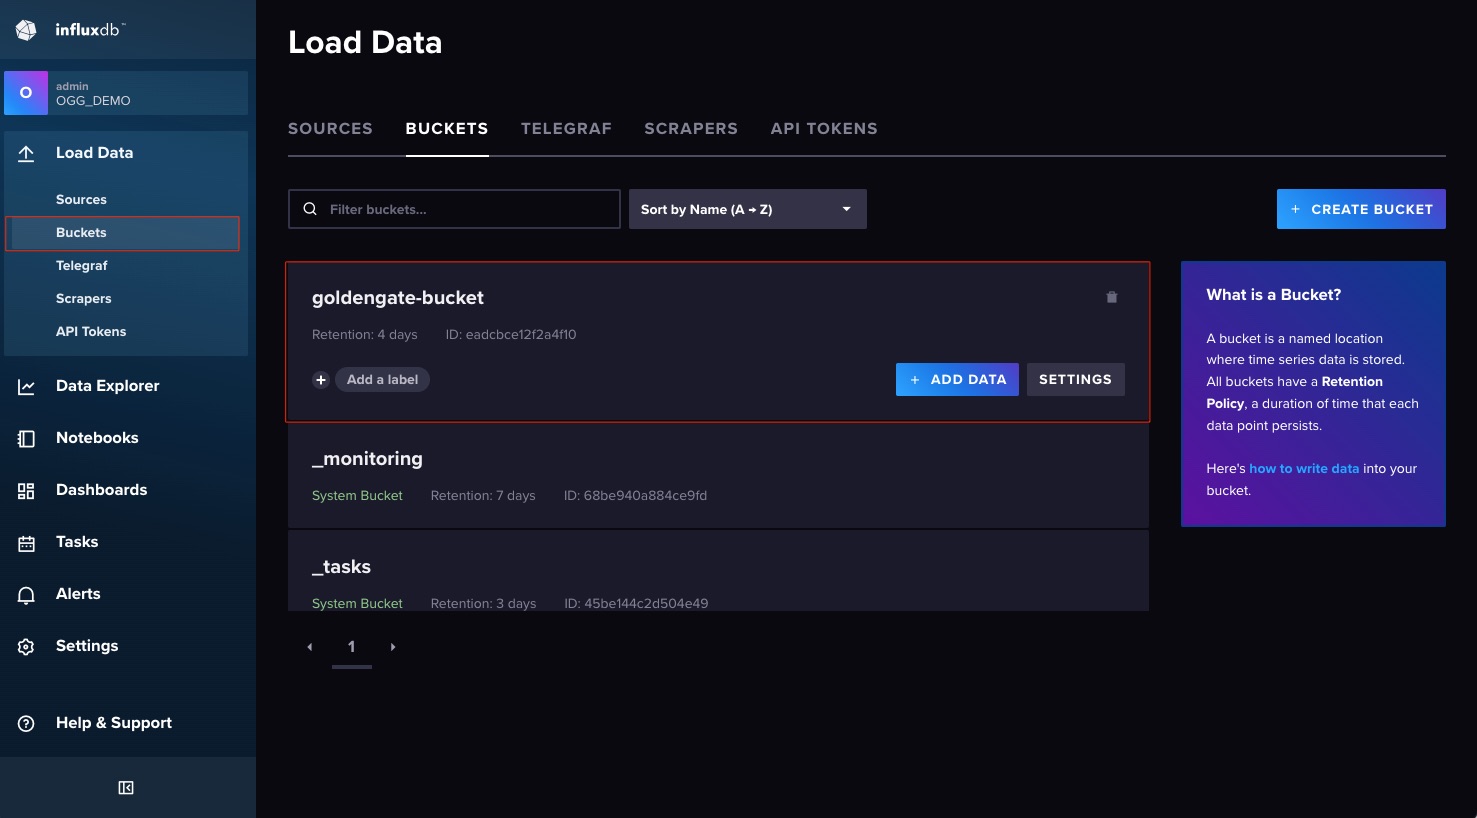
Now that you know the Bucket was successfully created, let’s look and see if the data is populating. Click on Data Explorer.
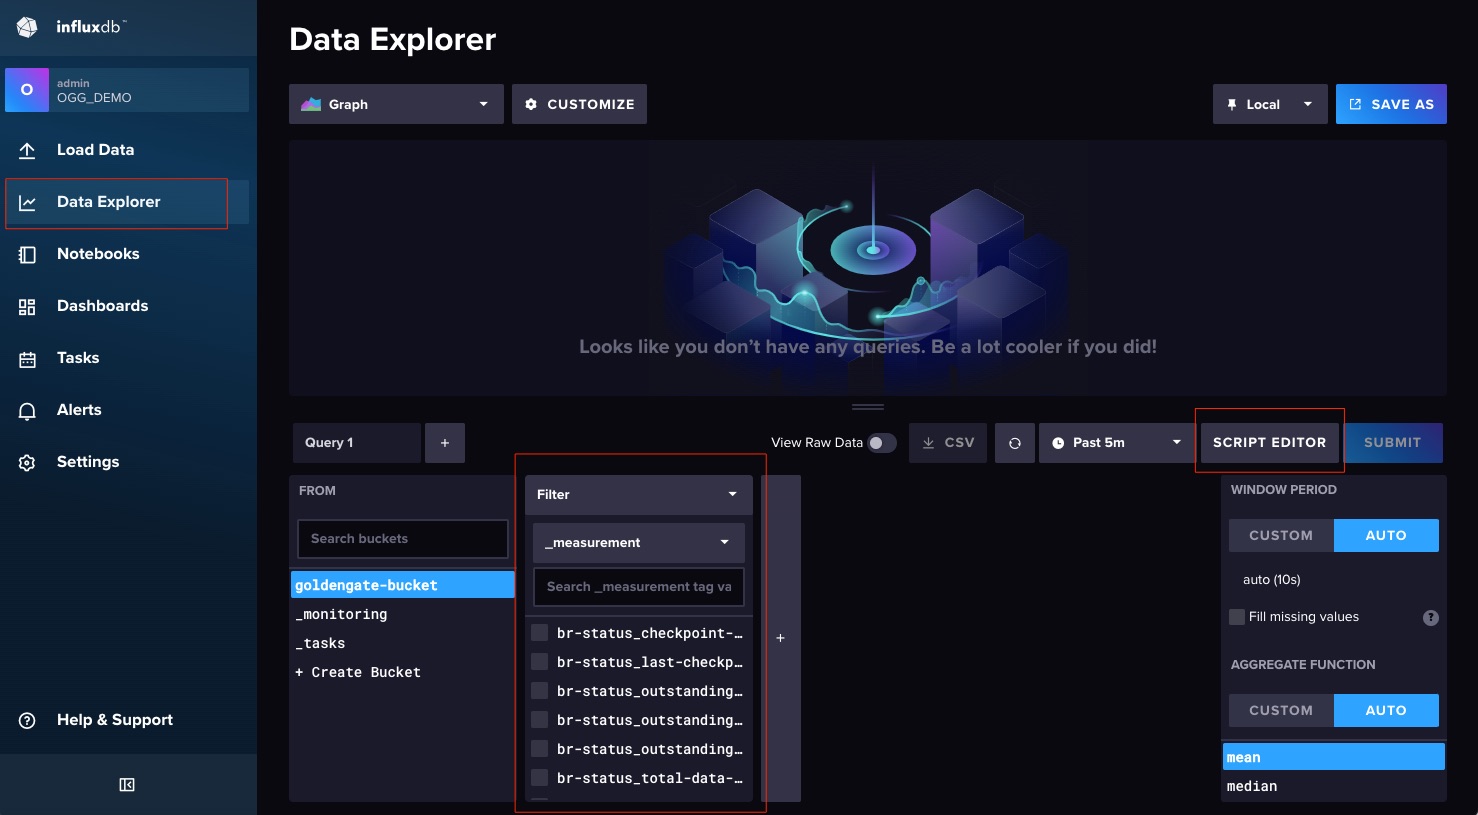
You can now see the metrics populating the Bucket, you can use the Script Editor to start visualizing the data.
At this point, you have GoldenGate pushing metrics to the InfluxDB database, you can now connect your favorite dashboard tools as create your visualizations.
For this example, we will be attaching Grafana.
11- Login to Grafana
https://localhost:3000

admin / Welcome##123
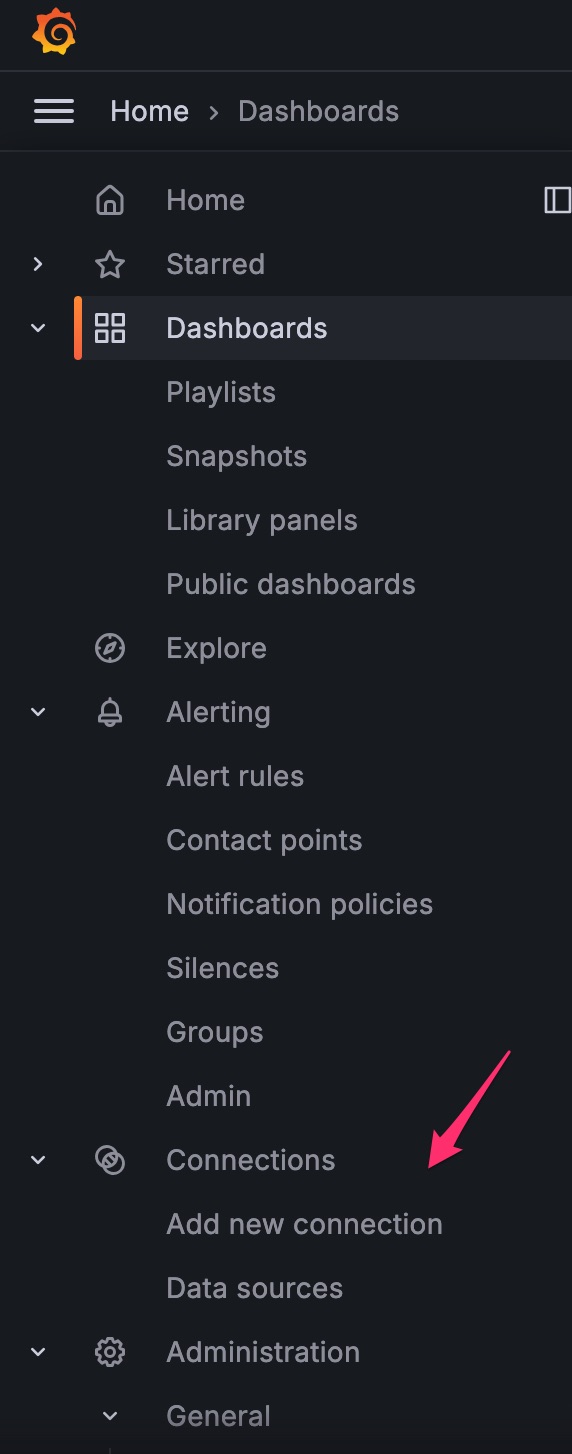
12- Add a connection
From the hamburger menu, select Add New Connection
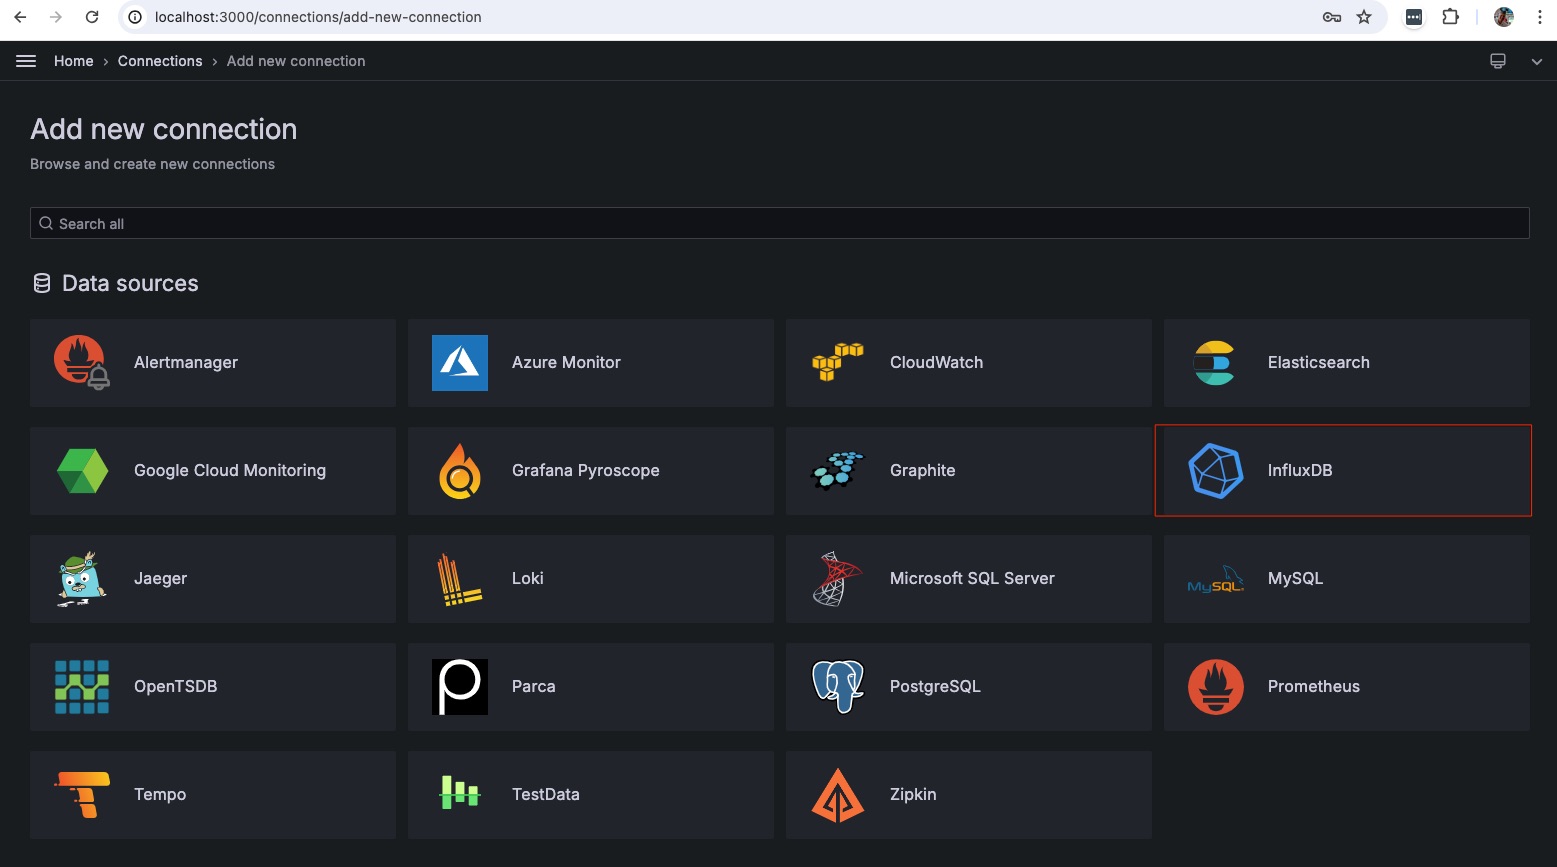
Select InfluxDB
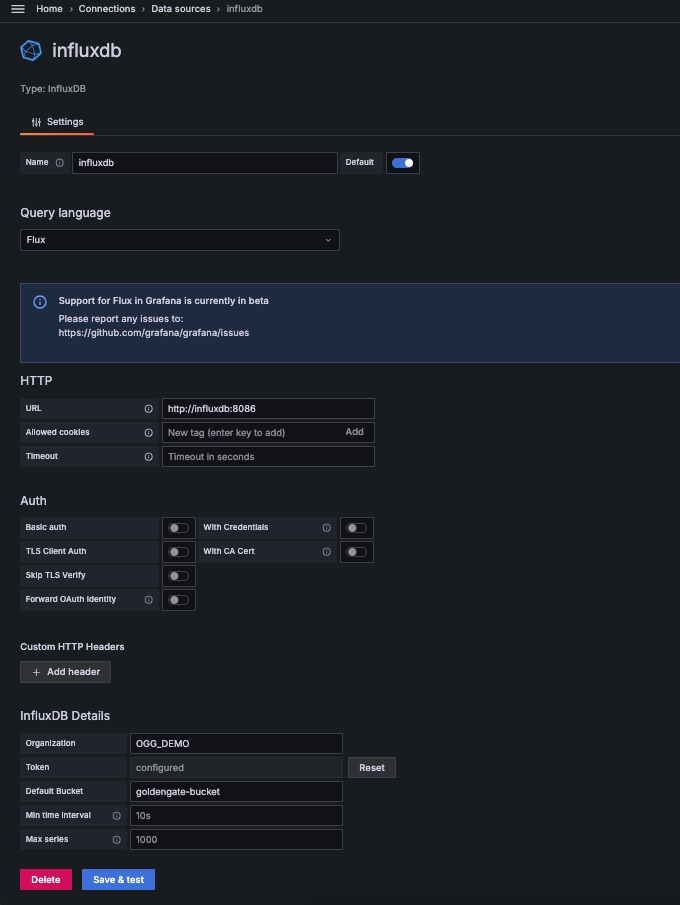
In the connection properties window below add:
Name: influxdb
Select Flux for Query Language
URL: http://influxdb:8086
Organization: OGG_DEMO
Token:  Get from the .env file
Default Bucket:  goldengate-bucket
Save & Test
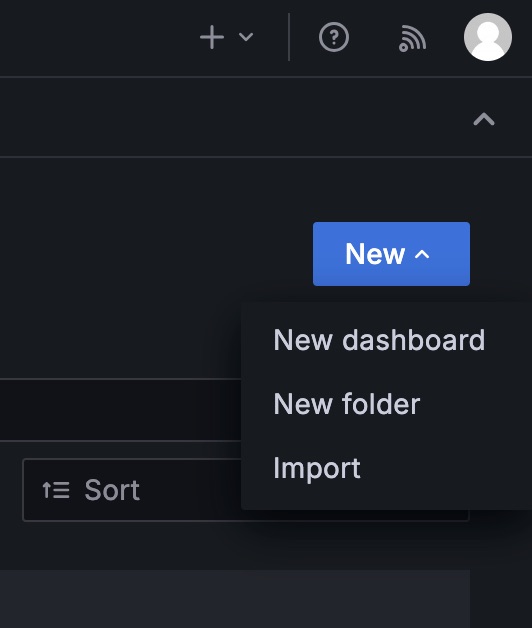
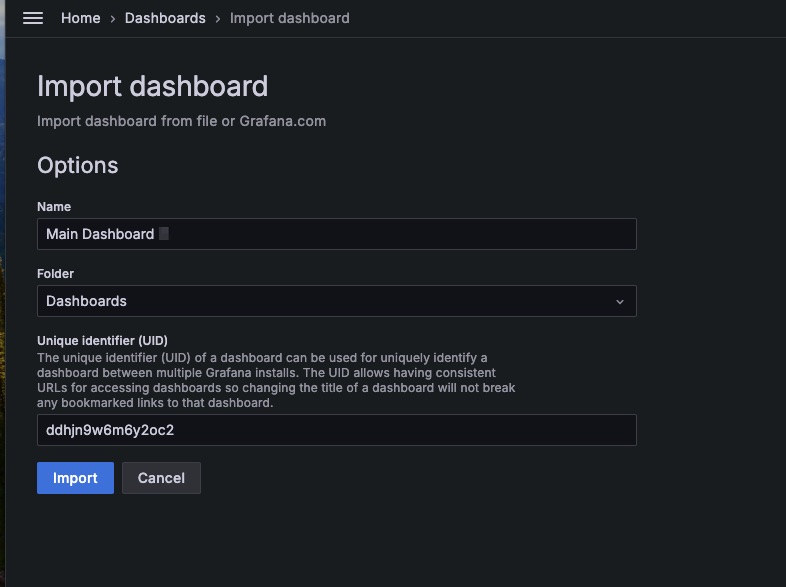
13- Import Dashboard Template
Note that it’s just a template for you to understand the concept, you can modify and create new dashboards as it fits your requirement.
Go to Dashboards and in the top right cornet click “New” and import.
Upload the Main Dashboard-1714512160772.json file and select the database from the dropdown.
Go back to Dashboards and select “Main Dashboard.”
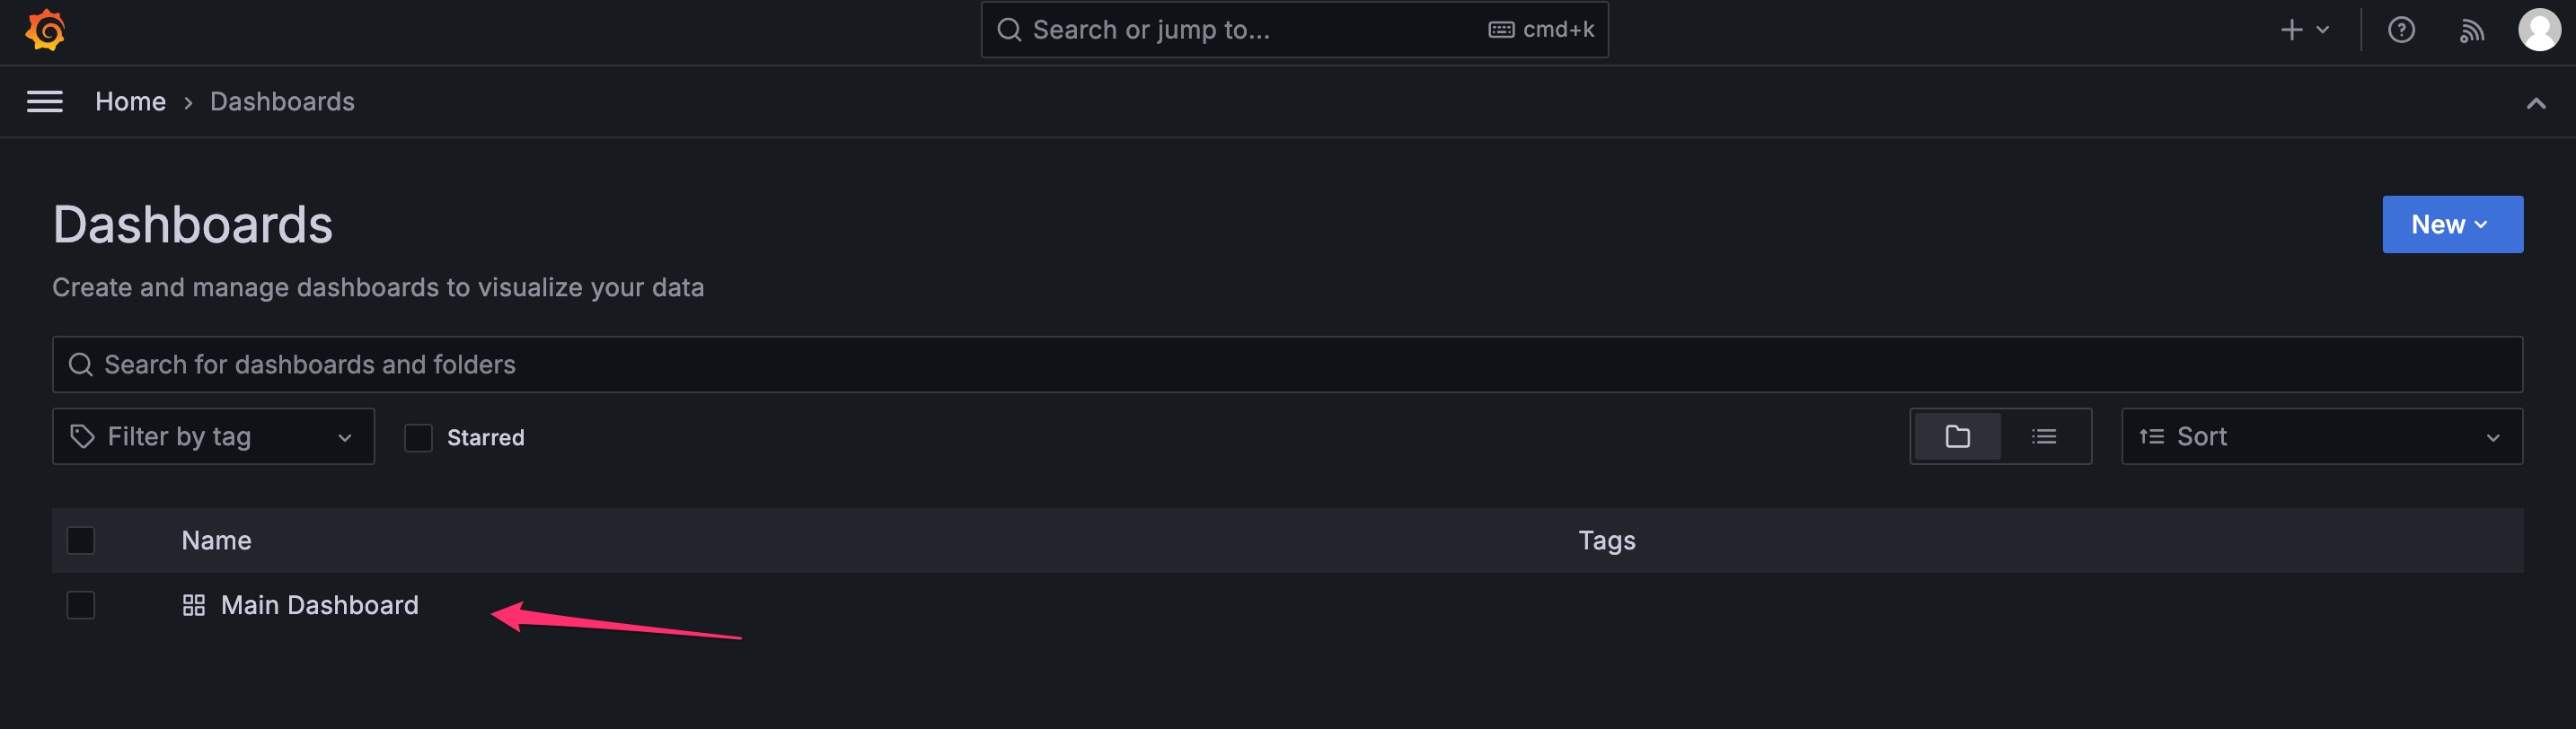
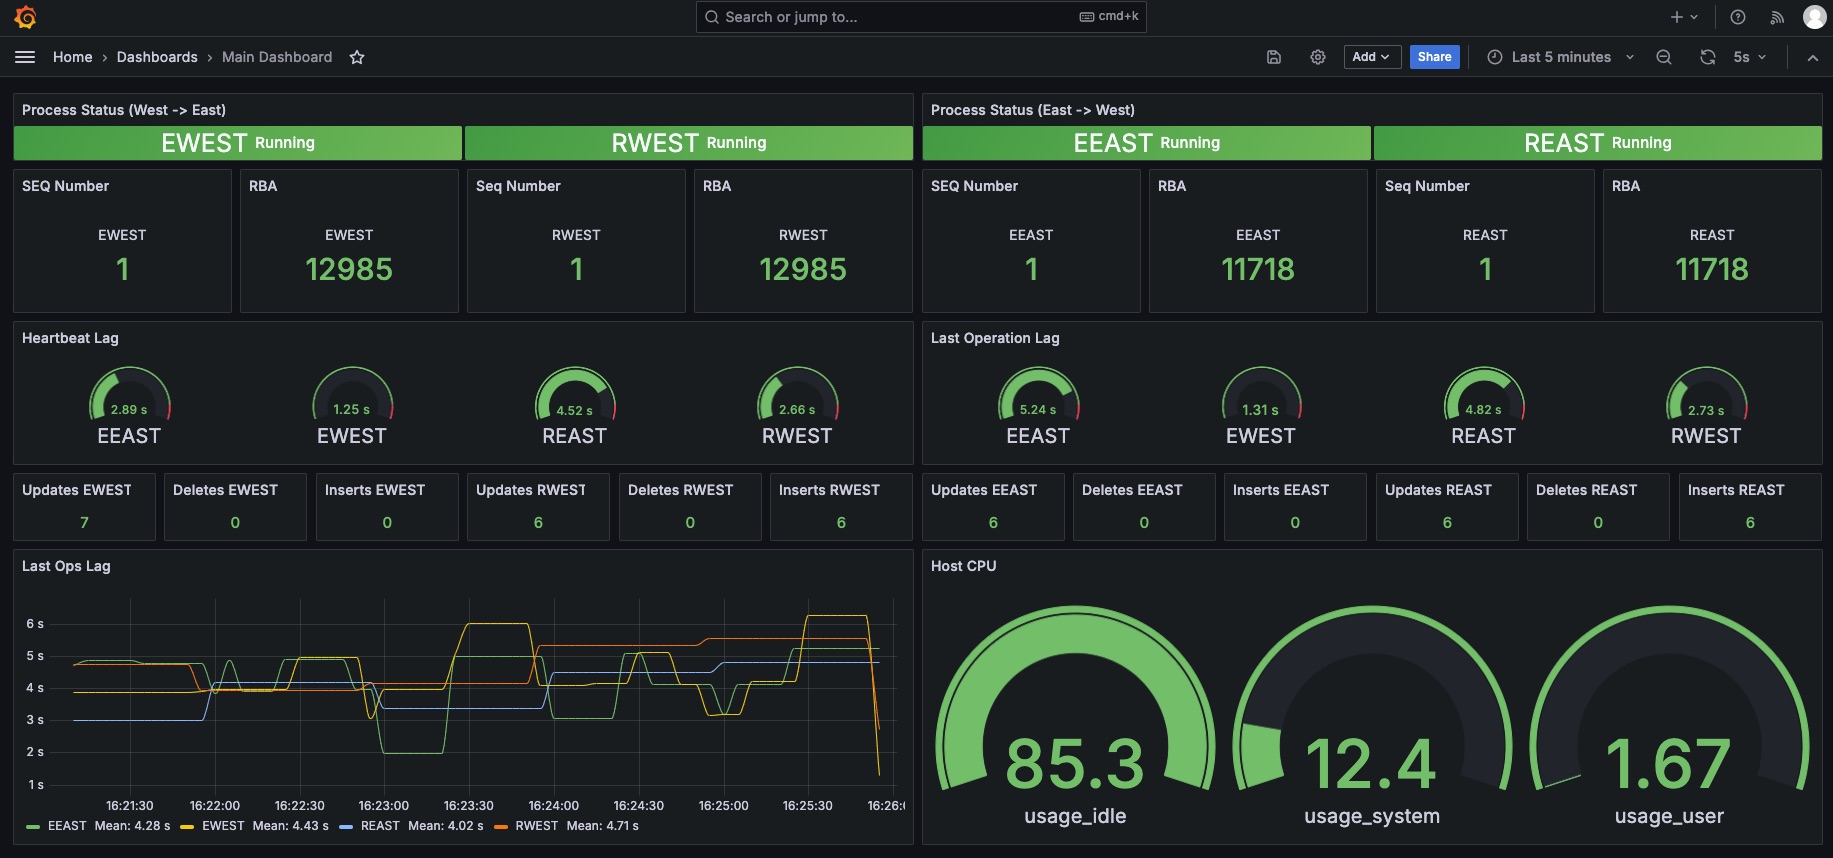
You can now see the Template Dashboard in Grafana.
Additional Information:
Oracle GoldenGate YouTube Channel