![]()
Grafana is an open-source visualization and alerting tool that you can use for analytics and monitoring of time-series data (metrics). While metrics from Oracle Cloud Infrastructure Monitoring are visible in metrics charts through the Console, you can use Oracle Cloud Infrastructure Data Source for Grafana (“the Grafana Plug-in”) to view metrics from resources across providers on a single Grafana dashboard.
Prerequisites for Using the Grafana Plug-in
- An Oracle Cloud Infrastructure account.
- Getting the Tenancy OCID and User OCID
- Getting the Private API Key and Fingerprint
- Configure OCI Identity Policies
- Install Grafana and OCI Logs Data Source for Grafana Plugin.
The above steps are explained in detail along with screenshots in a GitHub link here.
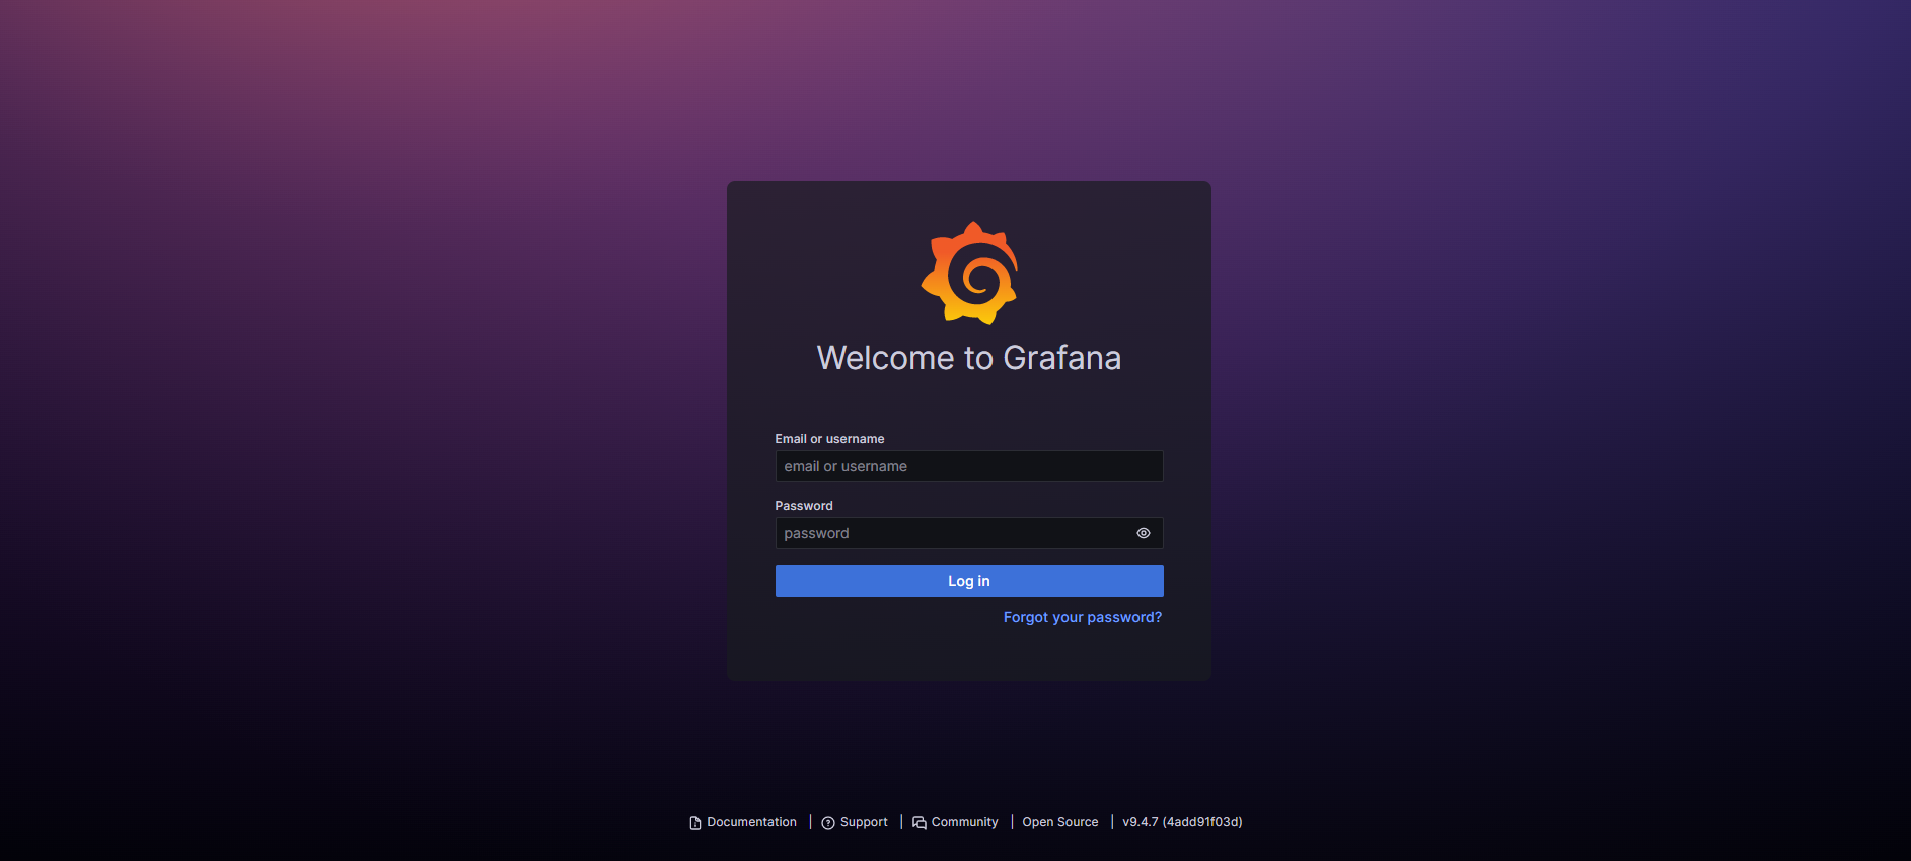
Grafana Homepage Login
The next step is to configure the Plugin to connect to your OCI tenancy. Navigate to Grafana Homepage at http://localhost:3000. The default username & password is admin.
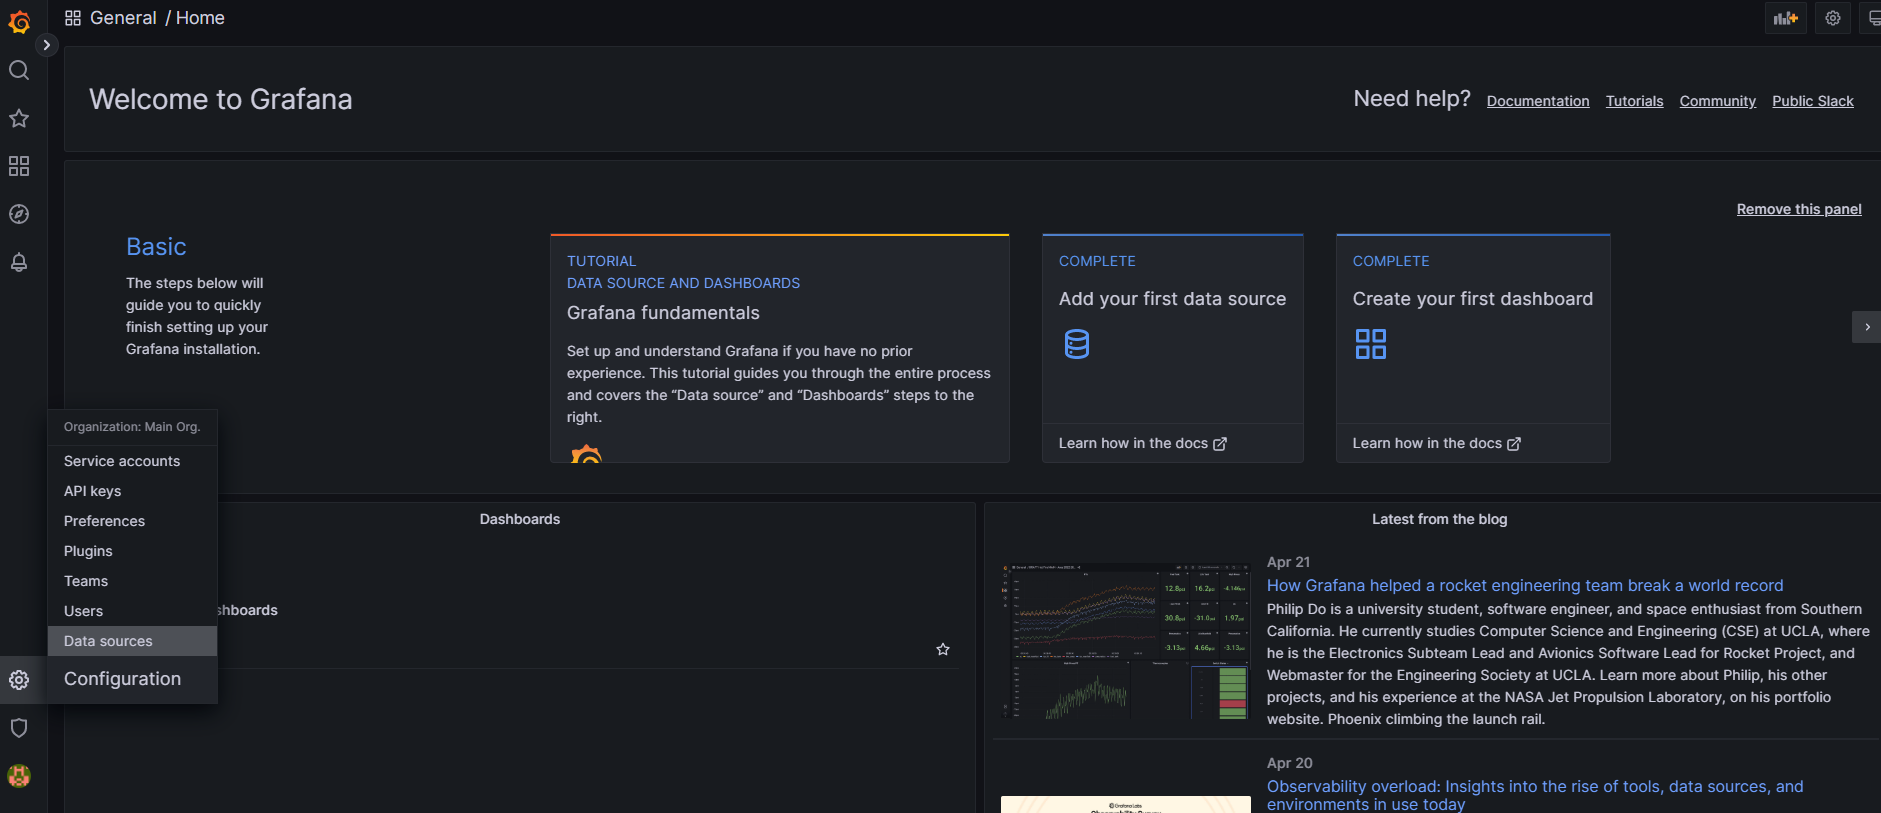
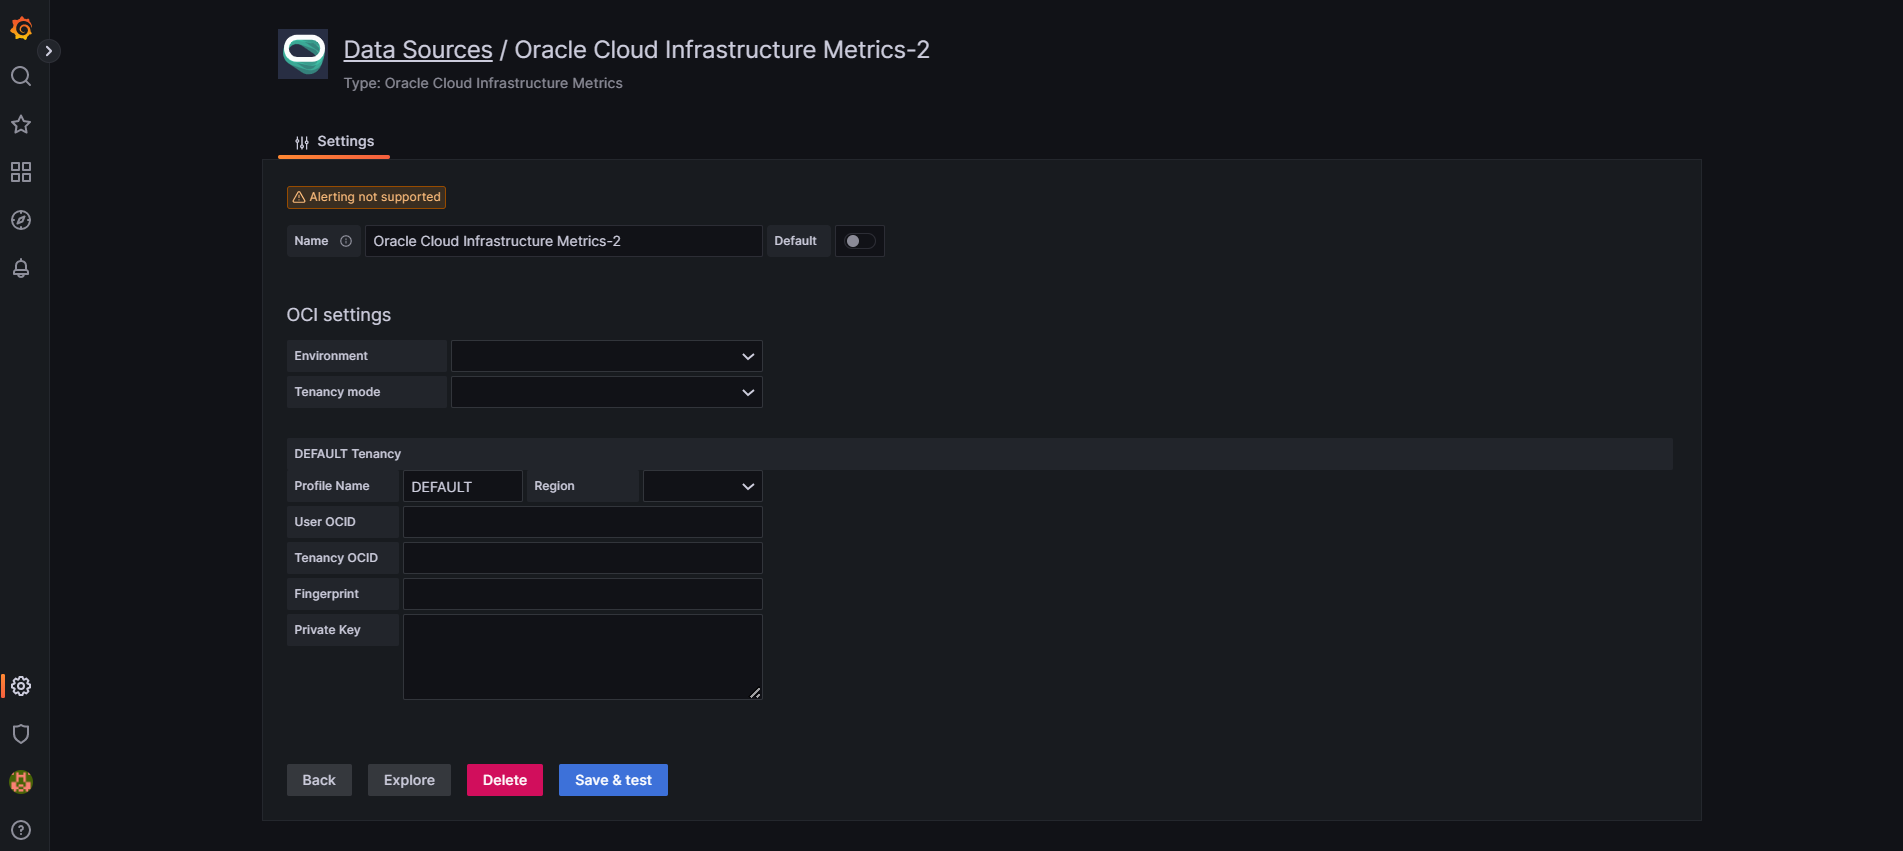
To Add the Grafana Plug-In (Oracle Cloud Infrastructure Data Source for Grafana), click the Setting icon on the left side of the page and then select Data sources.
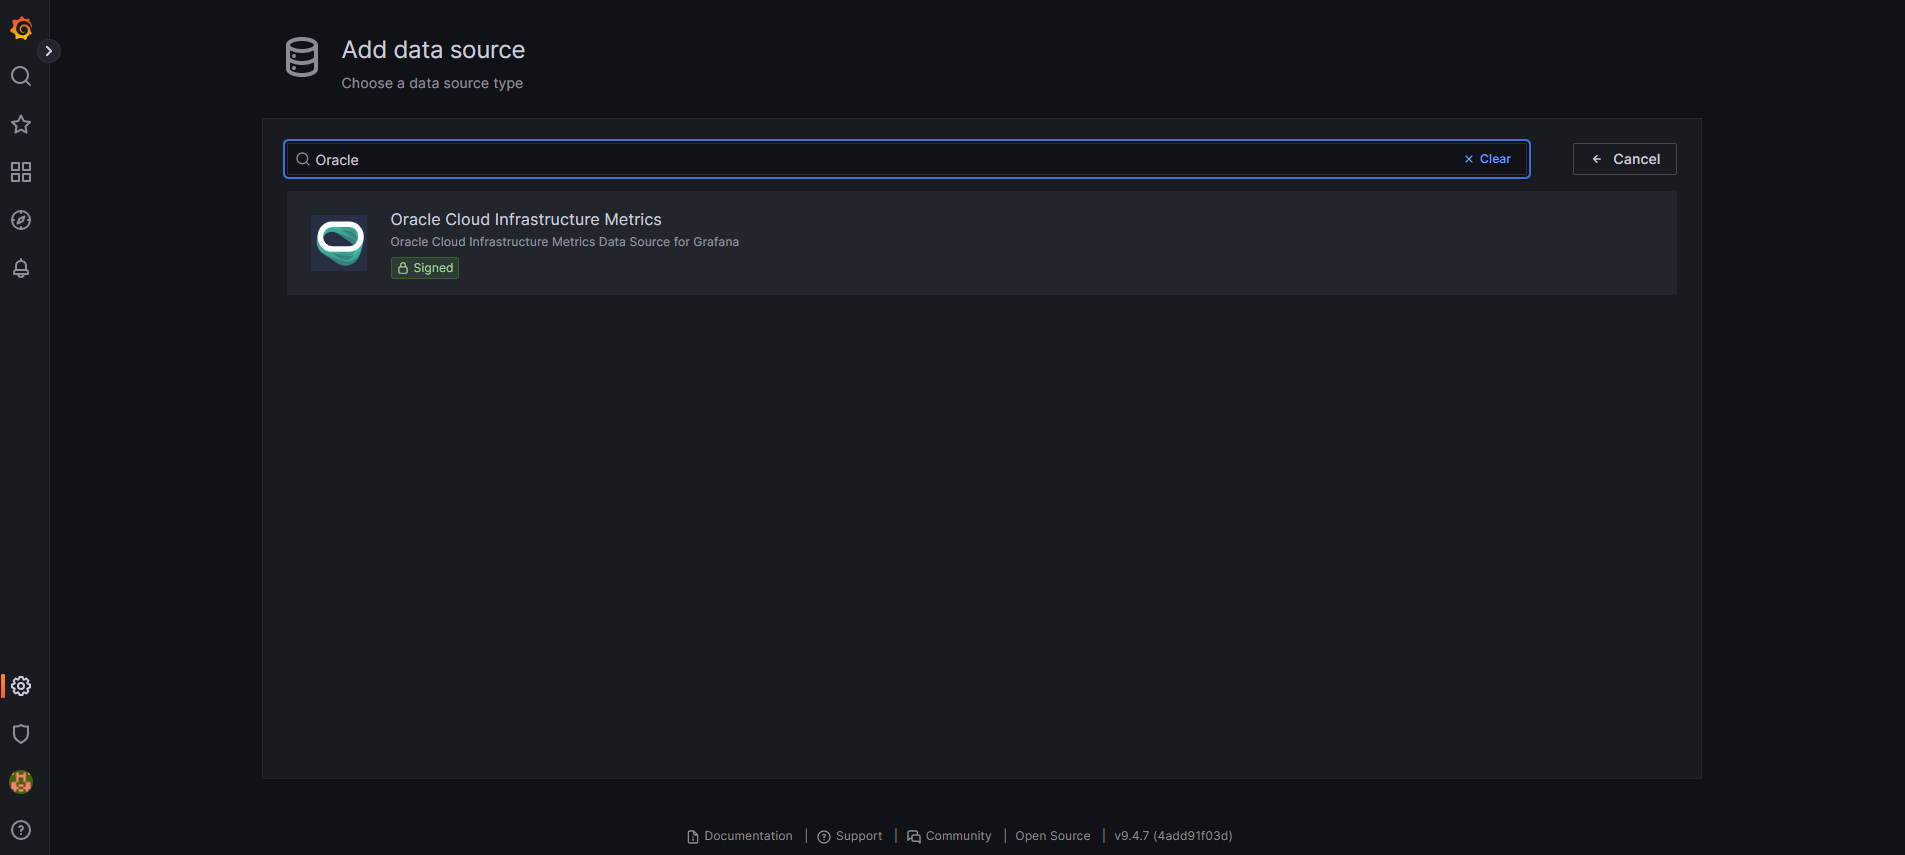
Click Add Data Source. Type Oracle in the Search bar to select “Oracle Cloud Infrastructure Metrics” as data Source type.
On the Settings tab ,Enter the OCI Tenancy details that was collected as part of the prerequisites.Click Save & test to verify the connection.
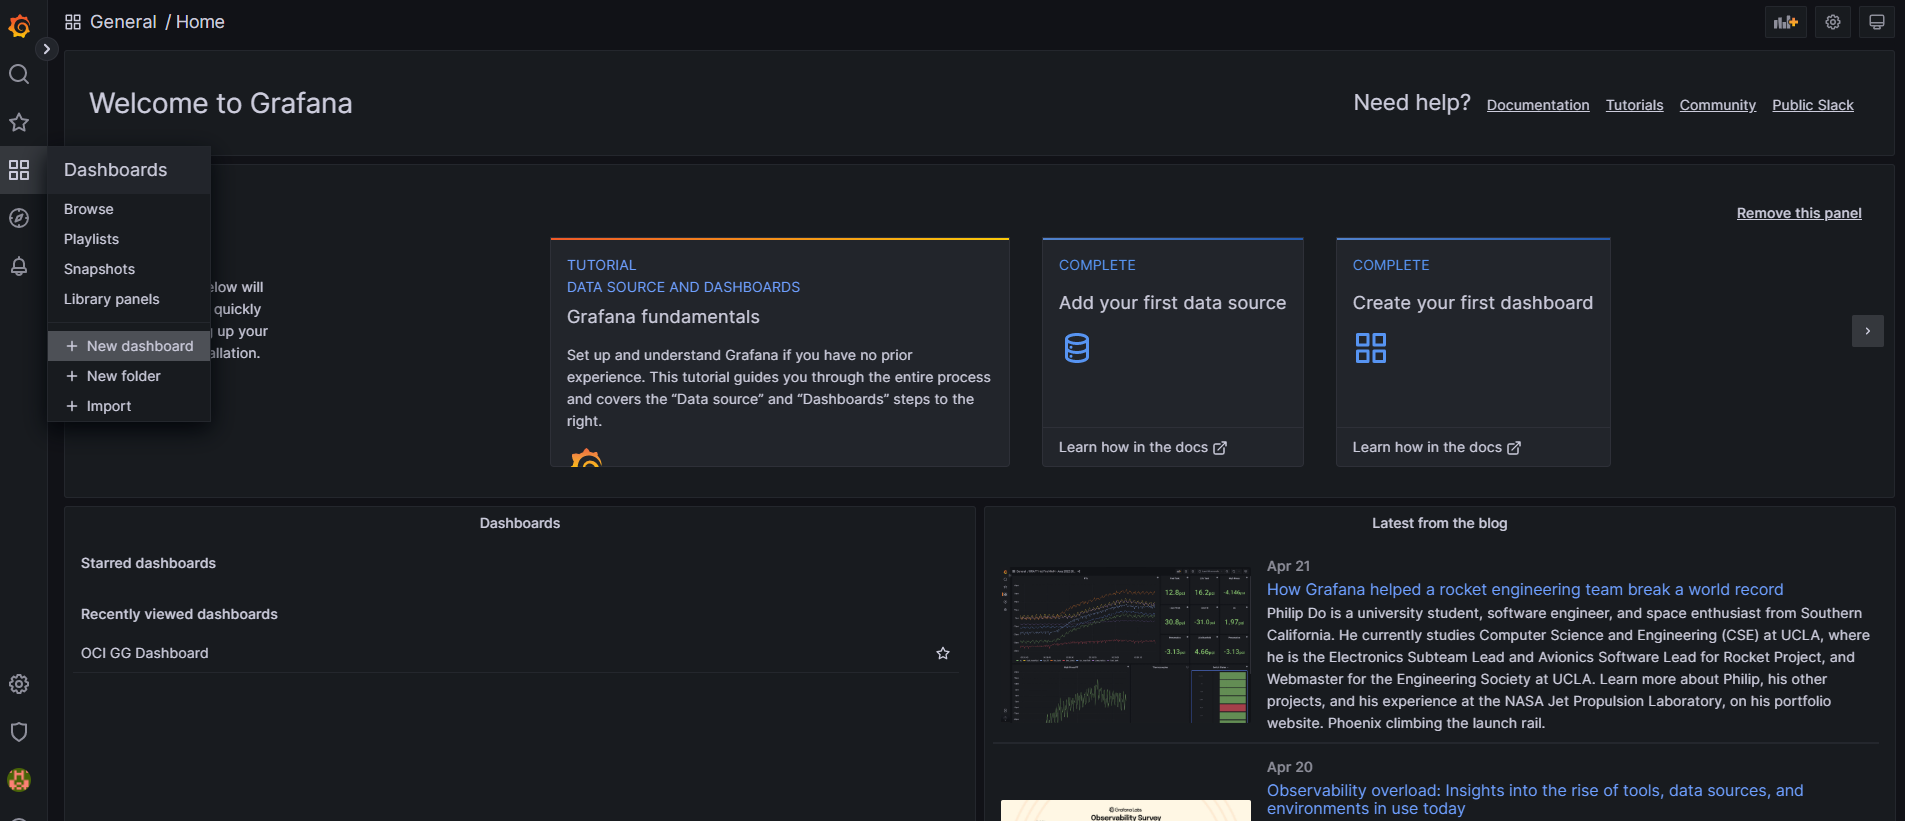
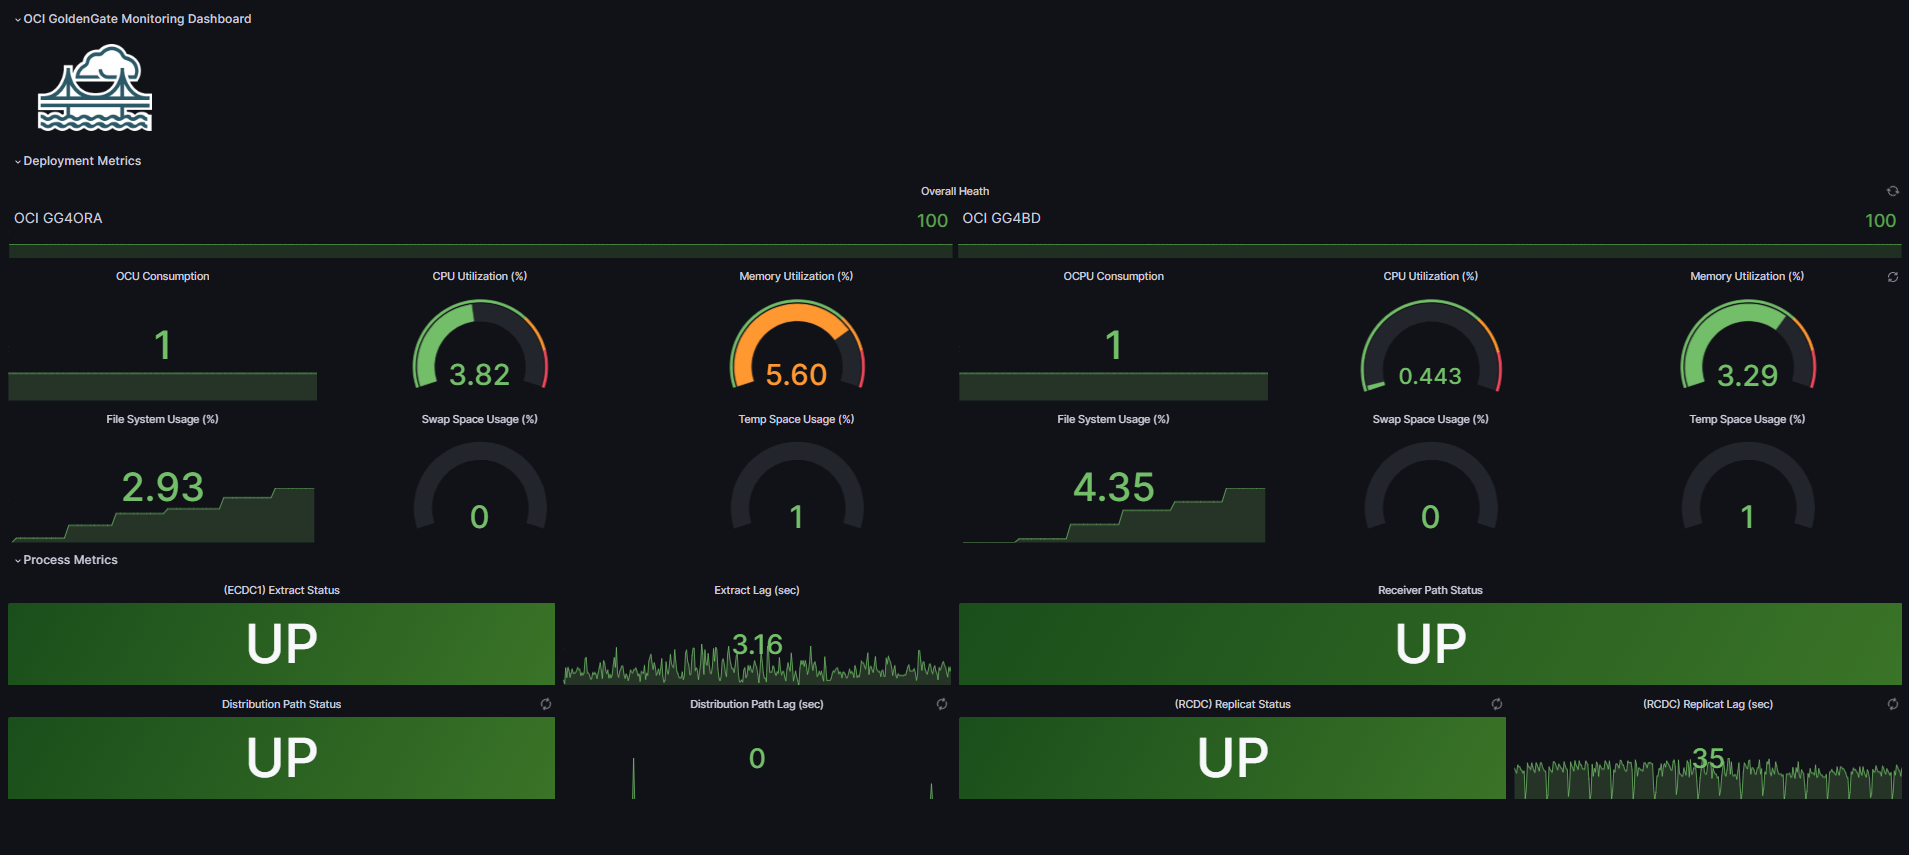
Create a Dashboard for OCI GoldenGate Metrics
To create a Dashboard, click on the Dashboard icon in the left-hand navigation toolbar and then click the New Dashboard menu item.
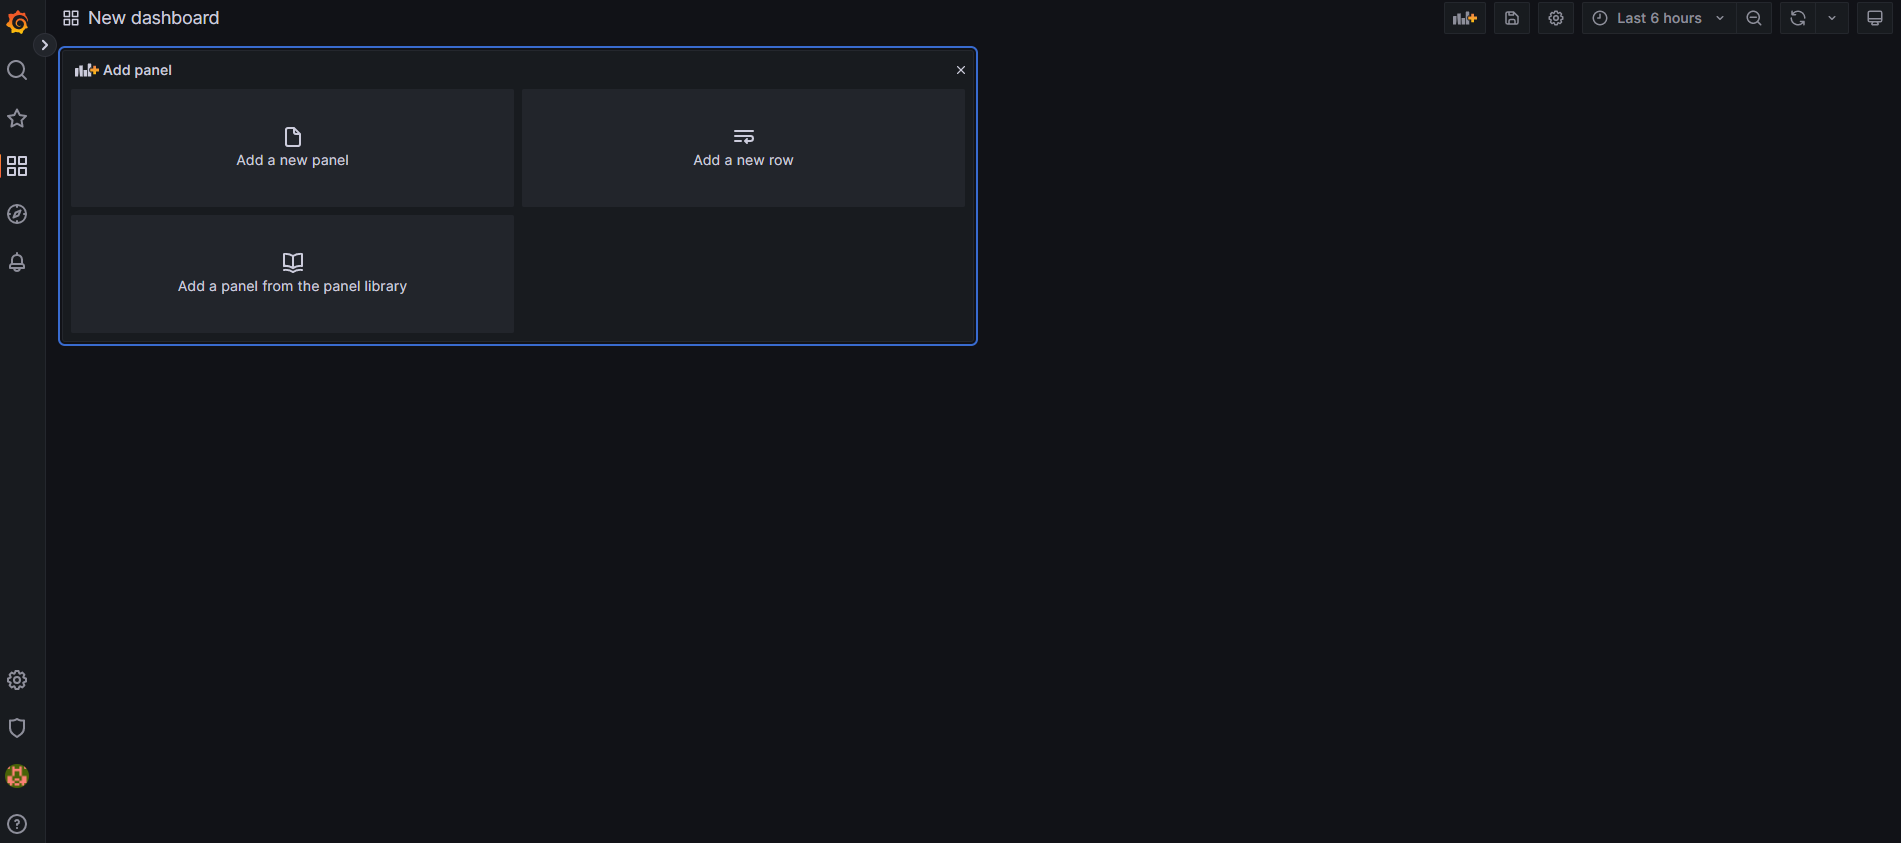
On the New dashboard / Edit Panel window, click Add a new panel box to start configuring tiles for different metrics.
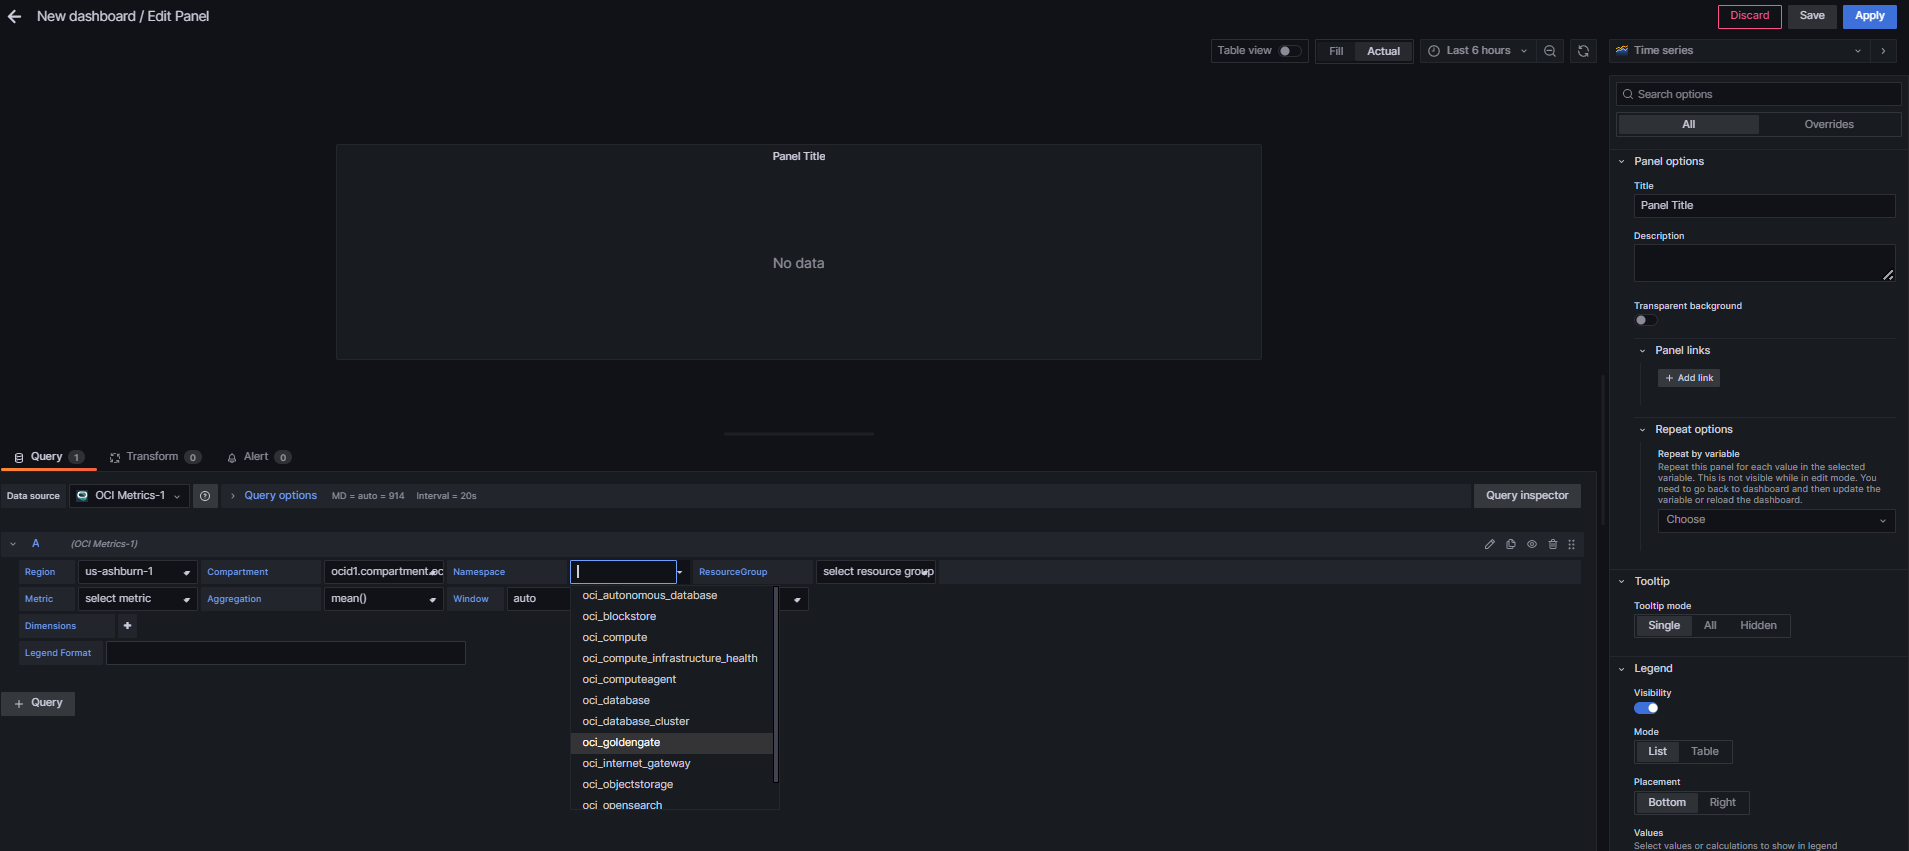
On the Next Page, Under Query tab verify that the Data Source selected is Oracle Cloud Infrastructure Metrics.The regions activated in your tenancy should be automatically visible under the region list.
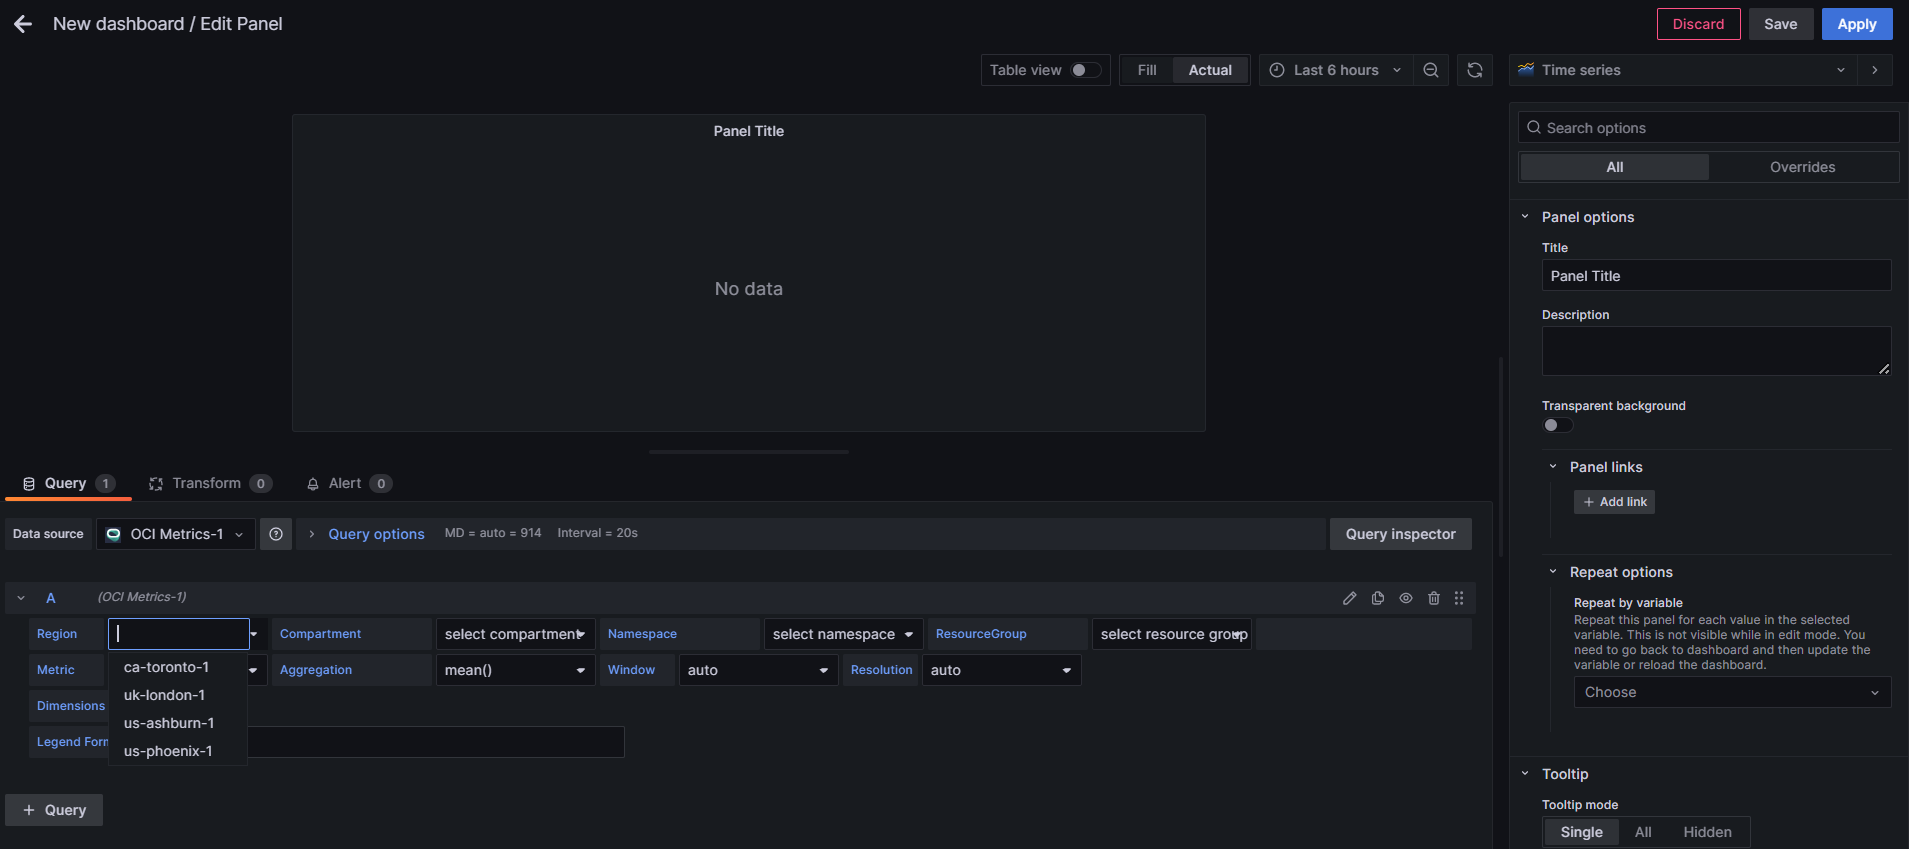
Select the Region,Compartment and Namespace. The Grafana OCI plugin supports a number of resource types on Oracle Cloud: OCI Autonmous Database,OCI Database ,OCI Compute, and many more. For this blog post, we are going to select OCI GoldenGate from the drop-down menu.
The following terms are helpful for understanding metrics:
- Namespace: A container for Oracle Cloud Infrastructure GoldenGate metrics. The namespace for Oracle Cloud Infrastructure GoldenGate is
oci_goldengate. - Metrics: The fundamental concept in telemetry and monitoring. Metrics define a time-series set of datapoints. Each metric is uniquely defined by namespace, metric name, compartment identifier, a set of one or more dimensions, and a unit of measure. Each datapoint has a timestamp, a value, and a count associated with it.
- Dimensions: A key-value pair that defines the characteristics associated with the metric. For example,
resourceId, which is the Oracle Cloud Infrastructure GoldenGate deployment OCID.
You can find details about Available Metrics and its Dimensions for OCI GoldenGate here.
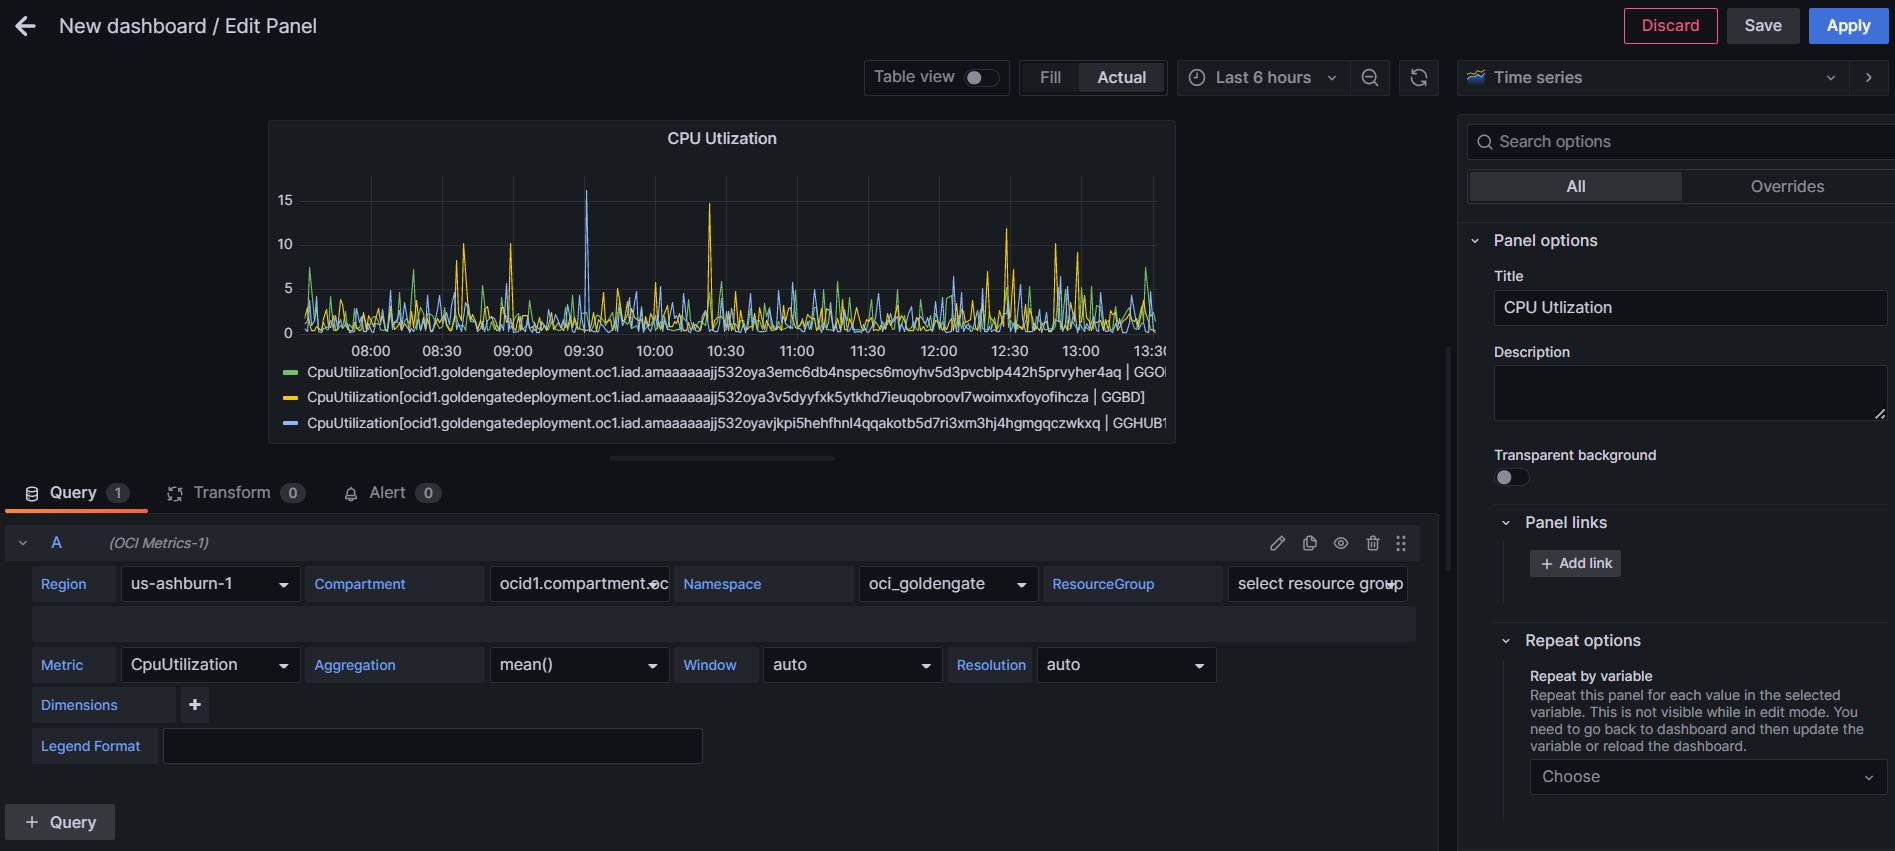
You can chose from multiple Metrics and start creating your own custom Dashboard. For example, Select the CpuUtlization metric under Metric field, and the default view shows CpuUtlization of all the OCI GoldenGate deployments in that compartment.
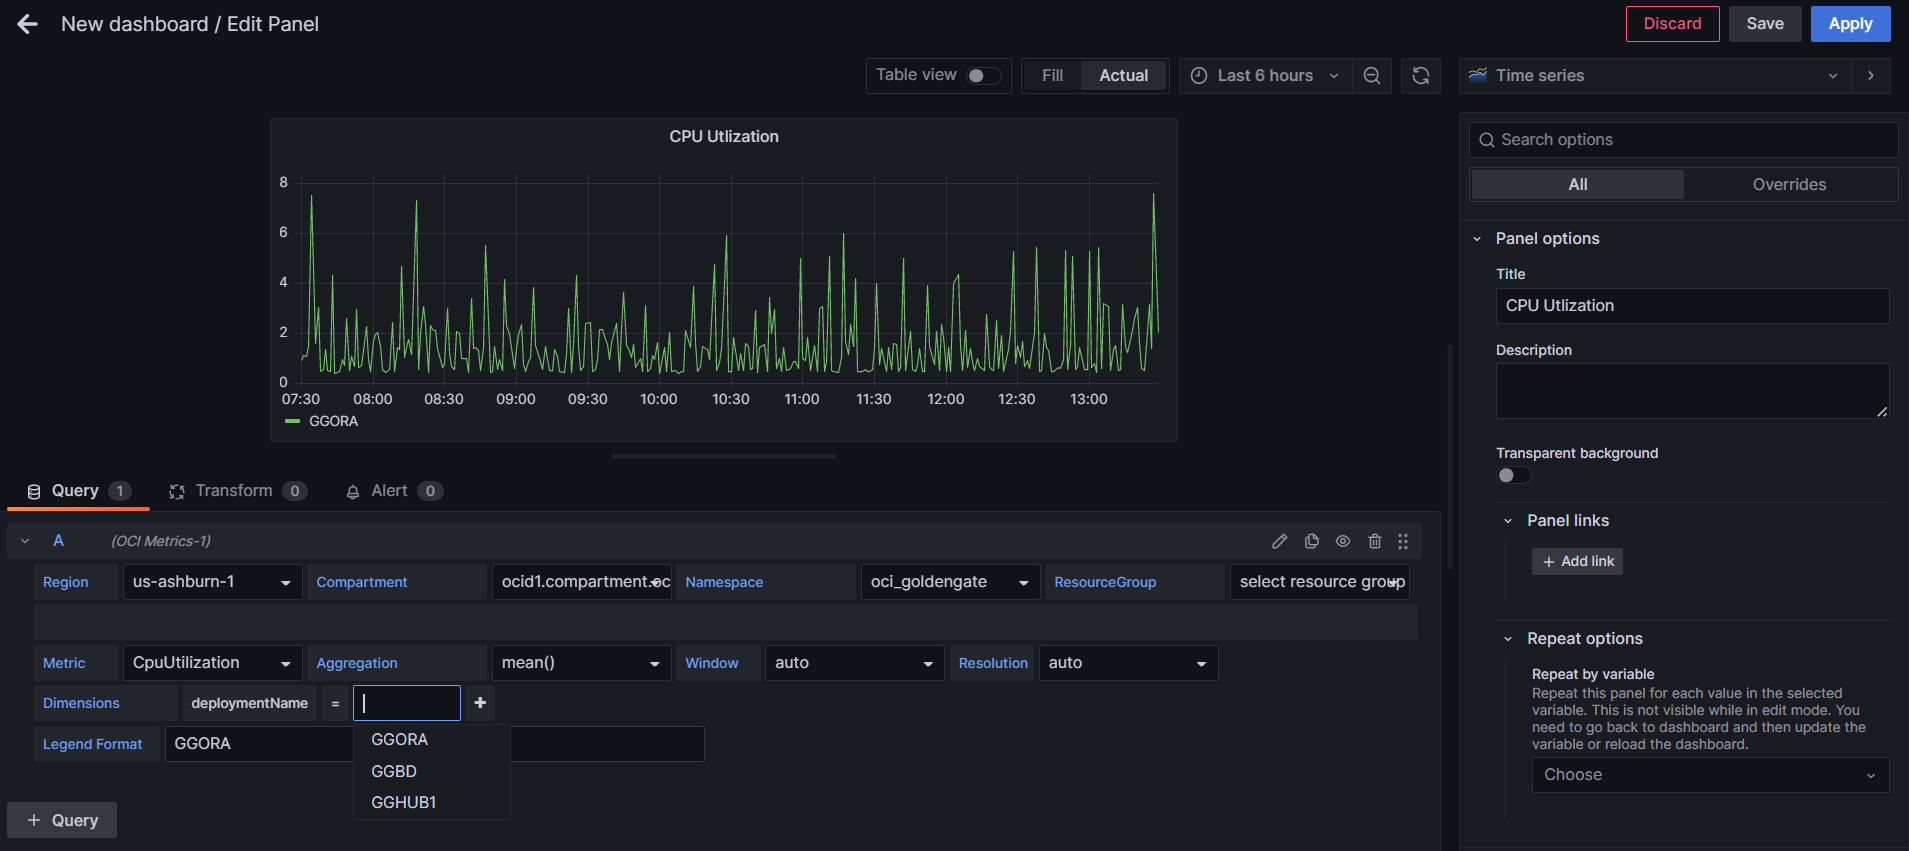
You can customize the Panel by selecting a specific OCI GoldenGate Deployment under Dimensions field and changing the Legend Format from Deployment OCID to Deployement Name.
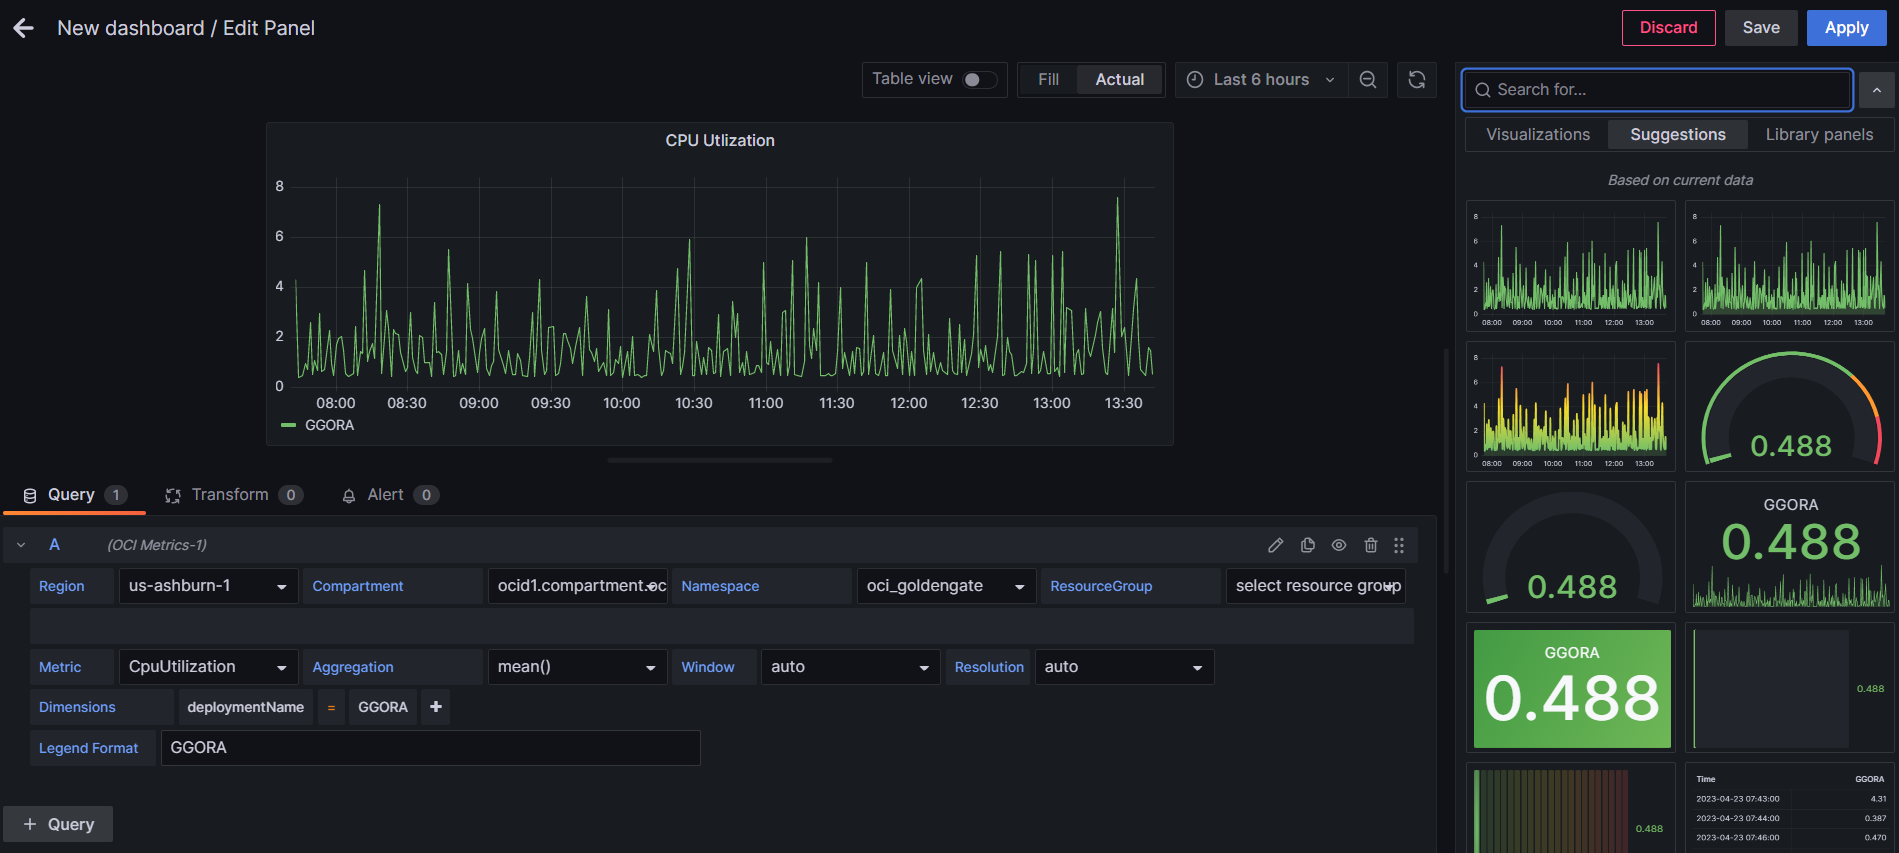
For different Metrics depending on the data, Grafana offers you a very helpful option to select a Visualization from a list of suggested Visualizations.Then Click Apply to save changes and add the current custom Panel to the Dashboard.
You can add different Metrics similarly for each of your OCI GoldenGate deployements to the Dashboard depending on your requirements.Additionally, there are some advanced options that allows you to transform (i.e. join, calculate, re-order, hide, and rename) the Query results before visualization.
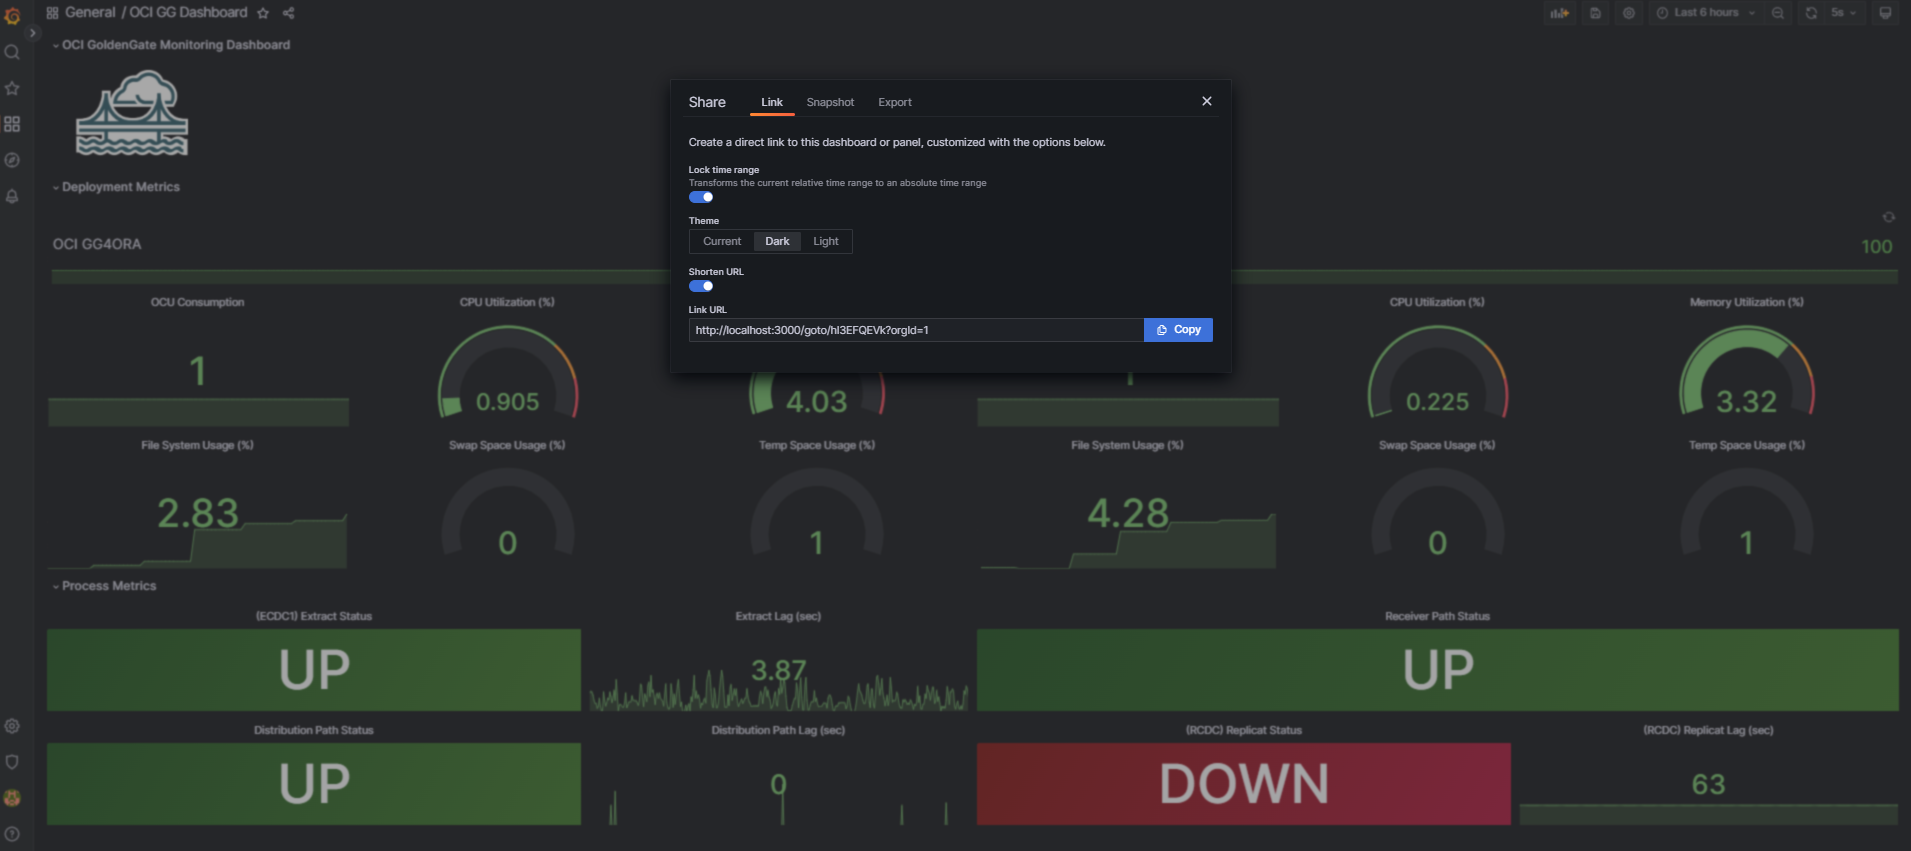
Finally, Grafana Plug-In also allows you to share your custom Dashboard through a link, snapshort or Export to a file.