Depending on the size and volume of the data and your skill set, there are a number of ways to get data into Autonomous Data Warehouse. In this previous post we outlined the steps using SQL Developer and the use of object storage for very large volumes of data.
In this post, we provide another simple and easy choice within just one tool, Oracle Data Visualization Desktop. This single tool will enable you to upload data from a spreadsheet to the powerful Oracle Autonomous Data Warehouse and immediately analyze the data!!
If you don’t have Oracle Data Visualization Desktop already installed, follow these easy directions below. Oracle Data Visualization Desktop provides powerful personal data exploration and visualization in a simple per-user desktop download. Oracle Data Visualization Desktop is the perfect tool for quick exploration of sample data from multiple sources or for rapid analyses and investigation of your own local data sets. Oracle Data Visualization Desktop comes free with Oracle Autonomous Data Warehouse and can be deployed on both Windows and Mac. You can find more information related to Oracle Data Visualization Desktop here
Set Up Local Oracle Data Visualization Desktop Environment
STEP 1: Installing Oracle Data Visualization Desktop on a Windows Desktop
- Download the latest version of Oracle Data Visualization Desktop (DVD) from here After saving the installer .ZIP to your desktop, unzip the file and click on the DVDesktop.exe installer to follow the guided steps.


STEP 2: Securing Your Client Connection to Autonomous Data Warehouse
You want to secure your data from the desktop all the way from the client application to the server where your data is stored. You can now store password credentials for connecting to databases in a client-side Oracle wallet, a secure software container used to store authentication and signing credentials. This wallet usage can simplify large-scale deployments that rely on password credentials for connecting to databases. When this feature is configured, application code, batch jobs, and scripts no longer need embedded user names and passwords. This reduces risk because such passwords are no longer exposed, and password management policies are more easily enforced without changing application code whenever user names or passwords change.
You download the connection wallet as shown in this lab. Go to the directory that you saved your Connection Wallet file. Unzip this zipped file.

- You will need the following two files to create the secure connection.
- cwallet.sso
- tnsnames.ora
Create a Connection to Your Autonomous Data Warehouse from Data Visualization Desktop
STEP 3: Create Connection
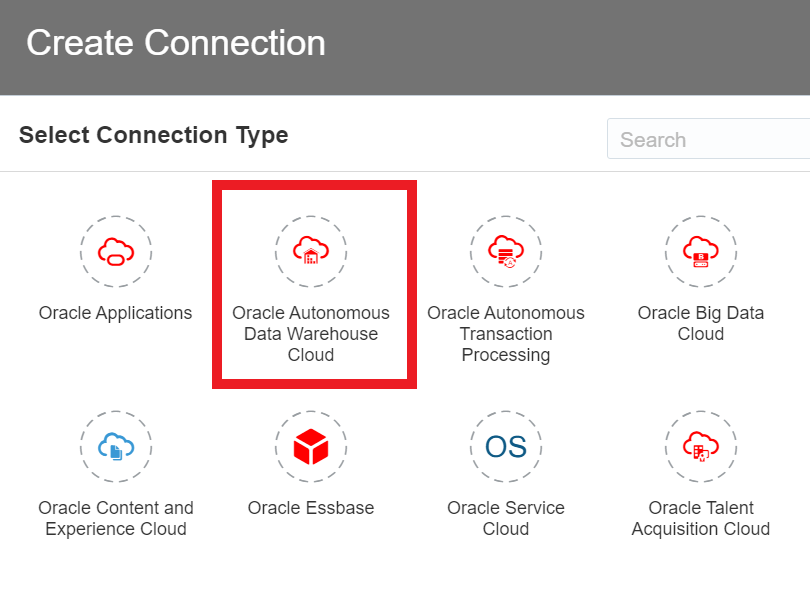
- Start Oracle Data Visualization Desktop. When Oracle Data Visualization Desktop opens, click on the ‘Create’ button and ‘Connection’.

- In the Create Connection Dialog, select the highlighted option for ‘Oracle Autonomous Data Warehouse’ and progress through the wizard.
- Go back to the directory where you saved your wallet file and extracted the file, ‘tnsnames.ora’. Open the file and search for the wallet connection information (in our example “adwfinance_high“) that you will use to connect with.
| Connection Info | Entry |
|---|---|
| Connection Name: |
Type in ‘SALES_HISTORY’ |
| Host: |
(Copy from tnsnames.ora) e.g. adb.us-phoenix-1.oraclecloud.com |
| Port: |
(Copy from tnsnames.ora) e.g. 1522 |
| Client Credentials: |
Click ‘Select’ and select the file “cwallet.sso” from your unzipped Wallet in Step 2 |
| Username: |
Insert username created in previous labs. Same as SQL Developer credentials. |
| Password |
Insert password created in previous labs. Same as SQL Developer credentials. |
| Service Name: |
(Copy from tnsnames.ora) e.g. tuak89quycc88vqkzengdw1high.adwc.oraclecloud.com |
- After completing the fields, click on the ‘Save’ button.
Note: If you are running an older version of Data Visualization Desktop, you may not see an option to select Client Credentials. Update your Data Visualization Desktop or read about connections in older versions in the Data Visualization Desktop User’s Guide.
Below is a sample screen shot for “Create Connection”

Note: If you are running an older version of Data Visualization Desktop, you may not see an option to select Client Credentials. Update your Data Visualization Desktop or read about connections in older versions in the Data Visualization Desktop User’s Guide.
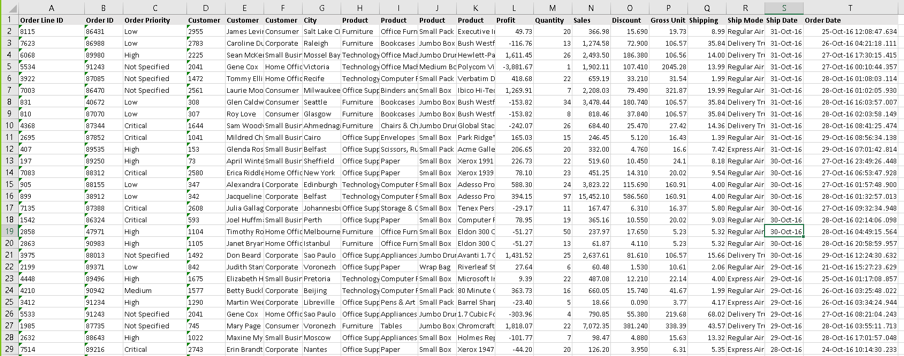
Now that the connection is set up let us take a sample data set and review it. We chose a file titled “Sample Order Lines Oct.xls” for this exercise.
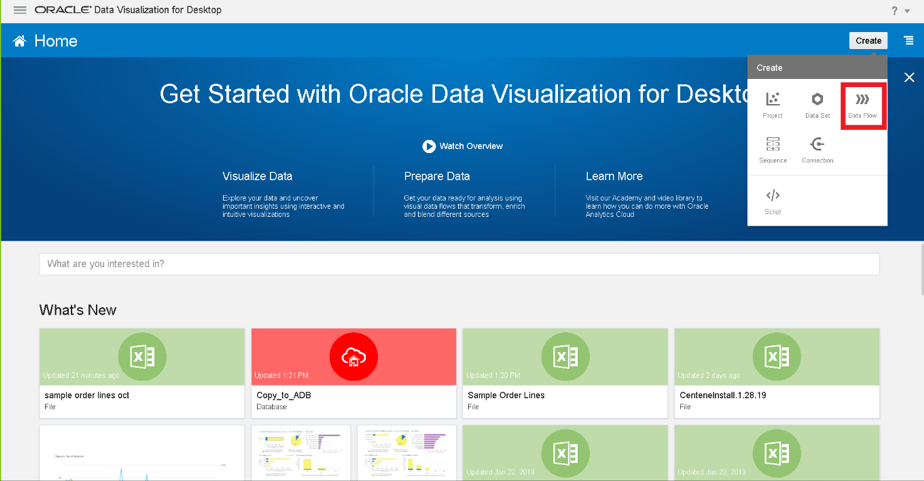
Open Data Visualization Desktop and then
- Click on Create on the right hand top corner
- Click on Data Flow
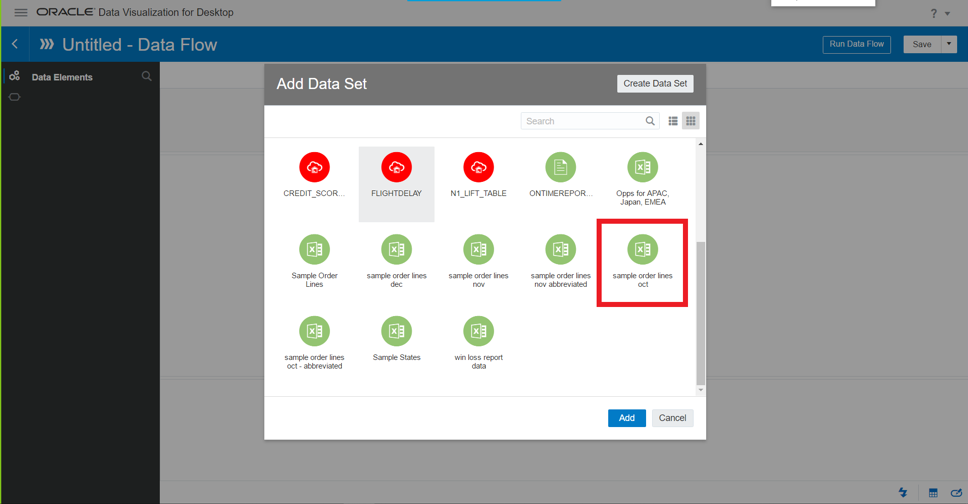
You will be prompted to a new screen where you will see an option to upload file.
- Select the file and hit add.
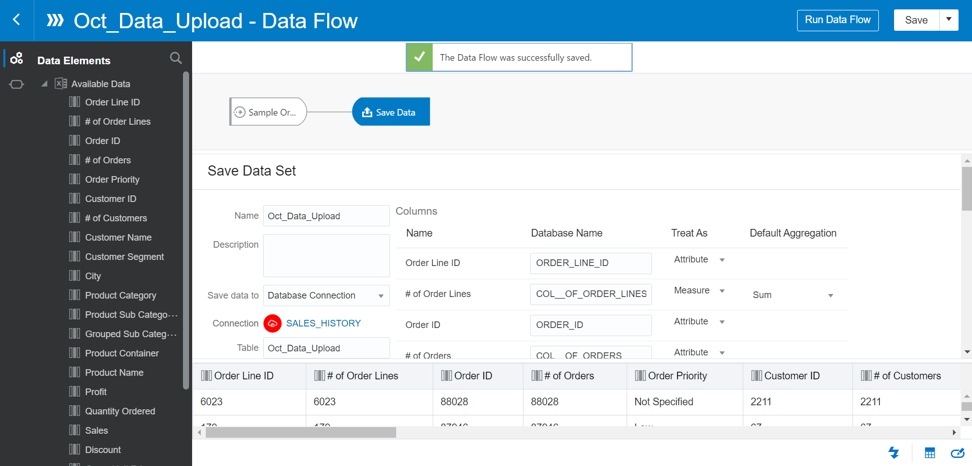
Once your data is loaded, right click the sample order data and select Save Data.
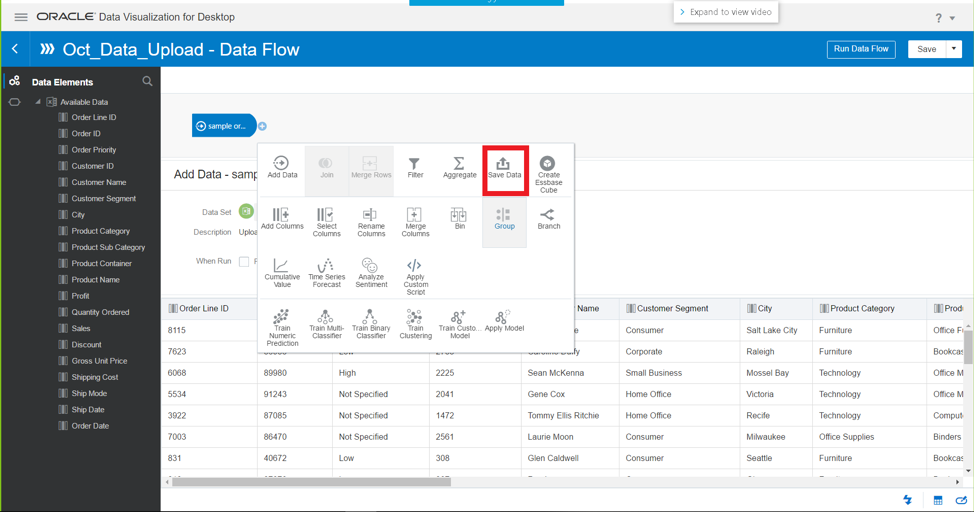
Name the data flow Oct_Data_Upload
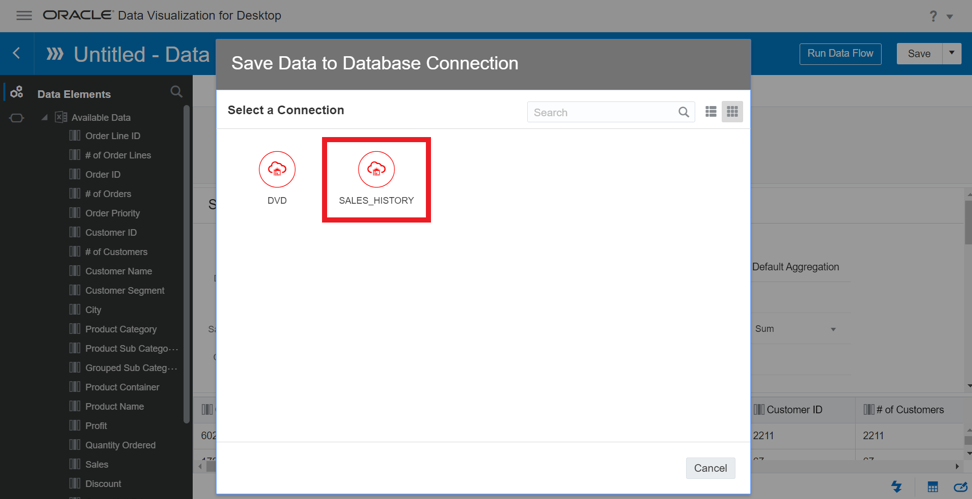
The next step is to set up a Database Connection
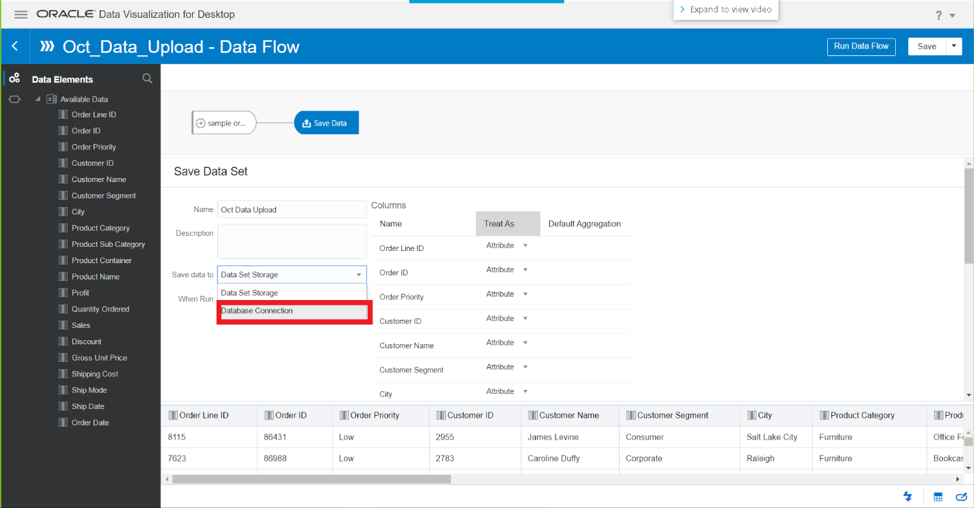
Connect to the database labeled DVD. Name the table something that you find convenient. In this case we chose Oct_Data_Upload
Click Run Data Flow to upload your data into the Autonomous Database. Name the Data Flow.
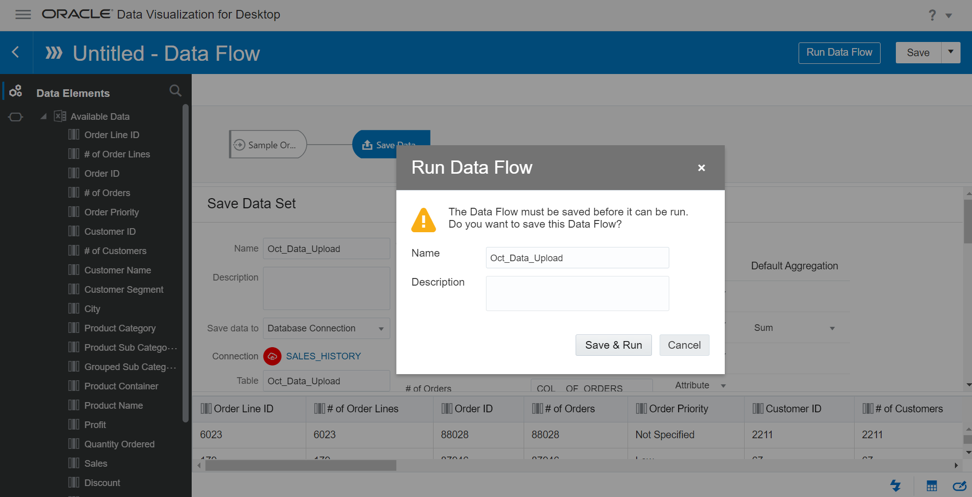
Congrats you’ve pushed data from Data Visualization Desktop into the Autonomous Database:
Now your data is ready to use in the most secure, scalable and fully managed data warehouse: Autonomous Data Warehouse.
Next let us preview the data:
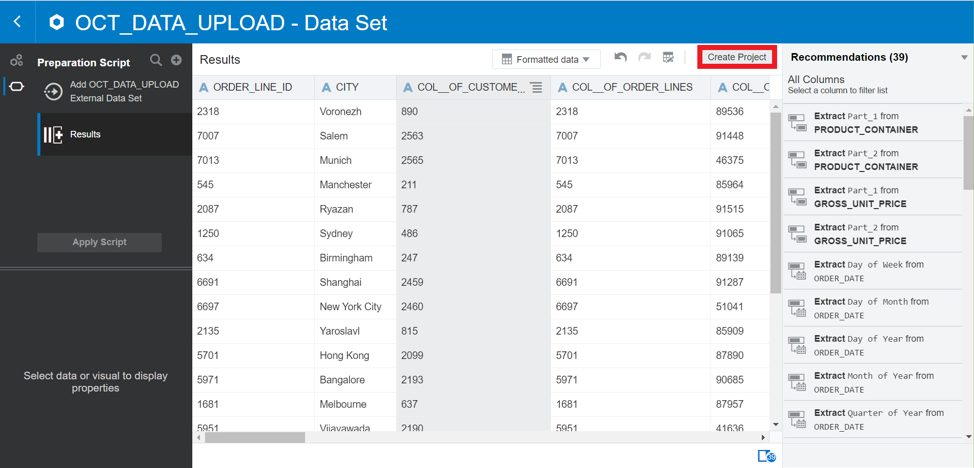
Click on Create Project at the top right corner.
This will take you to a canvas where you can create rich visualizations. Here we create a simple chart for Quantity Ordered by Order Date.
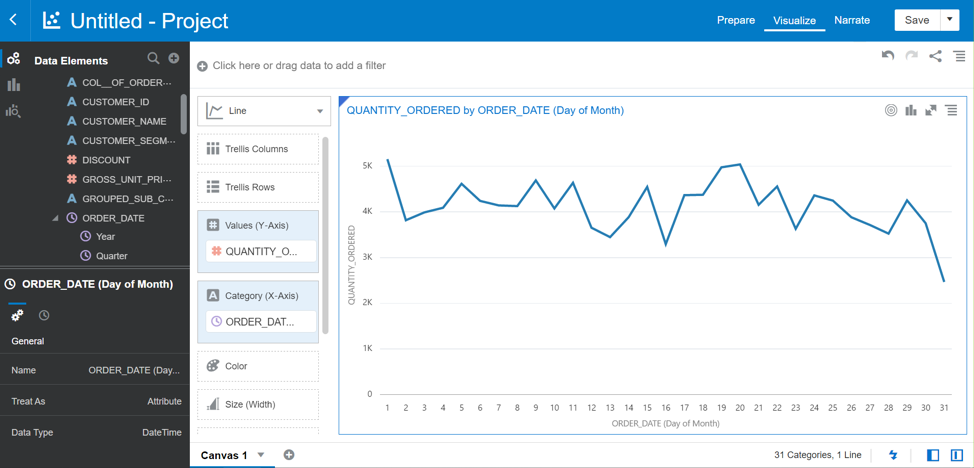
You can add multiple canvases and create visualizations within each canvas and save them.
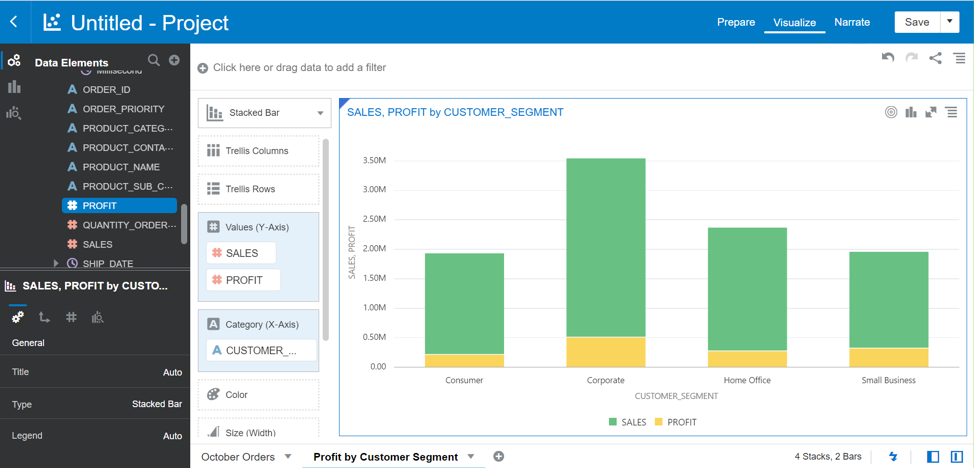
Go and gain powerful insights from your data in the Autonomous Data Warehouse using Data Visualization Desktop. You can find some additional labs on using Data Visualization Desktop with Autonomous Data Warehouse here. And don’t forget to sign up for your free trial of Autonomous Data Warehouse right here.