In Part 1 of the Autonomous Database Observability blog series we covered the tools and services available from Oracle to observe and monitor Autonomous Databases (ADB). In this second and final part of the blog series we’re covering relevant and popular open source third party tools and services used by developers for observability (now including the database): Prometheus and Grafana.
In the realm of modern application development and microservices architectures, observability has become an indispensable requirement for DevOps teams. While developers have embraced open standards and tools like OpenTelemetry, Prometheus, and Grafana for application observability, the challenge lies in consolidating them with database observability. In our previous blog post, we delved into the database observability cycle, discussing telemetry within the database and cloud monitoring and logging services offered by service providers.
Oracle databases, including Autonomous Databases, offer a rich set of metrics and performance values within the database itself. These internal database observability metrics, exposed via dynamic performance views (V$) and global views (GV$), provide valuable insights for performance analysis and tuning. Additionally, for mission-critical application databases that demand optimal performance isolation and comprehensive observability, you can rely on Autonomous Database on Dedicated Exadata infrastructure (ADB-D) which provides access to views that offer insights into the underlying resource stack, such as Storage IOPS, Transport Lag, and more. However, to achieve a comprehensive view of databases as a fleet and gain a deeper understanding of service provider activities (data plane) and infrastructure-level events, external monitoring and logging services are essential. API-enabled infrastructure-wide solutions such as the OCI Monitoring service and OCI Logging service provide the best coverage in this regard. In essence, one can observe the database from both internal and external perspectives.
Both internal and external approaches to observability have their advantages and should be used in conjunction. Internal observability excels in aggregating data with shorter cycles and minimal lag, being closer to the database, but is limited to the scope of the database instance or cluster. External observability, on the other hand, leverages external services for monitoring, allowing access to historical metrics even when the database or cluster is down. Additionally, it enables the collection of infrastructure-wide metrics at various levels. Regardless of the approach, open-source industry-standard visualization solutions like the Prometheus/Grafana combo can be leveraged to process and display the telemetry data.
In the following section, we will explore two distinct methods of achieving observability for Autonomous Databases using Grafana: firstly, through container-based architectures, and secondly, by directly connecting dashboards to the database instance or cloud monitoring/logging services.
ADB Observability and Management in container-based architectures
Modern application development and DevOps processes capitalize on containerized architectures, such as Docker and Kubernetes, due to their speed, efficiency, and ease of management compared to previous virtualization solutions. These architectures offer clear advantages for applications employing microservices, multi-cloud environments, and requiring extensive automation. However, in container-based architectures, effectively aggregating observed database metrics for popular DevOps observability stacks, including visualization on dashboards, is not straight forward.
To address this challenge, developers have turned to exporting telemetry data to Prometheus, a widely-used open-source monitoring system and time series database that seamlessly integrates with popular dashboard tools like Grafana. Specifically for Oracle databases, including Autonomous Databases, the OracleDB exporter for Prometheus (developed by Seth Miller) enables connectivity to the database and facilitates metric generation in Prometheus format. This exporter has gained traction in various open-source projects because of its versatility in connecting to databases outside the Kubernetes cluster or Docker environment, such as databases accessible through a VPN gateway. Additionally, it supports deployments with Prometheus annotations, allowing for automatic discovery and metric collection by a Prometheus server from the OracleDB exporter endpoint without additional configuration.
An excellent application of Seth’s OracleDB exporter can be observed in the monitoring system of Transactional Event Queues (formerly TEQ, now rebranded as TxEventQ). Transactional Event Queues are designed for high-throughput messaging and event streaming in Kafka-compatible transactional applications built with Oracle Databases. The TEQ performance monitoring framework leverages internal database observability through the GV$ views, while the reporting of key queue metrics can be integrated with various user interfaces.
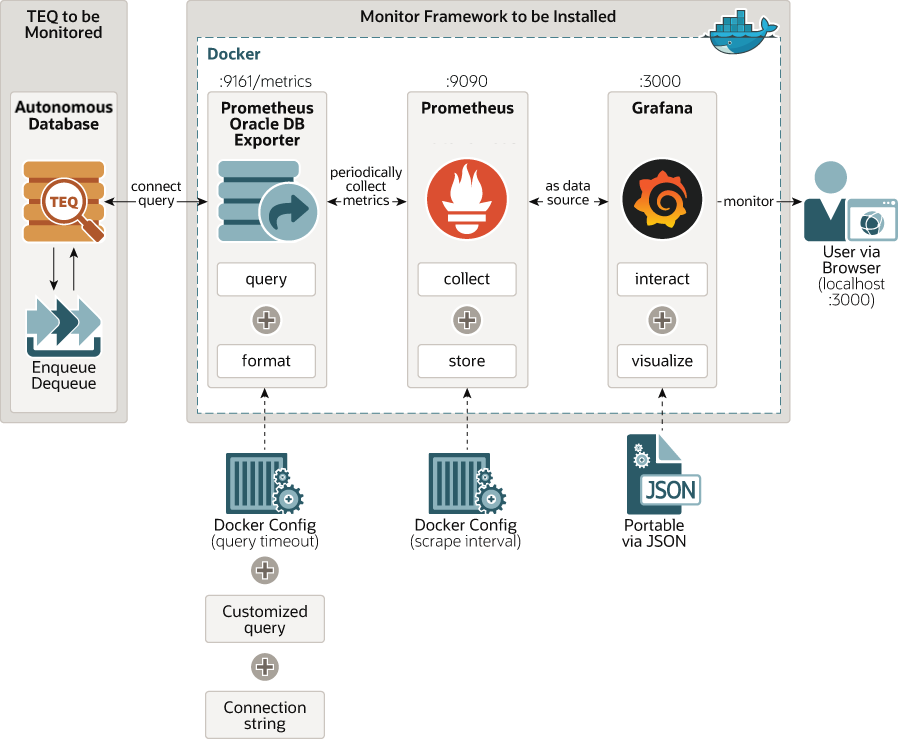
The TxEventQ monitoring system comprises three independent open-source components: the Prometheus Oracle DB Exporter, Prometheus itself, and Grafana. Docker enables this system to operate as a lightweight, portable, self-contained container that can run virtually anywhere. The Oracle DB Exporter connects to the Autonomous Database, retrieves query results, and formats them as Prometheus-like metrics. Prometheus, through a scraping process, controls the exporter to query, collect, and store these metrics. Grafana, in turn, utilizes Prometheus as the data source to visualize the metrics on a dashboard. The entire service is configured, managed, and orchestrated using Docker-compose.
This is an interesting container-based observability architecture that we also leveraged in Prometheus/Grafana for Oracle for reusability and internal observability of any type of Oracle database.
Prometheus/Grafana for Oracle
Prometheus/Grafana for Oracle offers developers in a Kubernetes/Docker (K8S) environment access to database metrics. Similar to the TxEventQ example mentioned earlier, these metrics are stored in Prometheus and visualized through Grafana dashboards. However, this project aims to establish a unified observability framework based on open standards, addressing the challenge of disparate monitoring, tracing, and logging tools that make correlation between them difficult. Currently, application and database observability are distinct, as are on-premises and cloud-based tools. Therefore, there is a need to provide architectures that encompass both the application observability and database observability stack in a unified solution.
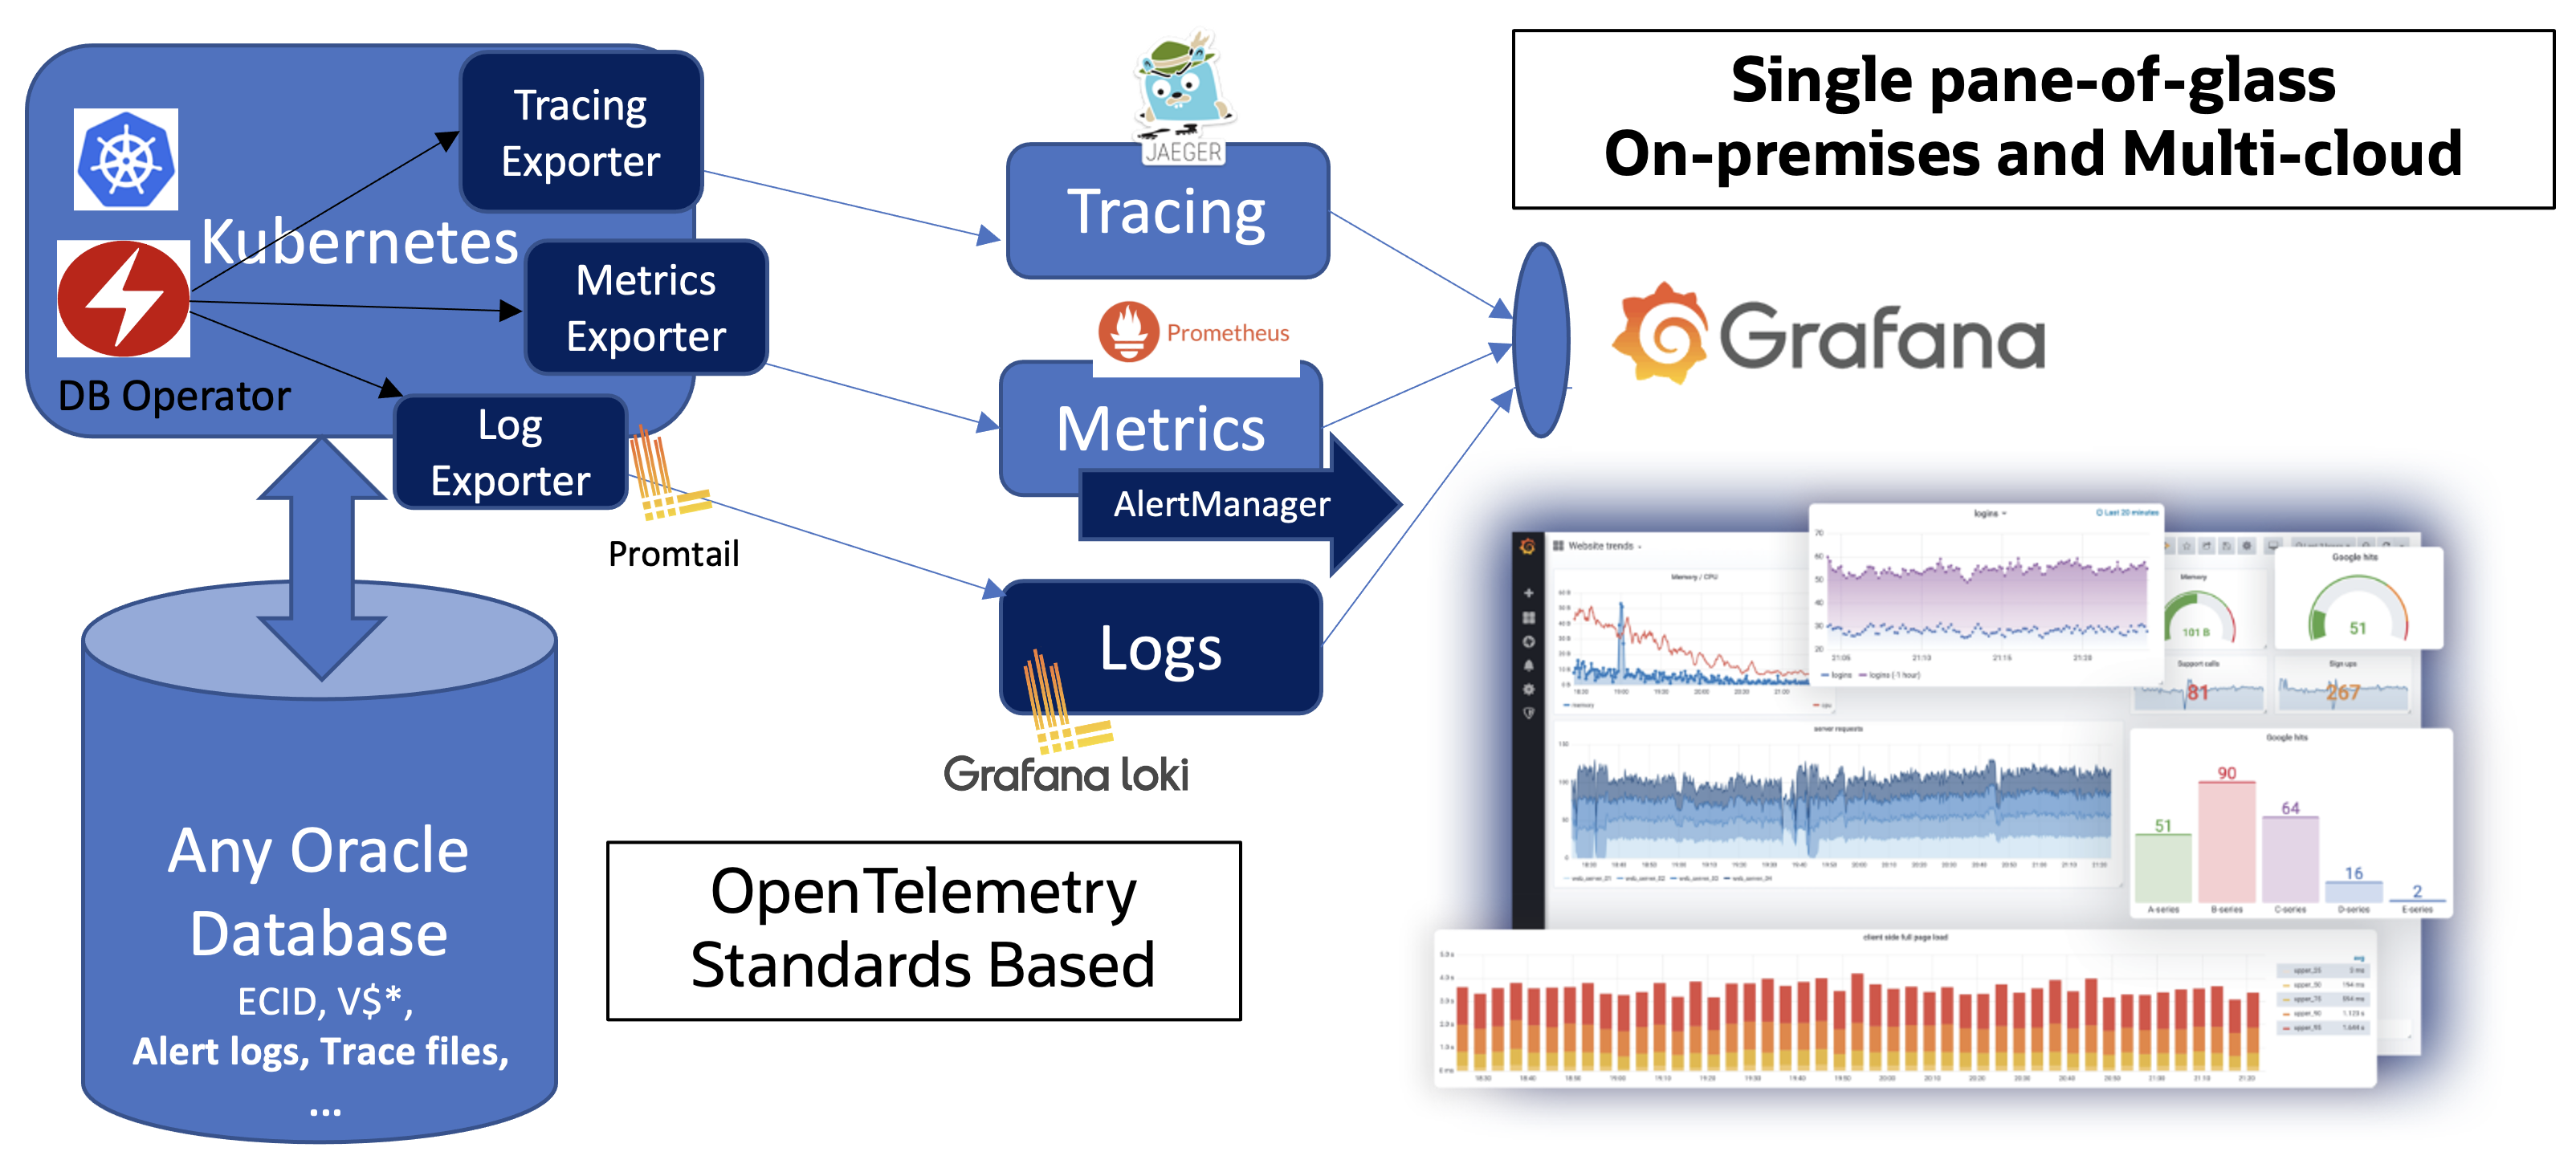
This unified architecture enables comprehensive coverage of all three pillars of Observability (metrics, logs, and traces) in your Autonomous Database using the PLG stack (Promtail, Loki, Grafana). This stack has gained popularity due to its ability to offer a unified view of the system. Grafana’s unique and powerful feature is its capability to analyze and correlate metrics, logs, and traces within a “single pane of glass.” This eliminates the need for tedious tasks like matching timestamps from different consoles. Such functionality is well-suited for modern applications, particularly microservices. A sample scenario below shows a click-through drilldown from Prometheus metrics to Loki/Promtail logs and then to Jaeger tracing across frontend, order, and inventory microservices.
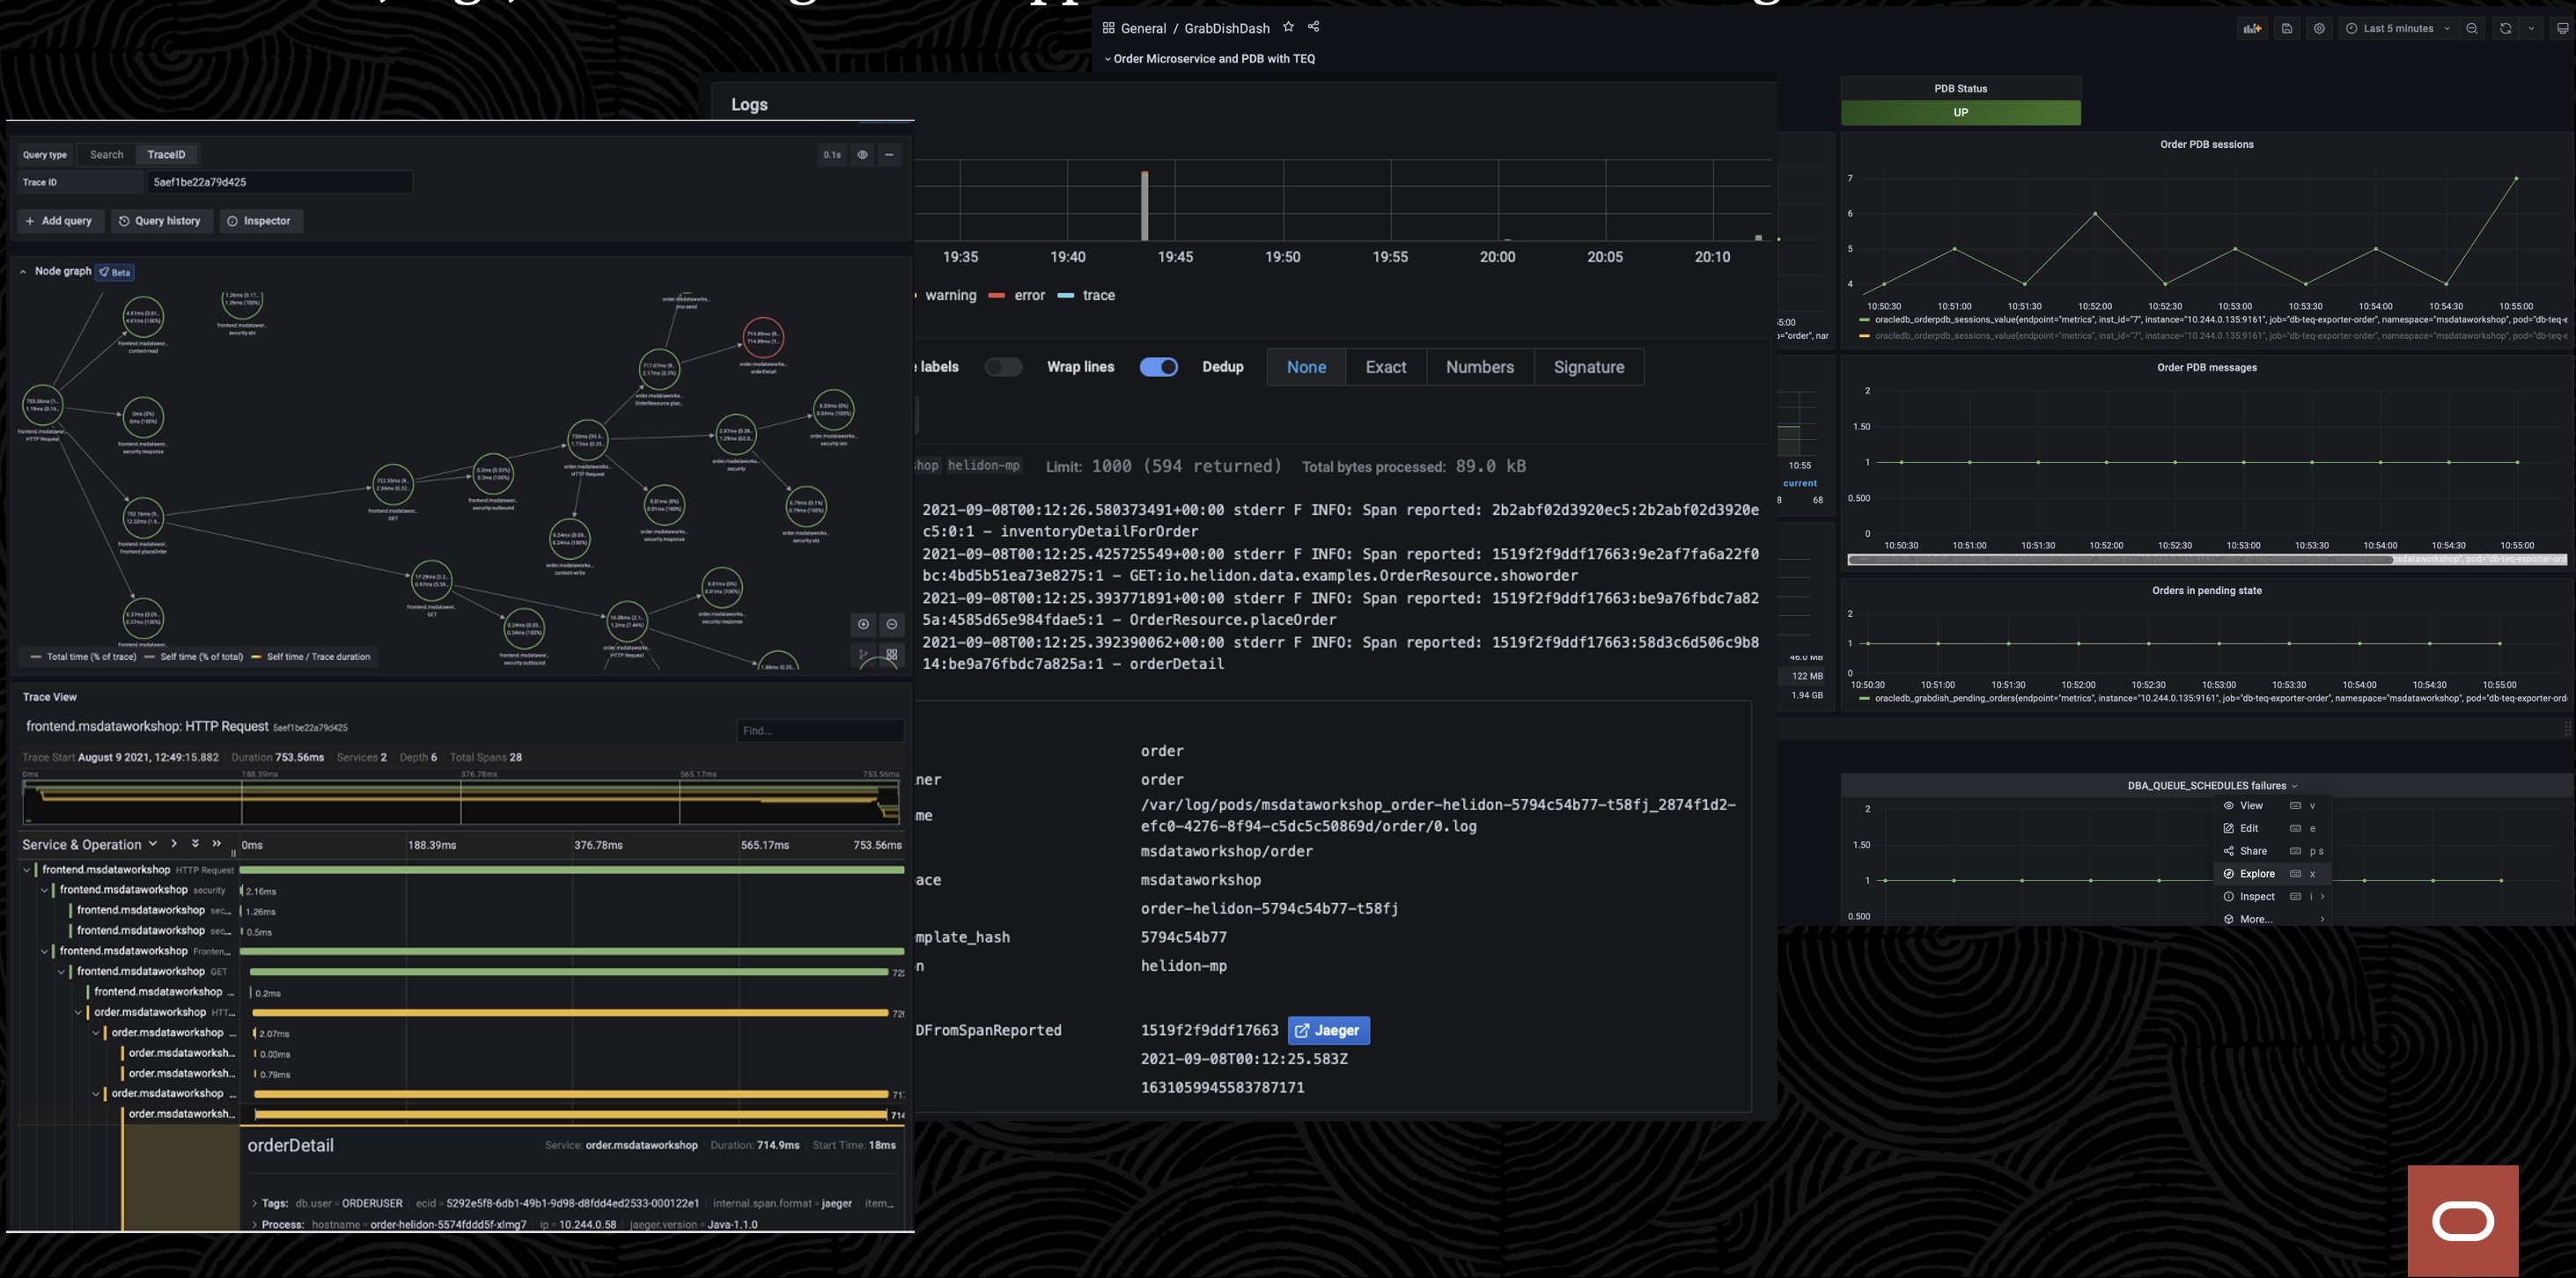
The ability to achieve observability across the application tier (including microservices deployed in Kubernetes) and extend it to the database provides a complete end-to-end perspective of a microservices architecture. This is remarkable because tracing typically ends at the database edge and is restricted to client knowledge.
From a code perspective, the core components of this project are observability exporters for metrics, logs, and tracing, currently undergoing active development. These exporters retrieve information from the Autonomous Database and deliver it to Grafana in the appropriate format through data source plugins (specifically for Prometheus, Grafana Loki, and Jaeger). Leveraging the power of SQL in the Oracle database, users can fully customize the data provided by these exporters dynamically. For instance, a metric can be derived from specific fields of log files combined with certain fields of application data, taking advantage of the unique capabilities of the Oracle converged database for multi-model queries across JSON, ML, and more. Similarly, a trace can be constructed from various aspects/fields of a database operation, such as a stored procedure. Most importantly, these exporters eliminate the need to directly access logs and inherit the security, auditing, and high availability features provided by Oracle databases.
For a comprehensive description of the project and links to relevant workshops, refer to the blog post found here. Additionally, you should keep an eye on the Oracle Database Operator for Kubernetes, an extension of the Kubernetes API with custom resources and controllers that automate Oracle Database lifecycle management. In the near future, this operator will incorporate OpenTelemetry-based unified observability (traces, logs, metrics) with a Grafana dashboard, further enhancing management capabilities for Autonomous Database and Autonomous Container Database within Kubernetes.
Observability with Grafana Data Source plugins
Now, let’s explore the second approach, which is a more direct method to connect our Autonomous Database to Grafana without the need for an exporter. Whether you are using Grafana Cloud or hosting your own Grafana instance, you have direct access to a set of Oracle Data source plugins. We won’t cover Grafana’s infrastructure integration for Oracle in this discussion since it requires the installation of the Grafana agent in your Oracle database, which is more suitable for on-premises deployments (however, it’s important to note that this option exists). These plugins come in three flavors and the table below summarizes details such as requirements and limitations.
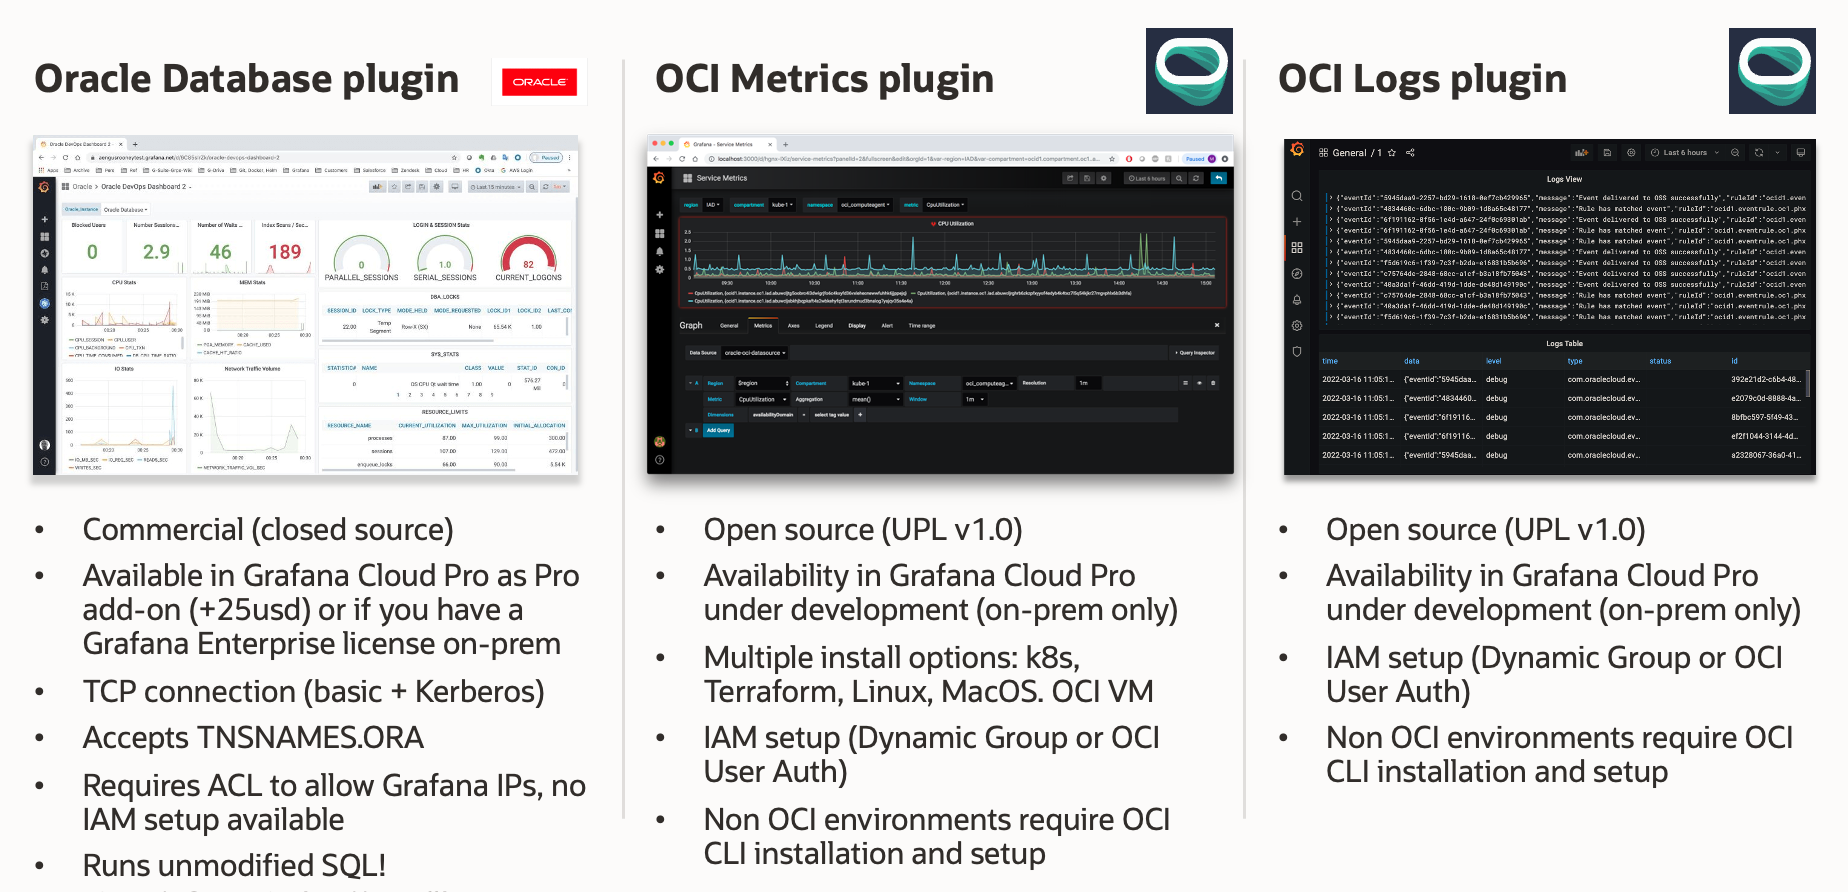
The Oracle Database plugin, built and maintained by the Grafana team, allows for internal database observability by establishing a direct connection to the Autonomous Database. This plugin enables you to pass unmodified SQL queries. To enhance security, you can utilize Kerberos for the TCP connection and restrict database access to recognized source IP addresses (e.g., Grafana Cloud IP addresses). Additionally, it is recommended to limit the privileges of the database user that connects from Grafana, granting only SELECT privileges, for example. To use this plugin, you need to have Grafana Cloud Pro or an Enterprise Grafana license, and there is an additional monthly cost associated with it since it is an Enterprise plugin. There’s a similar plugin for Autonomous Database provided by Oracle but it has not been published as an official Grafana plugin yet (hence it’s not available in Grafana Cloud).
Alternatively, you can leverage the OCI Metrics and OCI Logs plugins for Grafana (built and maintained by Oracle). These plugins connect to the corresponding Oracle Cloud Infrastructure (OCI) services, enabling you to observe various services hosted in OCI, including Autonomous Databases. Configuring these plugins is straightforward if your observability stack, including the Grafana instance, is already in OCI. You simply need to use the Instance Principal with a configured Dynamic Group and policy (IAM) to allow read access to metrics/logs and compartments. If your Grafana instance is located outside OCI, you can still connect to these services using the plugins, but you’ll need to use a User Principal configuration. This configuration requires access to the instance running Grafana and the ability to set up the OCI CLI on the machine. Please note that starting from versions 4.x.x of the plugins, the OCI CLI is no longer required, but you still need to provide parameters similar to those found in the .oci/config file, including a Private API Key.
These plugins are straightforward from a software engineering perspective and are being used in production environments. Companies like Utilita, a UK-based energy company that leverages Oracle databases to help customers save on their energy bills, rely on native Grafana plugins, such as the Oracle DB Grafana plugin, to observe their databases and gain valuable business insights.
To learn more about configuring the OracleDB datasource plugin, refer to this link. For information about the OCI Metrics datasource plugin, visit this link, and for details on the OCI Logs datasource plugin, follow this link.
Final Thoughts: Wrapping Up the Journey
We hope that this final blog post in the Autonomous Database (ADB) Observability blog series has provided you with a comprehensive understanding of the various methods available to connect Autonomous Databases to Grafana dashboards. We have also discussed some underlying architectural details that support a unified observability platform with ADB and Prometheus/Grafana.
If Grafana isn’t your primary focus but you still want to enable Autonomous Database observability scenarios, we recommend exploring the OCI Monitoring service (part of Oracle’s Observability and Management platform). This service offers multiple ways to leverage Autonomous events through OCI API, SDK, and CLI. When combined with our previous blog post, where we covered Autonomous Database observability with Oracle tools and services, you should now have a broader perspective on your ADB observability options across all stages of the database observability cycle, including telemetry collection, database monitoring, query analysis, and performance tuning.