This is Part 1 of an Autonomous Database (ADB) Observability blog series where we’ll cover the basics of database observability and then introduce the most relevant Oracle tools and services that you can leverage to observe your Autonomous Databases. In Part 2 we’ll be covering relevant and popular third party tools and services used by developers for observability (including the database): Prometheus and Grafana.
Companies are rapidly adopting modern development practices: agile and polyglot development, hybrid cloud configurations, CI/CD, DevOps and also cloud-native technologies such as microservices, container-based architectures (Docker, Kubernetes), serverless functions and cloud-based database services. In this process they’re deploying new application components very often, in many places and in different languages in such a way that standard IT monitoring can’t keep pace.
What’s needed is more abundant, higher-quality telemetry that can be used to create high-fidelity, context-rich, fully correlated multi-level metrics for every application event, transaction, infrastructure change, etc. Enter Observability.
Observability goes beyond monitoring in a similar way in which DevOps goes beyond development: it’s an iterative process aimed at first maintaining IT systems working nominally to later improve them over time. It requires proper tools, frameworks and services to be able to understand what’s deviating these systems from a healthy status and then take corrective action.
But what does it mean for the database? Diagnosing and troubleshooting issues in an application can be particularly difficult and time-consuming when issues occur at the database level. So database observability is put in place to track the database performance and resources health with the end goal of being able to create and maintain a high-performing and available application infrastructure. But database observability goes beyond database monitoring by introducing a multi-step iterative process incorporating relevant telemetry collection and performance analysis/tuning as first-class citizens to improve database health over time.
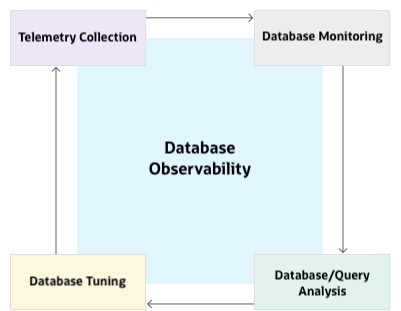
There are multiple advantages to having a database observability framework in place:
- Know overall database health at a glance and be able to adjust resources up or down depending on load
- Monitor high-level key database performance indicators
- Find the bottlenecks due to the database load or the system load, by monitoring CPU load, memory utilization, and database wait classes
- Access event streams to know your managed service provider is aware of and responding to anomalies
And there are also multiple tools and services (both from Oracle and third parties) that allow you to go though the database observability cycle with Autonomous Databases.
Observing the Autonomous Database
Autonomous Database is a cloud database service running in the Oracle Cloud infrastructure (OCI) and Cloud@Customer that uses machine learning to automate database tuning, security, backups, updates, and other routine management tasks traditionally performed by DBAs. The service supports all types of applications and levels of database criticality, but is especially well-suited for modern application architectures that utilize multiple data types, workloads, and analytic functions in a single solution. Autonomous Database on Dedicated Exadata Infrastructure and Cloud@Customer (ADB-D) gives you the highest degree of observability for an Autonomous Database deployment as it provides access and control over the whole stack of resources, from the underlying Exadata infrastructure (EI) up to the to the Autonomous Database instance (ADB).
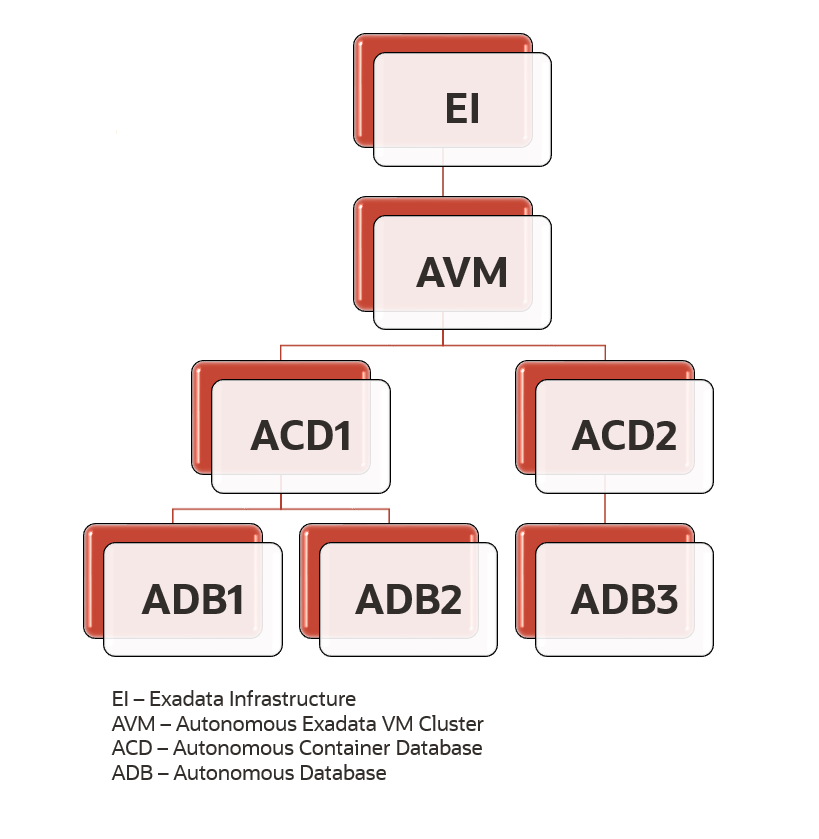
Multiple types of events are generated by ADB-D resources at all levels (and then aggregated by the Oracle Cloud Infrastructure Monitoring Service) which creates new opportunities for observability like setting up alarms, notifying other services, integrations using event streaming, etc. (see the Events and Notifications section below).
This deep level of observability is a key feature of ADB-D and is an integral part of its responsibility model: Oracle automates and takes over almost all routinary database maintenance tasks such as provisioning ADB resources, backup/restore, patching and upgrading, scaling, auditing and alerts/notifications but monitoring the application health and performance at all levels belong to the customer (including monitoring the performance of database queries). But even for these customer-led tasks you can count on Oracle’s tools and services to fully observe your Autonomous Database resources. And on top of this Oracle also gives you observability even for those areas of responsibility that tipically belong to your managed service provider, so when the managed aspects of your solution are experiencing issues, you know your managed service provider is aware and responding appropriately.
Observability Tools and Services for Autonomous Database within the OCI console
Direct access to ADB Metrics
Within the OCI console you can use Autonomous Database metrics to diagnose and troubleshoot problems and to create alarms on key metrics based on thresholds. These service metrics are accessible straight from your ADB instance console and allow you to measure useful quantitative data like CPU and storage utilization, SQL executions, transactions, etc. while filtering by key dimensions like AUTONOMOUSDBTYPE, the type of Autonomous Database, Autonomous Data Warehouse (ADW) or Autonomous Transaction Processing (ATP) and the DEPLOYMENTTYPE, the Exadata infrastructure type, Shared or Dedicated.
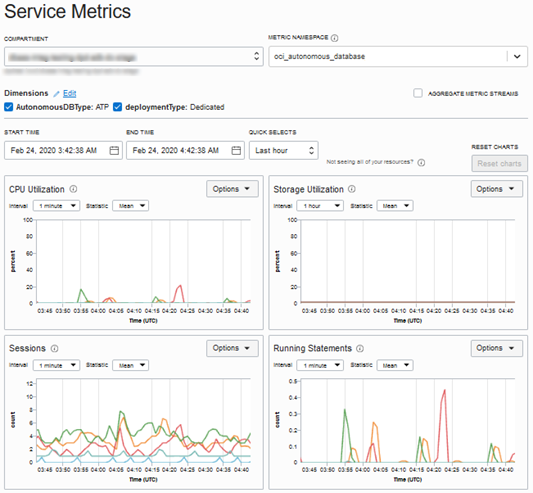
This direct access to the database metrics in the OCI console makes it very easy to create specific alarms, like for example setting up an alarm on a CPU utilization threshold.
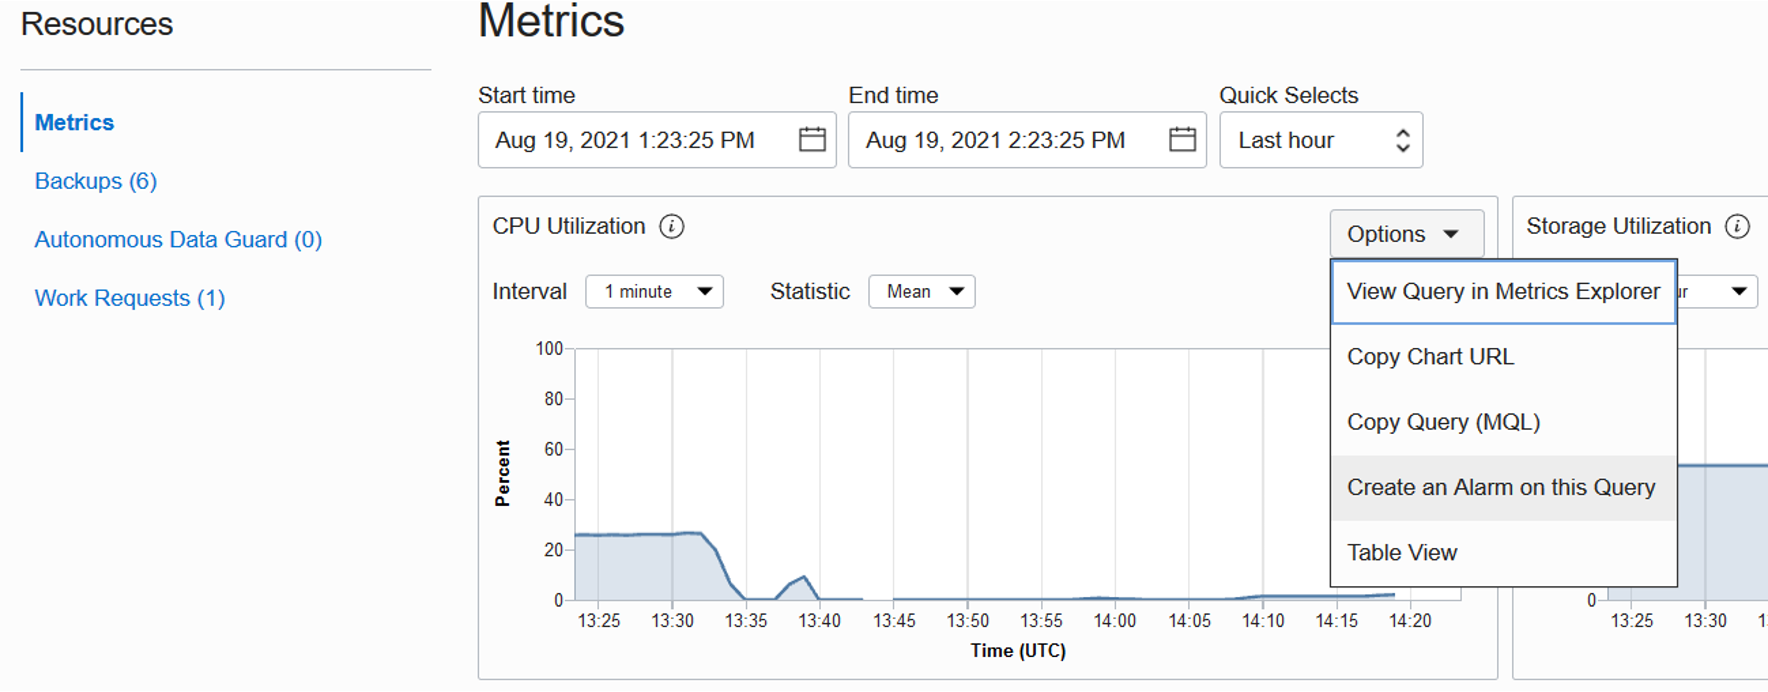
Events and Notifications
Oracle Cloud Infrastructure Events inform about any state change of a cloud resource including Autonomous Database resources. You work with events by creating rules. Rules include a filter you define to specify events produced by the resources in your tenancy. Rules must also specify an action to trigger when the filter finds a matching event. Examples in ADB that you can catch with rules (to then take action) are for example events such as the creation/termination of ADB instances, maintenance begin and end events, and more. For example, you could trigger a data load into an ADB instance when a file has been uploaded to object storage. The Events and Notifications service can even be integrated with third party services like Pager Duty and Slack for operations management.
ADB-D allows you to tap into events at all levels of the resource stack:
- Cloud Exadata Infrastructure / Exadata Infrastructure Events
- Compartment (Change), Create (Begin, End), Maintenance (Reminder, Scheduled, Begin, End), Terminate (Begin, End), Update (Begin, End), Warning and Critical Events
- Autonomous VM Cluster Events
- Compartment (Change), Create (Begin, End), Terminate (Begin, End), Update (Begin, End) Warning, Information and Critical events (SSL Cert expired)
- Autonomous Container Database Events
- Compartment (Change), Create Backup (Begin, End), Create (Begin, End), Maintenance (Reminder, Scheduled, Begin, End), Restart (Begin, End), Restore (Begin, End), Rotate Encryption Key (Begin, End), Terminate (Begin, End), Update (Begin, End), Warning, Information, and Critical events
- Autonomous Database Events
- Auto Backup (Begin, End), Backup Update (Begin, End), Change Database Name (Begin, End), Change Compartment (Begin, End), Create Backup (Begin, End), Deregister/Register ADB with DataSafe (Begin, End), Restart (Begin, End), Generate Wallet, Long-term Backup Will Expire (IN 24 hours, 30 days, 90 daysRestore (Begin, End), Rotate Encryption Key (Begin, End), Start/Stop (Begin, End), Terminate (Begin, End), Update (Begin/End) , Warning, Information, and Critical events
- Autonomous Data Guard Association Events
- Create (Begin, End), Failover (Begin, End), Reinstate (Begin, End), Switchover (Begin, End), Critical
On top of all the events related to the resourse stack, ADB-D also gives you access to Data Plane events which are the events that will tell you what is happening with the managed aspects of your service (e.g. Oracle DevOps activities that are happening) so there are no gaps in observability capabilities of the service.
For a full list of Autonomous Database events see this page.
Performance Hub
Performance Hub displays information about the performance of your Autonomous Database for a specified time period allowing you to view real-time and historical performance data. It provides integrated system-wide and session-specific views of the database activity with these specific reports and views:
- Automatic Workload Repository (AWR) Reports
- Active Session History (ASH) Analytics
- Real-Time SQL Monitoring
- SQL Details Automatic Database Diagnostic Monitor (ADDM)
- Blocking Sessions
- Analyze transient performance problems with the application that are short-lived
The Automatic Workload Repository (AWR) is particularly useful for observing ADB as it collects, processes, and maintains database performance statistics for problem detection and self-tuning purposes. An AWR report shows data captured between two points in time (or snapshots) with relevant statistics such as: object statistics that determine both access and usage statistics of database segments, time model statistics based on time usage for activities, some of the system and session statistics collected in the V$SYSSTAT and V$SESSTAT views, SQL statements that are producing the highest load on the system and Active Session History (ASH) statistics, representing the history of recent sessions activity.
The ASH Analytics tab within Performance Hub shows Active Session History (ASH) analytics charts to explore Active Session History data. You can drill down into database performance across multiple dimensions such as Consumer Group, Wait Class, SQL ID, and User Name.
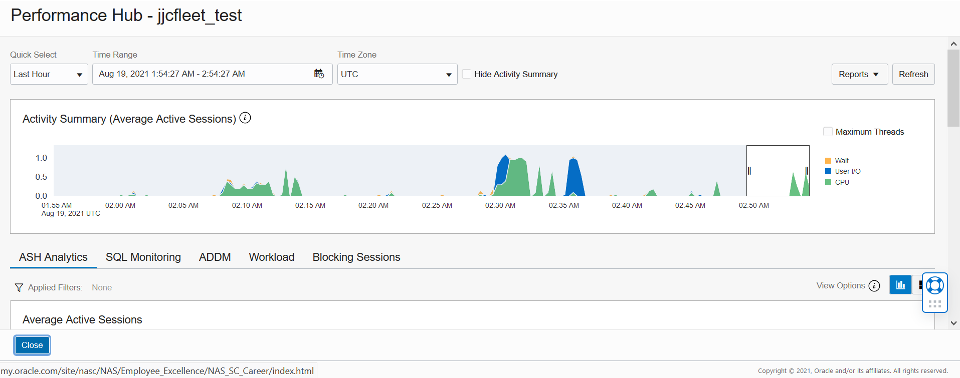
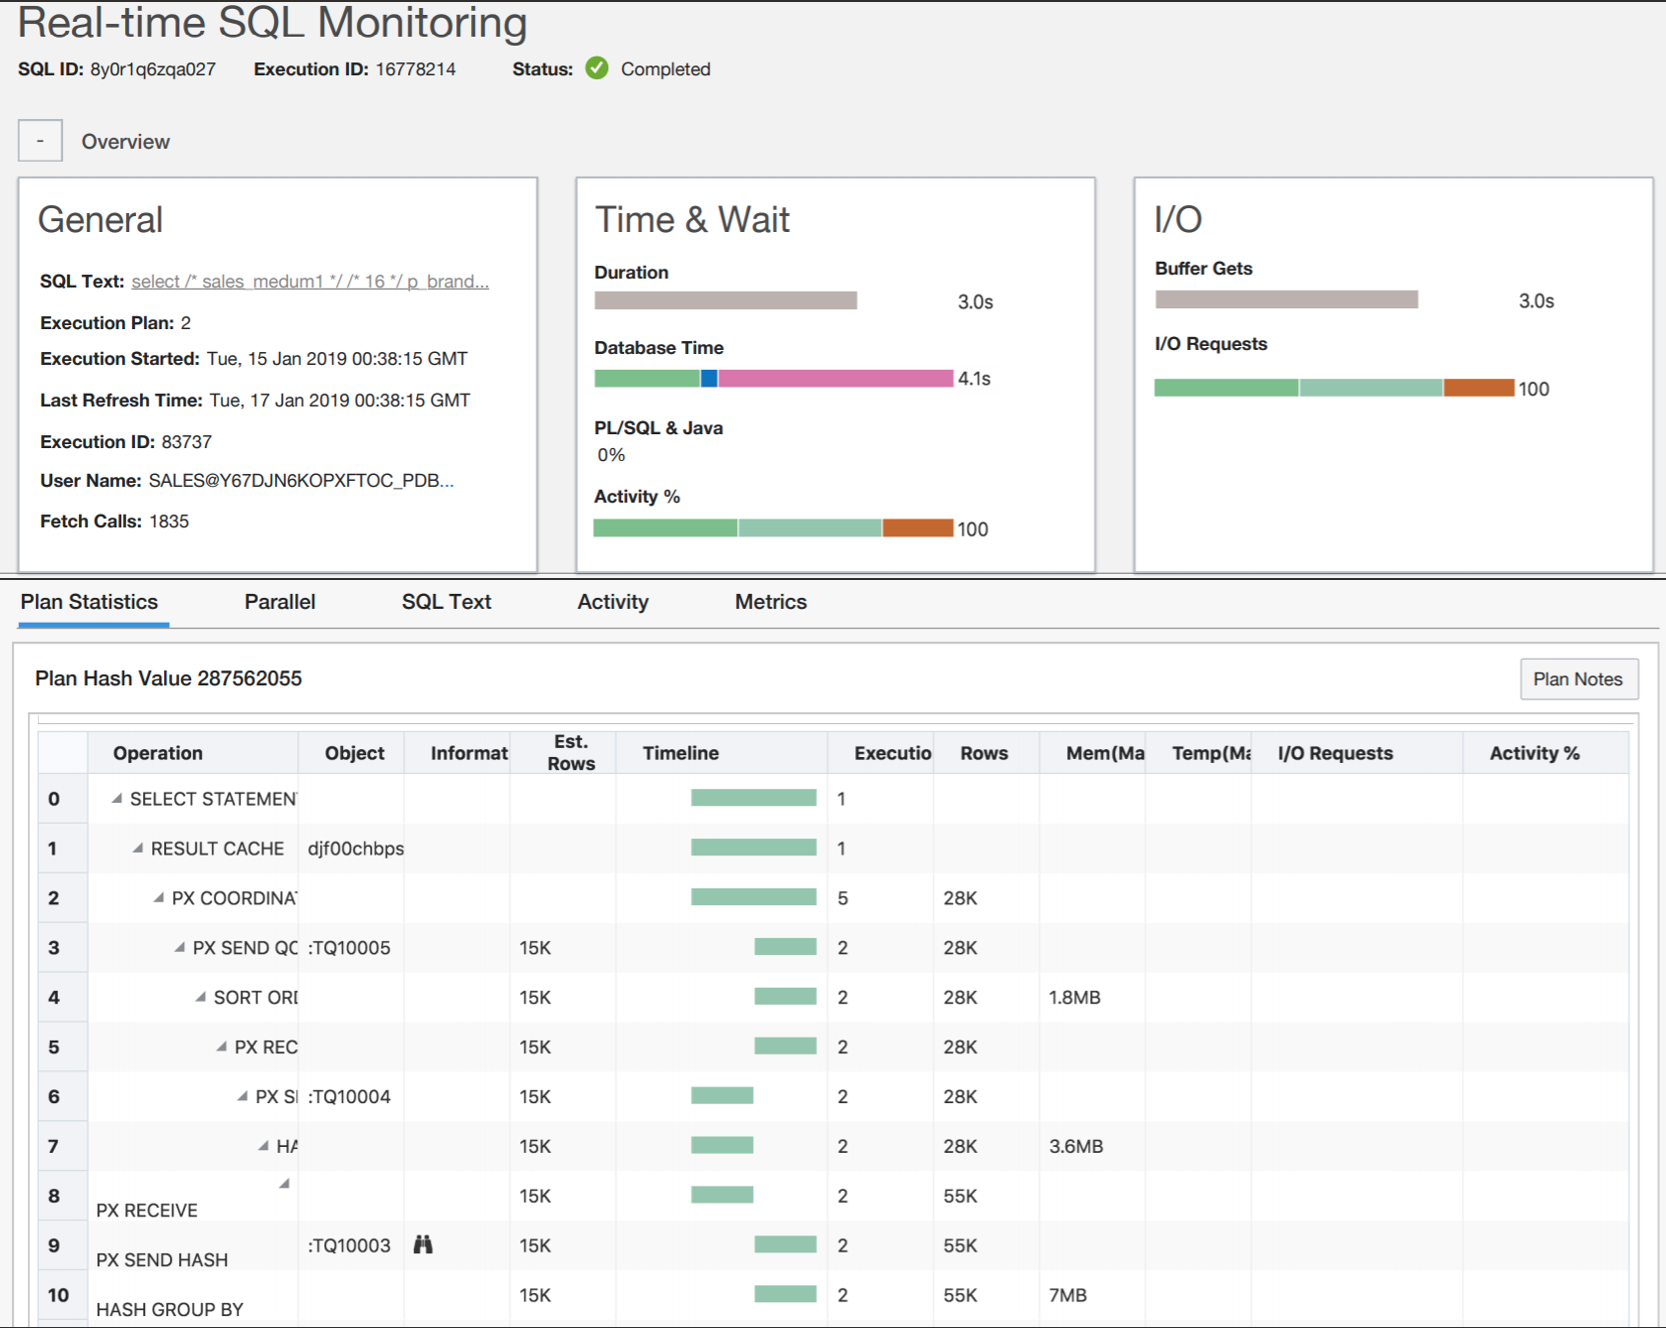
Real-time SQL monitoring provides in-depth application performance analysis. It helps to: identify poorly written and designed SQL statements, identify and guide optimization of application calls in the data tier, capture fine-grained SQL statistics at each step of the execution plan and analyze current and historical SQL statements.
The Automatic Database Diagnostic Monitor (ADDM) tab provides access to analysis information gathered by the Automatic Database Diagnostic Monitor tool. ADDM analyzes AWR (Automatic Workload Repository) snapshots on a regular basis, locates root causes of any performance problems, provides recommendations for correcting the problems, and identifies non-problem areas of the system. Because AWR is a repository of historical performance data, ADDM can analyze performance issues after the event, often saving time and resources in reproducing a problem.
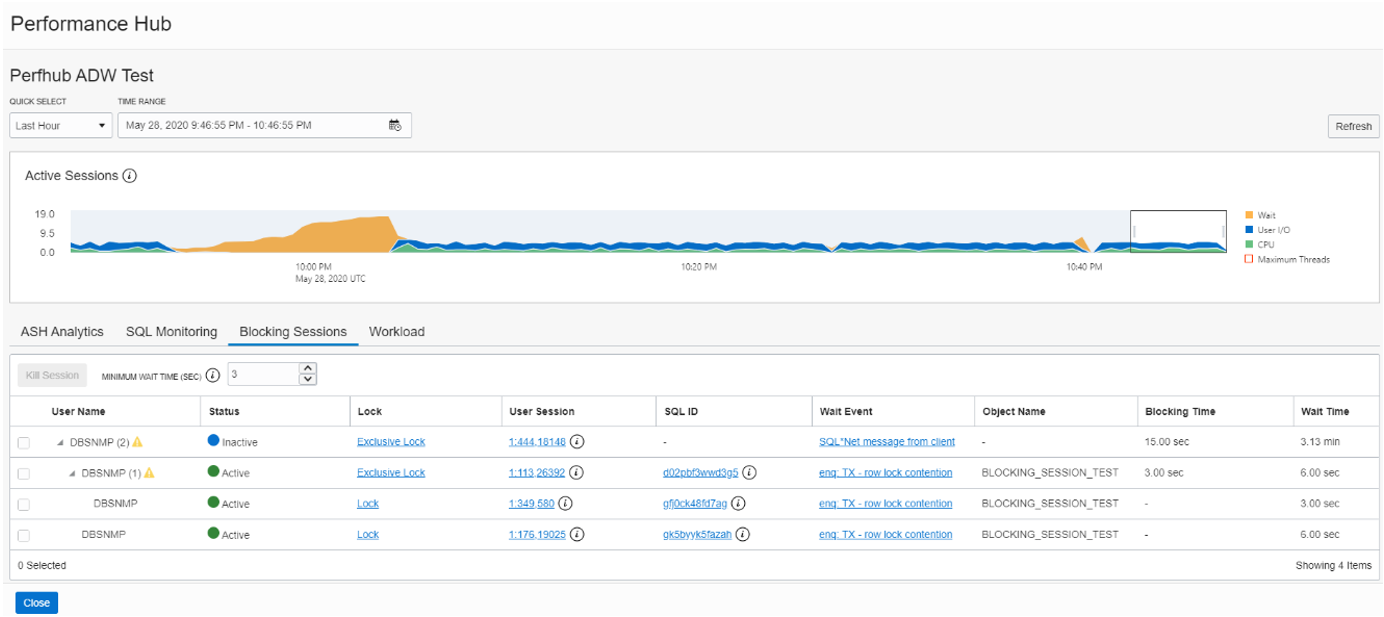
Lastly, the Blocking Sessions tab provides in-depth application wait analysis by displaying the current blocking and waiting sessions in a hierarchical manner and providing detailed information about each blocking session. It allows you to inspect or drill down into the SQL involved to determine the cause of the blocking, and perform kill operations on one or more of the listed sessions to resolve a waiting session problem.
You can access the Performance Hub feature from the Autonomous Database Details page and from Database Actions. You can also go and check Lab 10 – Managing Database Performance in our Oracle Autonomous Database Dedicated for Developers and Database Users LiveLab for a detailed walk-through.
Database Actions Monitoring Pages
Oracle Database Actions (previously know as SQL Developer Web) is a web-based interface that uses Oracle REST Data Services to provide development, data studio, administration and monitoring features for Oracle Autonomous Database. It provides many database development, management, and monitoring features and is built into ADB-D. Therefore, you can use it without downloading or installing additional software.
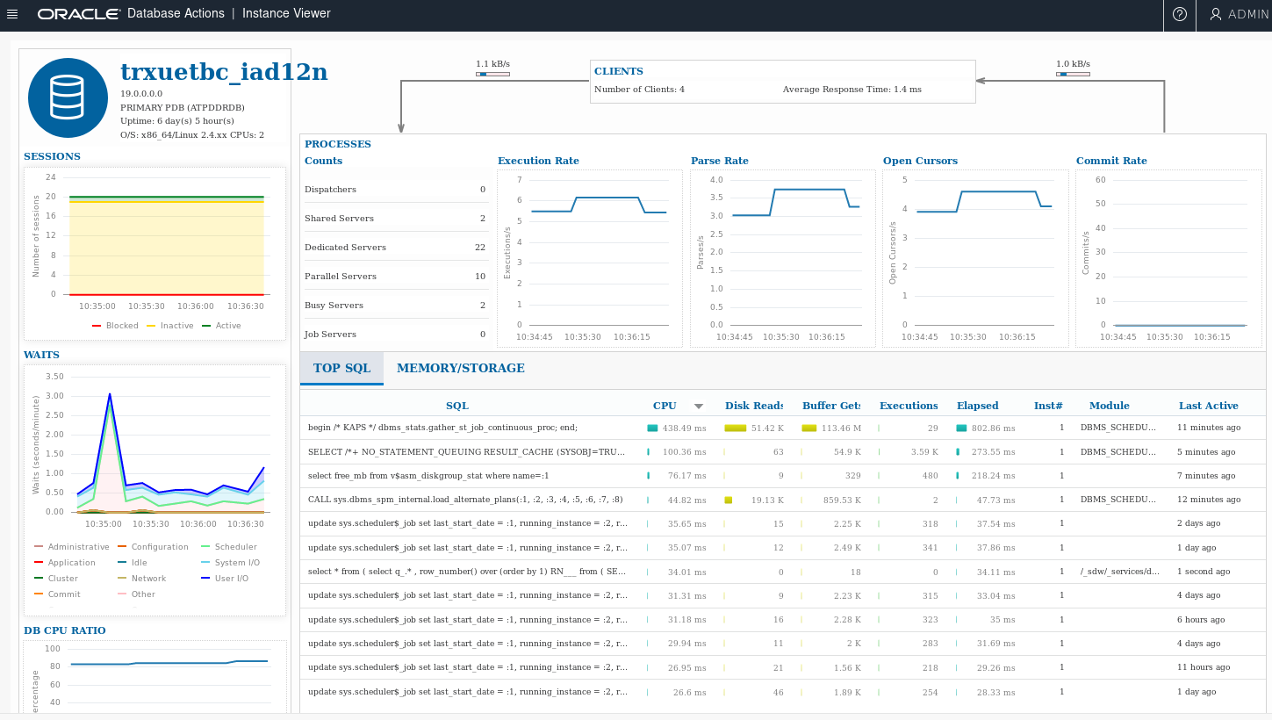
Database Actions Monitoring Pages provide a full set of observability tools for Autonomous Database including:
- Instance overview: shows database status, online database storage, sessions, wait events, user accounts, alerts, and expiring passwords
- Performance Hub Instance Viewer: performance dashboard that enables a DBA user to see a graphical representation of information about the instance
- Logins: shows the number of successful logins, failed logins, timed-out logoffs, and logoffs that have occurred within the last hour
- Alerts: a chronological log of messages and errors (aka Alert log)
- Sessions: currently open sessions in the database
- Storage: storage used based on the current allocation of tablespaces
- Top SQL: SQL statements executed in the database based on CPU time consumed
- Parameters: initialization parameters used to configure the database instance
Database Actions can be launched directly from your Autonomous Database instance page in OCI. For a “try it out” alternative that demonstrates Database Actions Monitoring Pages, run Lab 7: Database Actions Console in the Oracle Autonomous Database Dedicated for Developers and Database Users Workshop.
Finally, let’s take a brief look at fleet-wide and infrastructure-wide Oracle products and services for Observability and Management, namely those services impacting ADB that are part of the Oracle Observability and Management Platform.
Oracle Cloud Observability and Management Platform
Oracle Cloud Observability and Management Platform is a comprehensive, public cloud, hybrid cloud, and multi-cloud observability offering by Oracle that allows you to monitor, analyze, and manage multicloud applications and infrastructure environments with full-stack visibility, prebuilt analytics, and automation. There are multiple services in the platform that target the whole database observability cycle. The most relevant services of the platform for database observability are:
- Database Management Service: a unified console for on-premises and cloud databases with lifecycle database management capabilities for monitoring, performance management, tuning, and administration
- Operations Insights Service: allows you to predict and plan for future demand, eliminate systemic issues using advanced analytics on curated telemetry and long-term data
- Logging Analytics Service: enables proactive, repeatable, and automated problem detection and monitoring in business context
If you want to take a peek at how you can work with the platform observing Autonomous Databases you can try out the Oracle Cloud Infrastructure (OCI) Database Management Service LiveLab.
For observability and managment setups that are not cloud-native but still need to monitor cloud assets (such as Autonomous Databases) the Oracle Cloud Observability and Management platform still offers Oracle Enterprise Manager (EM or OEM). EM is Oracle’s on-premise management platform that provides a single dashboard to manage all Oracle deployments, in data centers or in the cloud. EM gives customers the ability to:
- Monitor and respond to performance and configuration related alerts
- Manage users, schema, roles, space, etc
- Diagnose and improve application-level SQL logic
- Do lifecycle operations like service instantiation, termination, scale-up/down etc., orchestrated via cloud-native APIs
Many of our customers were already EM users observing on-premise Oracle database fleets and are now also using it to do seamless, fleet-wide management of Autonomous Databases with Oracle Enterprise Manager 13c. EM is allowing DBAs to transfer their knowledge and tooling know-how to efficiently manage cloud and on-premises environments encompassing Oracle Database, Oracle Engineered Systems, Oracle Middleware, Oracle Apps and Oracle Cloud. A specific Database Plug-In allows customers to apply their Oracle Enterprise Manager skillset to the Autonomous Database on Dedicated Exadata infrastructure and Cloud@Customer portion of their fleet. While Autonomous Database eliminates the work associated with most DB management tasks, customers can leverage the best diagnostic and lifecycle capabilities from EM to have complete control over the customer-managed portion of their Autonomous experience.
If you’re interested in using Oracle Enterprise Manager with Autonomous Database on Dedicated Exadata Infrastructure and Cloud@Customer (ADB-D) please check out Lab 12: Deploy OEM and connect ADB to OEM in our Oracle Autonomous Database Dedicated for Fleet Administrators LiveLab and also this recorded demo.
Conclusion
It’s still perceived as a big leap for companies to move from on-premise to cloud-native database services because there’s the perception of having less control and limited observability if the databases are not in-house (especially with services that heavily rely on automation and machine-learning to simplify management). Autonomous Database on Dedicated Exadata Infrastructure and Cloud@Customer gives you the best of both worlds today: the ability to run natively in the cloud (OCI) or on-premises (Cloud@Customer) while providing deep levels of observability (at the database instance, fleet and data plane levels) via a rich set of Oracle tools and services that cover the whole database observability cycle. This is particularly useful (and practically mandatory) for companies with governance and/or regulatory requirements that require high scrutiny of database assets and can’t accommodate cloud services that act as black boxes.
Stay tuned for Part 2 where we’ll cover third party, industry standard open-source technologies such as Kubernetes, Prometheus and Grafana that can also help your technical teams (e.g. developers and DBAs) with Autonomous Database observability.
