Geo-referenced raster data, including satellite imagery, aerial photos from drones, and gridded data, is very useful for mapping applications. It can be directly analyzed, or layered with vector data as a background map for additional context.
GeoRaster data stored in spatial GeoRaster type in Oracle Database can now be accessed and visualized in Spatial Studio. When creating a new Dataset, you will see a new type of “base table” in a database schema labeled as “GeoRaster”.
Note that in this release, raster algebra or raster analysis operations are not supported.
Details on the GeoRaster feature in Oracle Database can be found here.
Follow these steps to visualize your GeoRaster data.
Step 1: Create a GeoRaster Dataset
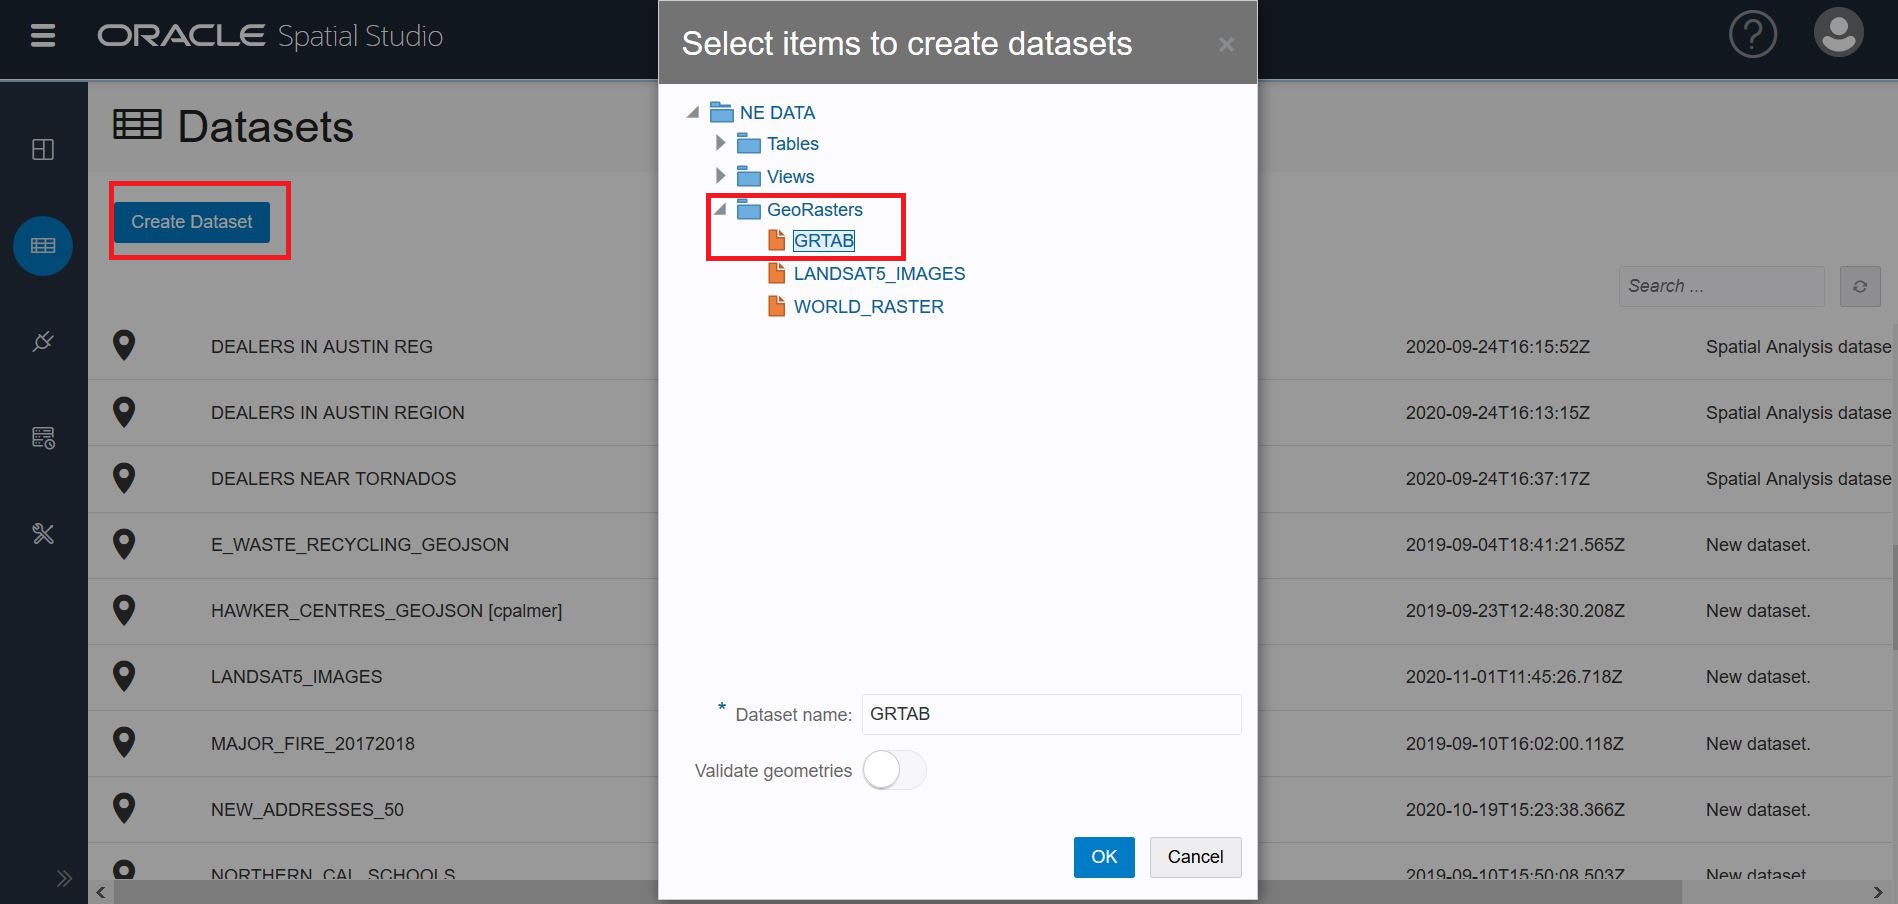
Click on the Create Dataset button and choose the GeoRaster data you want to visualize. You have 2 options: changing the name of your Dataset and validating its geometries.
In the screenshot below, “GRTAB” is chosen.
Step 2: GeoRaster Configuration
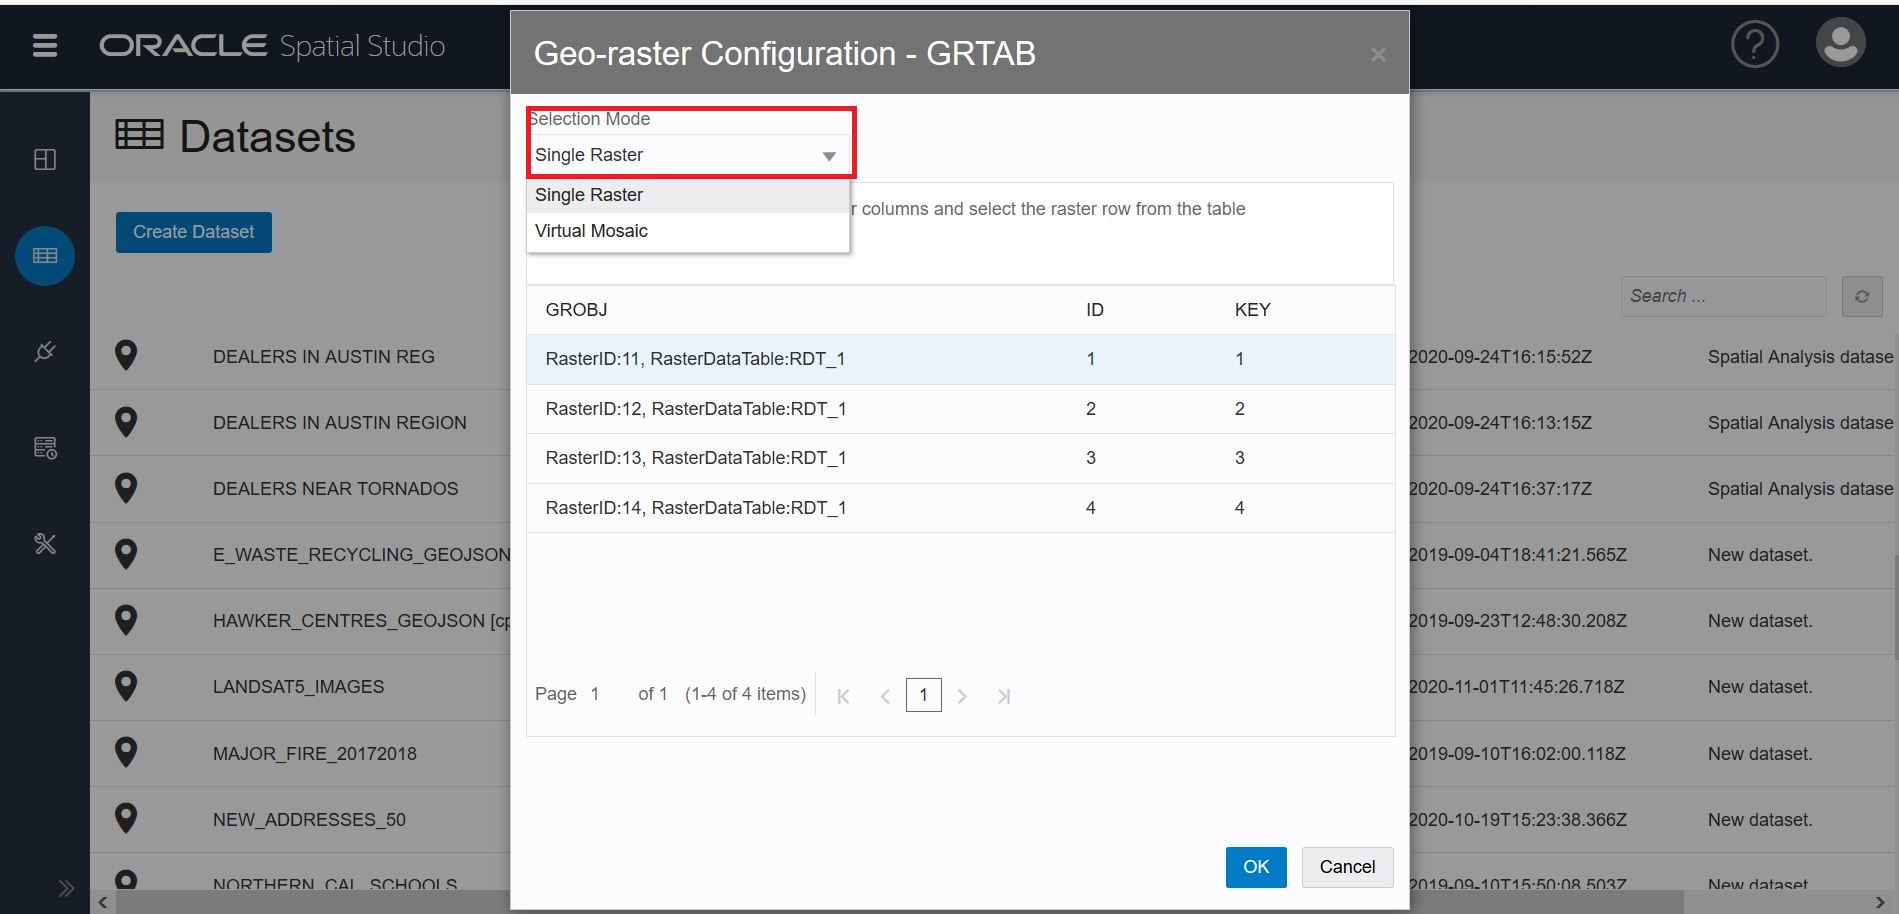
In the next dialog, Pick a Selection Mode: Single Raster or Virtual Mosaic. For this blog, we chose Single Raster visualization.
For Single Raster, Click the box: “choose one of the available GeoRaster columns and select the raster row from the table.” Then click the raster row you want to visualize. (Note that if you chose Virtual Mosaic, all the GeoRaster columns would be included in the visualization.)
In the screenshot below, RasterID:11 is the image we want to visualize. Click OK.
Step 3: Create Project
From your GeoRaster Dataset on the Datasets page, right click to Create Project. Your Dataset (GRTAB in the screenshot below) is now listed in the Data Elements panel. Create a layer by dragging your Dataset onto the map.
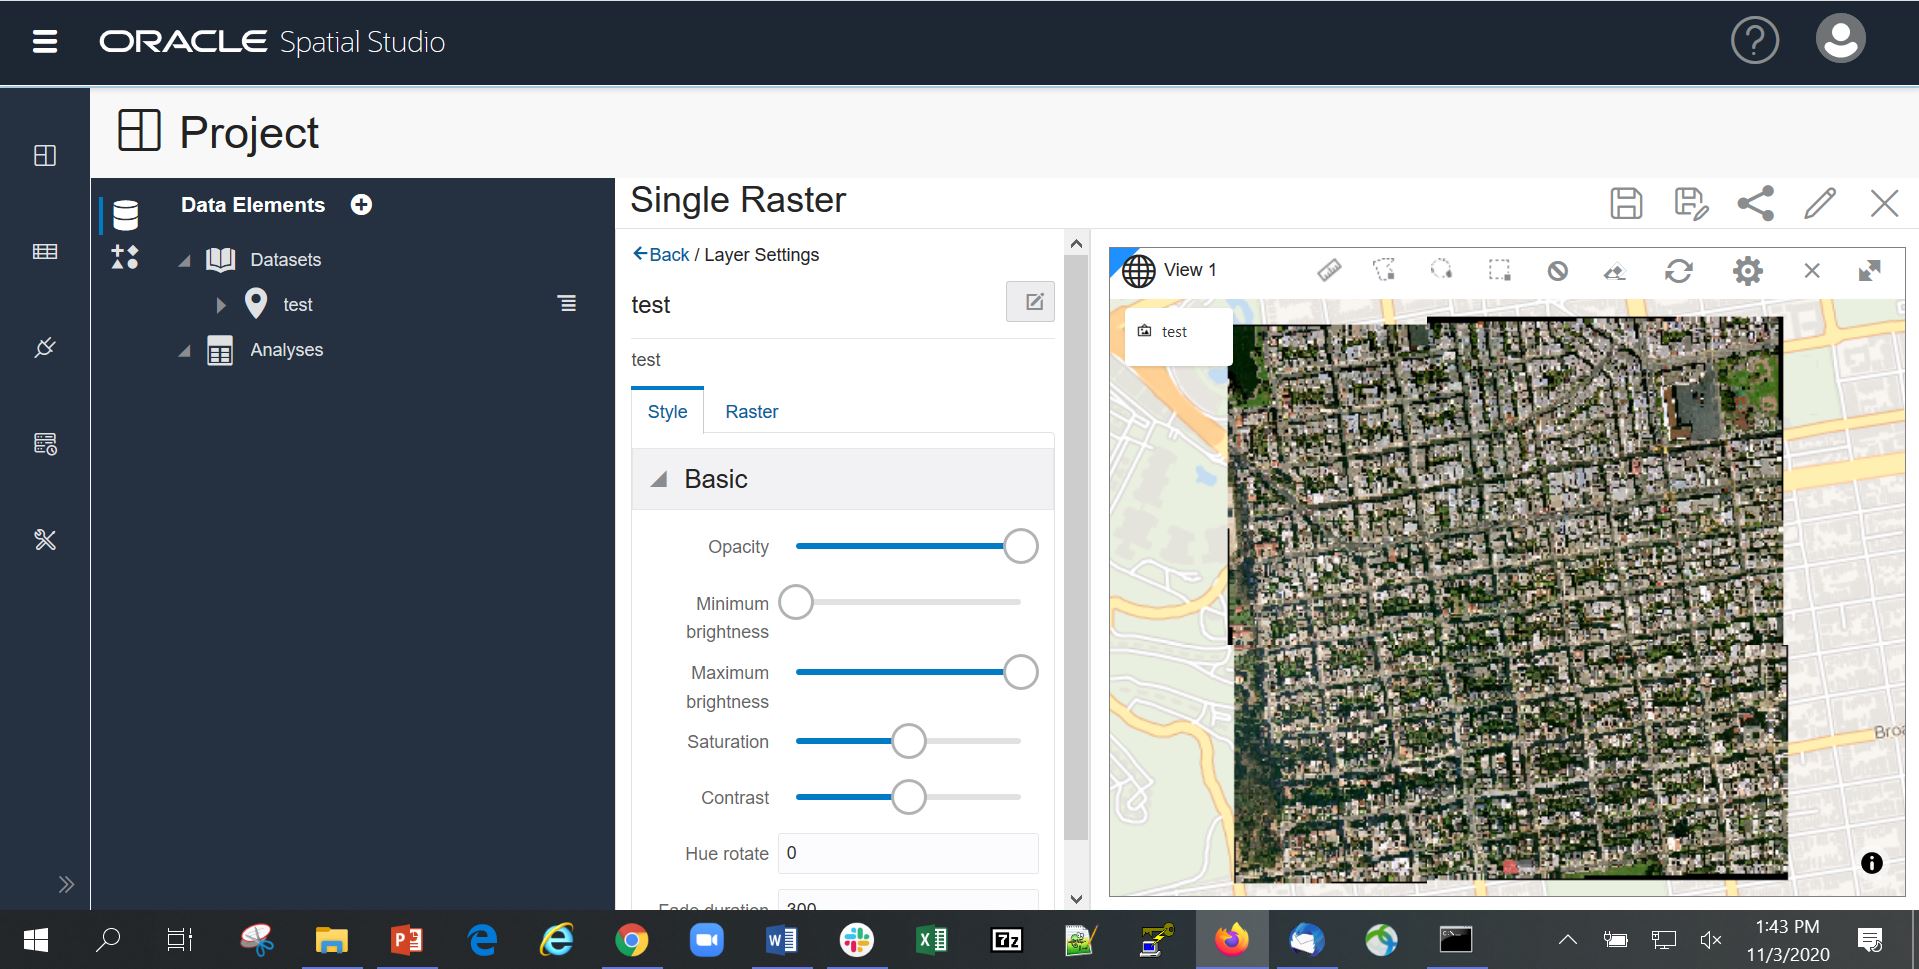
Go to Layer Settings. The Style tab has 6 options to choose from: opacity, brightness, saturation, contrast, hue rotate, and fade duration.
Grid interpolation is a method for interpolating cell values at point positions between the cells or within the cells.
GeoRaster supports the following standard resampling and interpolation methods:
- Nearest neighbor (NN)
- Bilinear interpolation using 4 neighboring cells (BILINEAR)
- Biquadratic interpolation using 9 neighboring cells (BIQUADRATIC)
- Cubic convolution using 16 neighboring cells (CUBIC)
- Average using 4 neighboring cells (AVERAGE4)
- Average using 16 neighboring cells (AVERAGE16)
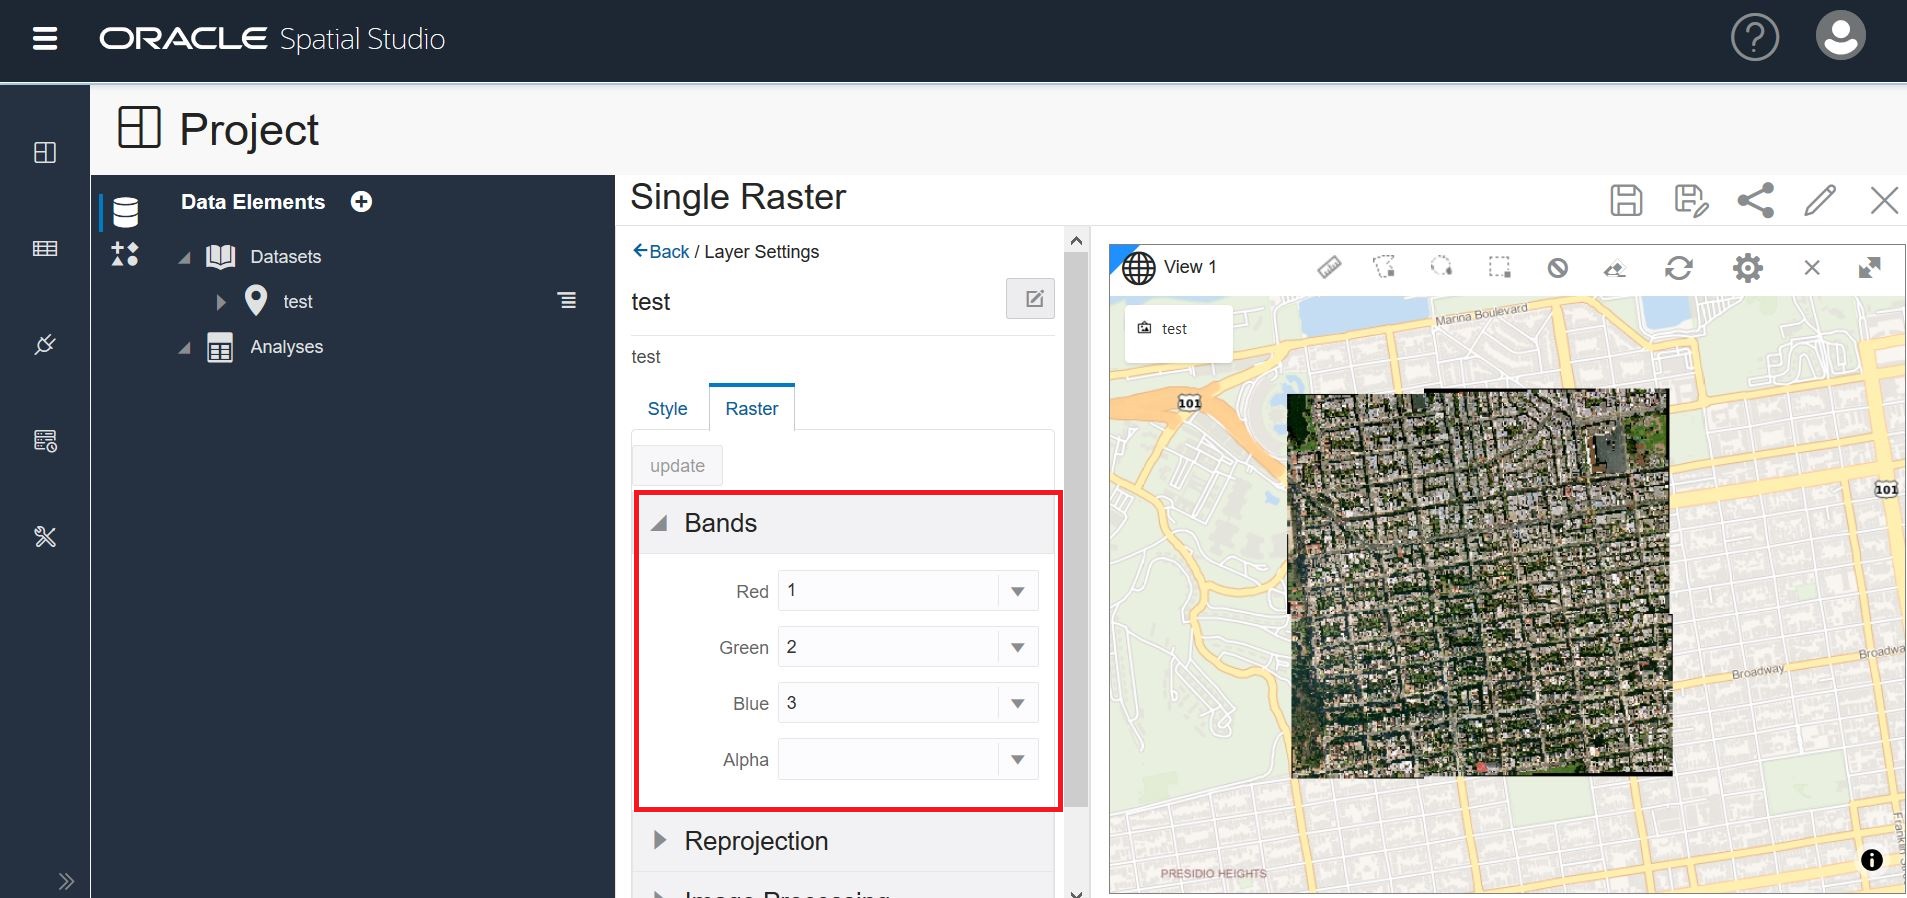
The Raster tab has 4 rendering options to enhance your visual display.
Bands: There are 4 bands: Red, Green, Blue, and Alpha. Some GeoRaster images have more than three layers. You can choose which three layers you want to visualize. If you assign the same GeoRaster Layer to Image bands Red, Green, and Blue, a gray scale image will The following screenshot shows the Raster tab with the remaining selections.be generated.
The following screenshot shows the Raster tab with Bands selection.
The following screenshot shows the Raster tab with the remaining selections.
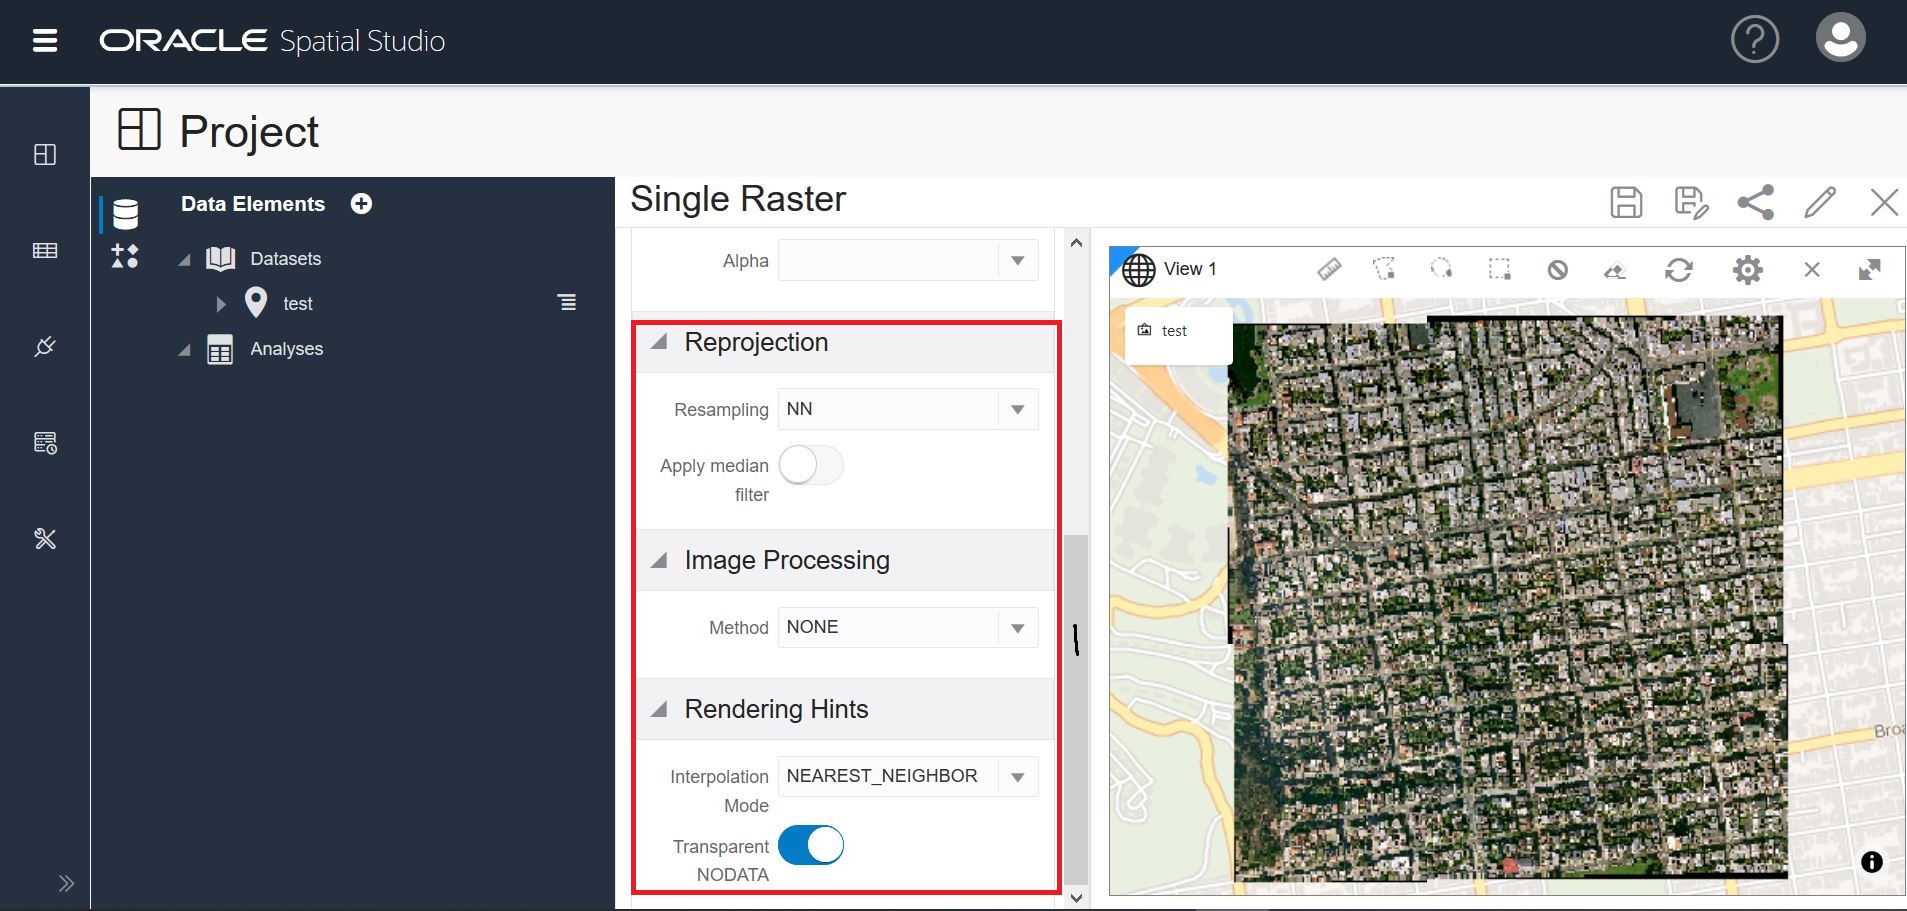
Reprojection: Image reprojection is the process of transforming an image from one SRS (spatial reference system, or coordinate system) to another. You can choose one of the 5 interpolation methods while reprojecting rasters: Bilinear, NN, Cubic, Average4, and Average16. Image filtering is the process of applying a convolution filter on an image to achieve a specific purpose.
For example, applying a low-pass filter on an image can smooth and reduce noise in an image, while applying a high-pass filter on an image can enhance the details of the image or even detect the edges inside the image.
Image Processing Methods: The color and contrast of images can be enhanced to improve their visual quality. GeoRaster provides a set of subprograms for image enhancement, including performing image stretching, image normalization, image equalization, histogram matching, and image dodging.
Linear stretching and piecewise stretching can stretch the image cell values linearly for all cell values based on the minimum and maximum cell values or at specified value range, to achieve better color and contrast. Image normalization linearly stretches the image based on the statistics (mean and standard deviation) of the image cell values.
Image equalization enhances mage contrast by equalizing its histogram. Image histogram matching stretches the image to match the specified histogram or the histogram of a reference image. Image dodging balances image color by stretching the contrast of the image locally instead of globally.
GeoRaster layers provide a rich backdrop for your point, line, and polygon layers in Spatial Studio. We hope this introduction gives you a starting point to try this new feature. Download Spatial Studio here.