Today, data is everywhere–in databases, in object stores, or on file systems, from streaming sources, historical data at rest, and more. Hidden in all this data are answers to challenging questions—for example:
- Tracking down logistical bottlenecks in the supply chain
- Finding product-component dependencies in manufacturing processes
- Following the flow of money in a financial system to discover unusual patterns that might be fraud
- Connecting clickstream activity to product purchases for better product recommendations
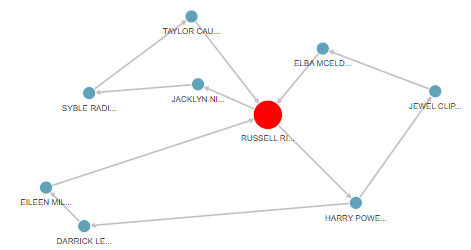
Graph analytics help answer these complex questions, by enabling developers to navigate relationships in data that are not otherwise immediately obvious. In Figure 1, graph queries highlight a specific pattern of a cycle, which could indicate potential fraud (i.e., money moving in a cycle) in financial services.
As these examples show, teams can move beyond traditional analysis to discover patterns, dependencies, and hidden relationships across interconnected data through graph analytics.
Graph Analytics and the Data Lake
Given the power of graph analytics, you may consider expanding the scope of the data for your analysis—such as external data residing in a data lake—and question how easy it is to use graph analytics with it. A data lake, by definition, stores data from different sources in a variety of formats, which suggests that you need different tools and languages. Different tools and multiple languages mean complexity as JSON data, CSV log files, location data, and vector search will all require special-purpose APIs and tools. As a result, developers would spend more time integrating different components in this “traditional” data lake and less time innovating and developing their application. So, you may think that running any type of analytics, let alone graph analytics, is a difficult and complex thing to do.
Thanks to new innovations in Oracle Autonomous AI Database that were just announced, it’s now possible to embrace the simplicity of a unified environment—even as your data lake grows more diverse and complex. Importantly, you can bring together the scalability of cloud object storage and open table formats like Apache Iceberg with fast, deep graph analytics—all inside Oracle Autonomous AI Database:
- Use all types of data: With Autonomous AI Database, you can use the power of SQL to analyze practically any and all types of data, from many different data sources. Instead of working with a variety of niche and siloed specialty technologies for different data types and data formats in a “traditional” data lake, you can use one language – SQL – for many kinds of analytics on many types of data. You can unify and integrate all your analytics with Autonomous AI Database, giving AI applications all the data they need.
- Property graph made easy: The simplicity of SQL extends to graph analytics, which traditionally required a special-purpose graph query language. The latest SQL standard publication (SQL:2023) includes new syntax for creating and querying property graphs, enabling advanced graph analytics on any data accessible with SQL. This ability to use standardized SQL with graphs puts graph analytics into the hands of SQL developers, transforming graph analysis from a niche toolset to a widely accessible capability that can be integrated into practically any application workflow. Oracle AI Database was the first commercial database to implement this new graph syntax.
- Simplify external data access: Autonomous AI Database, a fully managed Oracle AI Database cloud service, enables practically any external data source to be viewed through the abstraction of a table and accessed with SQL. And any data accessible through SQL can be analyzed as a graph, wherever it is stored (like database tables or object store) in whatever format (like Apache Iceberg or JSON). This means you can connect, query, and analyze object store data—including Iceberg tables—directly, unlocking hidden relationships and patterns across massive volumes of data without moving or duplicating it.
- Powerful pre-built algorithms: Autonomous AI Database integrates Graph Server, enabling complex graph algorithms to run in parallel at high speed with patented technology. With the Graph Server, standard graph algorithms and graph machine learning algorithms are available to analyze graphs. Graph machine learning algorithms can create models and use them to find matching patterns and make predictions—for example, “Which customers have similar browsing and buying patterns, and can that help us predict future purchases by a customer?” Developers can perform this type of prediction by accessing over 80 pre-built algorithms with Python or Java API in an integrated notebook or in a client application.
Answering Complex Questions Using Simple Graph Queries with Iceberg Data
Using a data platform like Autonomous AI Database, you can perform graph analytics by combining data in an external location with transaction data in the database, using simple SQL syntax. Here we combine clickstream data and product purchase transaction data in one graph (see Figure 2), making questions such as “How many clicks did a customer use to navigate to a product, and what is the impact on whether they buy the product?” easy to answer.
A graph models data as vertices (also known as nodes; all the circles in Figure 2) and edges (also known as relationships; lines in Figure 2). Vertices represent entities or ‘things’ in data, and edges represent how they are connected. For example, when tracking customer journeys during online shopping, each webpage is modeled as a vertex and navigation by a customer from one page to another is modeled as an edge. For transaction data, each customer and each product is modeled as a vertex, and a customer buying a product is modeled as an edge between them.
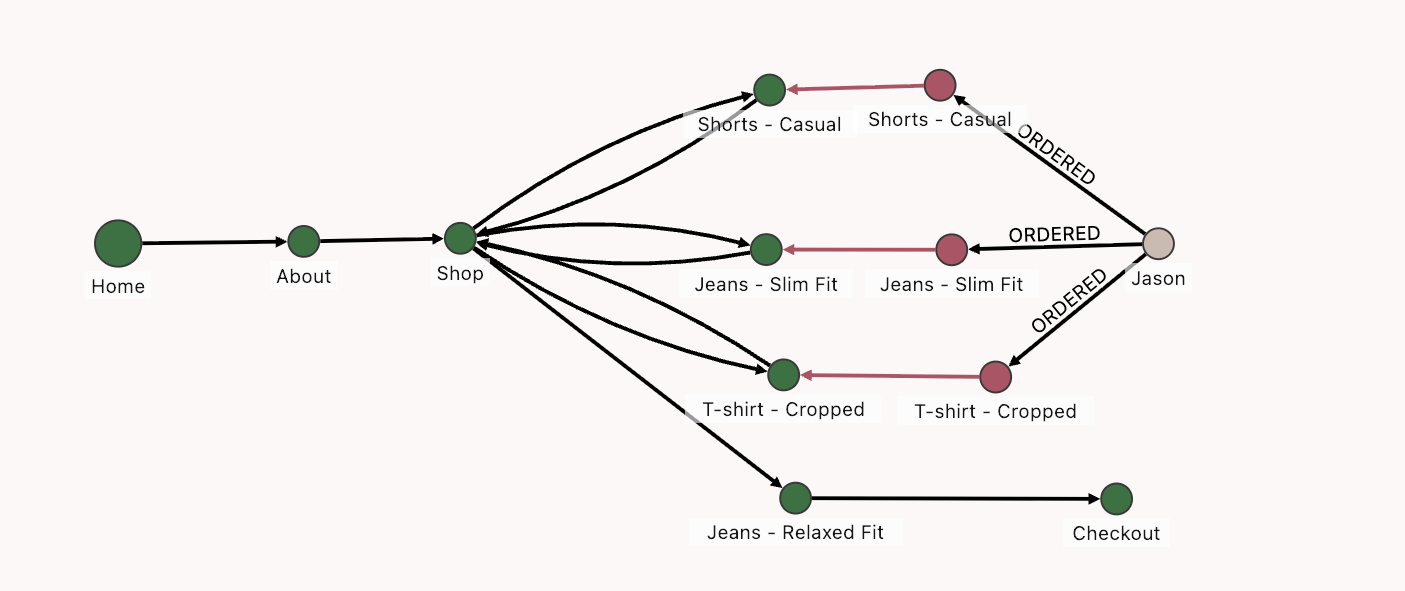
with transaction data in the database (pink nodes)
By leveraging graph analytics directly on data in object store formats like Apache Iceberg, you can extract new insights from vast and previously siloed data sources. For example, as shown above, you can track customer journeys during online shopping and link them with transaction data in the database. In online shopping, a customer’s decision to purchase goes through a digital path of browsing, checking user comments, comparing products, saving a product in a digital shopping cart, and so on. You can link activity from web logs and app interactions in a data lake with customer purchases that are stored in the database, for new and improved insights on customer purchase patterns. You can understand relationships between customer browsing patterns and their decisions to buy.
There are many other applicable use cases for running graph analytics with data lakes, including:
- Cybersecurity: Graphs help detect cyberattacks by discovering anomalous patterns in how network packets move in an IT network, finding the repeated occurrences of the matched pattern, thus catching a threat before an attack. The source data for this analysis is in log files that capture network traffic, semi-structured data like JSON, and event triggers.
- Supply chain optimization: Supply chains consist of managing constraints between suppliers, shipments, warehouses and delivery companies, which together form a complex network. Potential disruptions and delays are identified by analyzing shipment records, supplier dependencies, raw material constraints, and more. The source data comes from different sources that have to be identified, linked, and tracked.
Many different data types can be integrated in such a graph. Vector embeddings of unstructured text such as customer reviews of a product can be a property of a vertex or edge, and key-value pairs represented in JSON, such as product descriptions, can be accessed and represented in the graph. A question such as: “What product descriptions match what customers with short browsing journeys have bought?” might indicate that customers know what they want when shopping for these products, and so similar products might sell well too.
Enterprise-scale Performance and Security
When you are running graph queries in Autonomous AI Database, you can take advantage of its scalability features to scale the performance of complex multi-hop queries as data size grows. Mature performance features like partition pruning and hybrid columnar compression, as well as Autonomous AI Database Data Lake Accelerator, are just some of the key features that enable powerful query performance and scalability.
In addition, the retrieval of data using such graph queries can be governed by sophisticated built-in security policies of Autonomous AI Database. As a native feature of the database, all security access policies are available for use.
Conclusion
With Autonomous AI Database and Oracle Graph, your organization can harness the power of graph analytics on all your data—including large-scale Iceberg tables in object storage—to uncover connections, patterns, and opportunities that were previously hidden. Simple, standardized SQL provides access for developers, enabling your organization to integrate graph analysis into your application and analytic workflows to drive breakthrough business insight.
We’d love to hear from you – Please discuss your experiences, post ideas, or ask questions on the public Oracle Database Discussions forum. Try our LiveLab: Explore Operational Property Graphs.
For more information:
- Explore: Oracle Graph product page
- Explore: Oracle Autonomous AI Lakehouse
- Read:
- Oracle Graph documentation: Using Oracle Graph with Autonomous AI Database
- Oracle Graph blogs
- Try: Autonomous AI Database for free