
No agent. No function. No compute instance. Just a SELECT and a scheduler job.
Autonomous AI Database gives you more than forty metrics in OCI Monitoring out of the box: CPU, sessions, storage, IOPS, latency, availability. They’re good metrics, and I lean on them constantly. But every customer engagement I’ve been part of eventually reaches the same moment — someone asks a question the platform metrics can’t answer.
Is our order backlog growing? Did that deployment leave invalid objects behind? Is the connection pool our REST tier depends on actually healthy?
Those signals are already inside the database. They’re one SELECT away. They’re just not in the oci_autonomous_database namespace, and there’s no obvious way to get them there without deploying an exporter, a collector, or some other piece of infrastructure you now have to run and patch.
So I built DBMS_METRIC: an unofficial PL/SQL package that lets you register a SQL statement and have its results published to OCI Monitoring as a custom metric, as often as every 60 seconds, from inside the database. This post walks through how it works, and the handful of things about OCI Monitoring you need to get right before you build on it.
Everything here runs on Autonomous AI Database — Dedicated (26ai), the same script also runs on Serverless, and the full scripts are linked at the end.
The contract: one column named VALUE
The whole customer-facing design is a single convention:
Your SQL must return a column named
VALUE— that’s the number OCI stores. It may return a column namedTS— that’s the timestamp of the datapoint. Every other column becomes an OCI dimension.
That’s it. No label list to declare, no PL/SQL to write, no format to learn. Register a metric like this:
BEGIN
  dbms_metric.add_metric(
    p_metric_name => 'orders_by_status',
    p_source_sql  => q'[SELECT status, COUNT(*) AS value
                        FROM app.orders GROUP BY status]',
    p_unit        => 'count',
    p_description => 'Open orders by status');
END;
/
On the next scheduler tick — at most 60 seconds — orders_by_status starts flowing into OCI Monitoring, dimensioned by status, chartable in Metrics Explorer, and ready to alarm on. No recompile, no restart, no redeploy.
The package works this out at runtime with DBMS_SQL.DESCRIBE_COLUMNS, so the registry is just a table of SQL statements. Adding a metric is a row, not a code change.
How it fits together
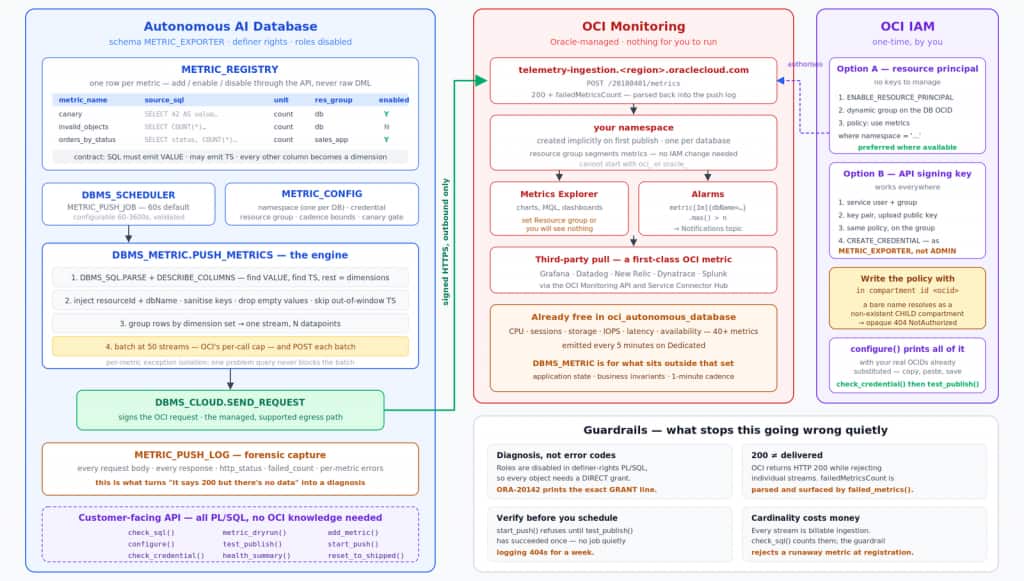
The pieces worth calling out:
DBMS_CLOUD.SEND_REQUEST does the signing. OCI’s metrics API requires a signed request, and implementing Signature v1 in PL/SQL would have been most of the work. DBMS_CLOUD handles it — you hand it a credential and it signs. That single built-in is why this is roughly 200 lines of real logic instead of two thousand. It’s also the right choice on Autonomous AI Database generally: DBMS_CLOUD is the managed, supported way to make outbound calls, it authenticates against OCI services natively, and it needs no network ACL wrangling to reach them.
The database already knows who it is. V$PDBS.CLOUD_IDENTITY returns the region, compartment OCID, database OCID and database name as JSON. The exporter reads them at runtime, so nothing is hardcoded and the same script installs unchanged in any tenancy or region.
It’s push, not scrape. The database opens the connection itself — outbound to OCI Monitoring, which stays in your own region and compartment, under your own IAM. Your telemetry never goes to a third-party SaaS endpoint, there’s no vendor account holding your data, and the only credential involved is an OCI identity you already control. There’s also nothing to expose on the way in: no endpoint to secure, no listener, no inbound rule. And because the push starts inside the database rather than arriving through the components in front of it, it keeps reporting when the application tier, the REST layer, or the network path a scraper would have used is the thing that’s broken.
Resource groups give you a free segmentation axis. Each metric can carry a resource group — sales_app, db_health, batch — and you filter on it when reading, charting or alarming. It costs nothing and, unlike a second namespace, it needs no IAM change: the publish policy is scoped to the namespace, so you can reorganise how metrics are grouped without touching a policy. It’s the right place to separate application metrics from database ones.
resourceId and dbName are injected on every metric. resourceId is the database’s own OCID, which is what lets you put your custom metric on the same dashboard as the platform metrics for that database. dbName is what you’ll scope alarms by.
You choose the cadence, down to 60 seconds. Platform metrics on Dedicated are published at five-minute resolution, which suits capacity planning and trend analysis. Fast fault detection wants finer resolution: a metric you publish yourself at 60-second cadence supports a one-minute alarm — which, for fault detection, is most of the value.
All of that machinery exists to produce one call, and this is it in full — no wrapper, no helper library, no retry framework:
l_uri := 'https://telemetry-ingestion.' || l_region ||
         '.oraclecloud.com/20180401/metrics';

l_resp := DBMS_CLOUD.SEND_REQUEST(
            credential_name => l_cred,
            uri             => l_uri,
            method          => DBMS_CLOUD.METHOD_POST,
            headers         => JSON_OBJECT('Content-Type' VALUE 'application/json'),
            body            => l_blob);

l_status := DBMS_CLOUD.GET_RESPONSE_STATUS_CODE(l_resp);
l_text   := SUBSTR(DBMS_CLOUD.GET_RESPONSE_TEXT(l_resp), 1, 4000);
l_region comes from V$PDBS.CLOUD_IDENTITY, l_cred is the credential name from the config table, and l_blob is the PostMetricData document — a metricData array, one object per stream, converted from CLOB to UTF-8. Everything else in the package is about building that document correctly and knowing what came back.
Installing it: four steps
One. Run the script as ADMIN. It creates an unprivileged METRIC_EXPORTER schema, three tables, and the package.
Two. Choose your namespace — once, for the whole database:
BEGIN dbms_metric.configure(p_namespace => 'adbd_custom_metric'); END;
/
Namespace is per-database rather than per-metric on purpose. The IAM policy that authorises publishing is scoped to a namespace, so a per-metric namespace would mean editing IAM every time somebody adds a metric. When you want segmentation, use the per-metric resource group instead — it needs no IAM change at all.
configure then prints the complete IAM policy that you need to apply with your real OCIDs already substituted — database OCID, compartment OCID, both authentication options, and the read-side grants your ops team needs. Copy it into the console and save it. I carried this idea over from another project of mine called DBMS_PROMETHEUS, which exposes a Prometheus endpoint and prints a ready-to-paste prometheus.yml; there’s no reason to make people assemble OCIDs by hand when the database knows all of them.
Three. Create the signing credential: a DBMS_CLOUD.CREATE_CREDENTIAL with an API signing key, created as METRIC_EXPORTER. Where resource principal is enabled, it’s a single call with no keys to manage.
Four. Verify, then schedule:
SELECT dbms_metric.check_credential() FROM dual;   -- is my identity accepted?
SELECT dbms_metric.test_publish()     FROM dual;   -- can I publish to this namespace?
BEGIN dbms_metric.start_push(60); END;
/
Both checks return plain English, not status codes. And start_push refuses to arm the scheduler until test_publish has succeeded at least once. That guard came from imagining the alternative: a job quietly logging authorisation errors every 60 seconds for a week while everyone assumes monitoring is working.
Check your SQL before you register it
This is the command I’d most like people to use:
SELECT item, result FROM TABLE(dbms_metric.check_sql(
  q'[SELECT status, COUNT(*) AS value FROM app.orders GROUP BY status]'));
verdict parses OK in the exporter's own environment (roles disabled)
value column VALUE
timestamp column none - datapoints stamped at push time
dimensions (auto) resourceId, dbName, status
streams produced 4
rows skipped 0The verdict is authoritative, and that’s the point. check_sql parses your statement inside the package — with definer’s rights, where roles are disabled — which is exactly the environment the scheduler job will run it in. SQL that works fine in your own session can still raise an error there, and you want to know that now.
Which brings me to the trap that will catch almost everyone.
Roles don’t work here
Because the package runs with definer’s rights, every object your metric reads needs a direct grant to METRIC_EXPORTER. A grant through a role does nothing, no matter how many roles you pile on. A DBA who “fixes” a permission problem by granting a role sees no change and reasonably concludes the tool is broken.
So rather than stopping at a bare ORA-00942, the package tells you what to run:
ORA-20142: metric SQL references SYS.DBA_OBJECTS (VIEW), which METRIC_EXPORTER
cannot read.
  Ask the owner or ADMIN to run:
      GRANT SELECT ON SYS.DBA_OBJECTS TO METRIC_EXPORTER;
  A grant via a ROLE will NOT work - roles are disabled inside this package.
  It must be a direct grant.
On 26ai, ORA-00942 names the fully qualified, already-resolved object — so if you write v$session, the error says SYS.V_$SESSION, which is the name the grant actually needs. Write acd_v$sysmetric and it says C##CLOUD$SERVICE.ACD_V$SYSMETRIC, an owner you would otherwise have to go looking for. The resolved name is already in the error; the package just has to read it.
That error intentionally never distinguishes a missing object from one you can’t see — both return identical text, so an error message can’t be used to enumerate objects you have no rights to. To tell “run this grant” from “check your spelling”, the package asks a tiny ADMIN-owned lookup function one question about the one object named in the error: does OWNER.NAME exist, and what kind of object is it? It answers for that name only and supports no listing.
The same care applies to the package itself. Whoever can call add_metric can register SQL that runs with every direct grant METRIC_EXPORTER holds, so keep EXECUTE on DBMS_METRIC with ADMIN and your ops team.
Three things to understand before you build on this
HTTP 200 doesn’t mean your data landed. The package posts each batch as NON_ATOMIC, so the ingestion API accepts every valid stream even when one in the batch is malformed, and reports the rejected ones in failedMetricsCount in the response body. One bad stream never costs you the other 49 — but a client that only checks the status code would see success forever. DBMS_METRIC parses the body on every push and records the count in its push log; failed_metrics() and metric_errors() show you which metric was rejected and why. The same holds for any telemetry API that accepts batches: read the response body, always.
A gap in a series is ambiguous — design for it. “No data” and “no traffic” look identical in any metrics system, so don’t rely on absence to signal an issue. Publish an explicit 0 when there is nothing to count rather than letting a series vanish; a zero is unambiguous where a gap isn’t. And detecting that your exporter itself has stopped needs a watcher outside the publisher — a publisher can only report while it’s running. OCI Monitoring is that watcher: the canary always emits, so an absence alarm on it is unambiguous (there’s one below).
Cardinality is billable. A single API call is capped at 50 metric streams, and ingestion is charged per datapoint. A metric grouped by a column with 400 distinct values is 400 streams, every minute, forever — roughly 17 million datapoints a month from one metric on one database. The package batches automatically at the 50-stream cap, and check_sql reports the stream count so you see the number before you register — plus a guardrail (200 streams per metric by default) that rejects a runaway metric outright. Dimension by things with bounded cardinality: status, region, node, tier. Never by user ID or order ID.
What I deliberately didn’t ship
DBMS_METRIC comes with five built-in metrics, and only one is enabled: canary, which always reads 42 (guess why!), so you can prove the pipeline works end to end.
That’s a deliberate choice. It would have been easy to ship a dozen metrics covering sessions, CPU and storage — the sibling packages I’ve built for exporting to third-party observability platforms do exactly that, because those platforms have no other view of the database. Here it would be wrong: OCI already publishes those, free, and re-publishing them duplicates data you already have.
The other four ship disabled, and they cover things outside the platform metric set: invalid_objects, invalid_objects_by_owner, unusable_indexes and failed_scheduler_jobs_5m. Each is a single-table COUNT(*) against one DBA_ view, so you can verify it by running the same SELECT by hand and comparing the number to the chart.
Their views aren’t granted either — which makes enabling one a two-minute lesson in the grant model on a metric where a mistake costs nothing, before you try it on your own application tables.
The payoff
Once the metric is flowing, it’s an ordinary OCI metric. Here’s an alarm:
orders_by_status[1m]{dbName="MYDB01",status="PENDING"}.max() > 30And when it fires, the notification names the exact stream that breached:
"totalMetricsFiring": 1,
"dimensions": [{"status":"PENDING","dbName":"MYDB01", ...}],
"metricValues": [{"orders_by_status[1m]{...}.max()":"50.00"}]
That’s the practical argument for dimensions. An alarm that says “PENDING orders on MYDB01 are at 50” is actionable. One that says “orders are high” is not.
Three things I’d flag for anyone building alarms on custom metrics. First, set the alarm’s resource group. It’s a separate field from the query — the Resource group selector in the console, or --resource-group in the CLI — and DBMS_METRIC publishes under db unless you choose another. Omit it and the alarm matches nothing and stays silent forever, which is a miserable way to discover a configuration error. Second, use max() for count metrics, not mean(): the job pushes about once a minute, so two pushes can land in the same bucket and a mean will average a real spike into invisibility. Third, put an absence alarm on the canary, with the same resource group:
canary[1m]{dbName="MYDB01"}.absent()Because the canary always emits, a gap in it can only mean the exporter has stopped publishing — it’s the heartbeat for everything else you register.
Get the code
Everything is on GitHub — the full deployment script, a complete user guide covering IAM setup from scratch, and the architecture diagram:
The sample code, provided as-is and not covered by Oracle Support.
Install it as ADMIN, choose a namespace, create the signing credential, verify, and start pushing. On my instance the whole thing took under fifteen minutes.
The interesting question in database observability is rarely “is CPU high” — the platform answers that already. It’s “is the thing my application actually depends on working?” That answer usually lives in a view only the database can see. This is a small amount of PL/SQL to get it out as a metric.