
Interactive Reports in Oracle APEX give end users a rich set of capabilities: filtering, sorting, control breaks, highlighting, aggregations, charts, groupings, and pivots, all without touching the underlying application or its SQL. One report definition, built once by a developer, can be reshaped at runtime by many different users to fit their own needs; no new query, no new page, no waiting on development.
APEX 26.1 made all of that easier to reach by introducing AI Interactive Reports, a natural-language layer over the same underlying capabilities. Instead of navigating to a filter dialog, picking an operator, and selecting values, you could simply describe what you wanted, and APEX would interpret the request and convert it into standard Interactive Report settings: the same filters, sorts, and pivots you’d have built manually. Every applied setting shows up afterward as a visible chip, so you always know exactly what changed. Two entry points support this: Search with AI in the report’s search bar, and the Interactive Report Assistant for a more conversational, step-by-step flow. Either way, the Interactive Report itself stays the single source of truth. AI just configures it, faster than the menus would.
APEX 26.2 builds on that foundation in three ways:
- It modernizes the core Interactive Report interface.
- It introduces deterministic key phrases for fast, unambiguous commands.
- It extends AI Interactive Reports with natural-language computed columns.
Let’s look at each of these improvements and see how they make Interactive Reports easier and more powerful to use.
A more modern report interface
The modernization effort focuses on making existing functionality easier to find and use. The report interface receives refreshed styling, clearer layouts, improved spacing, more consistent controls, and better responsive behavior across screen sizes.
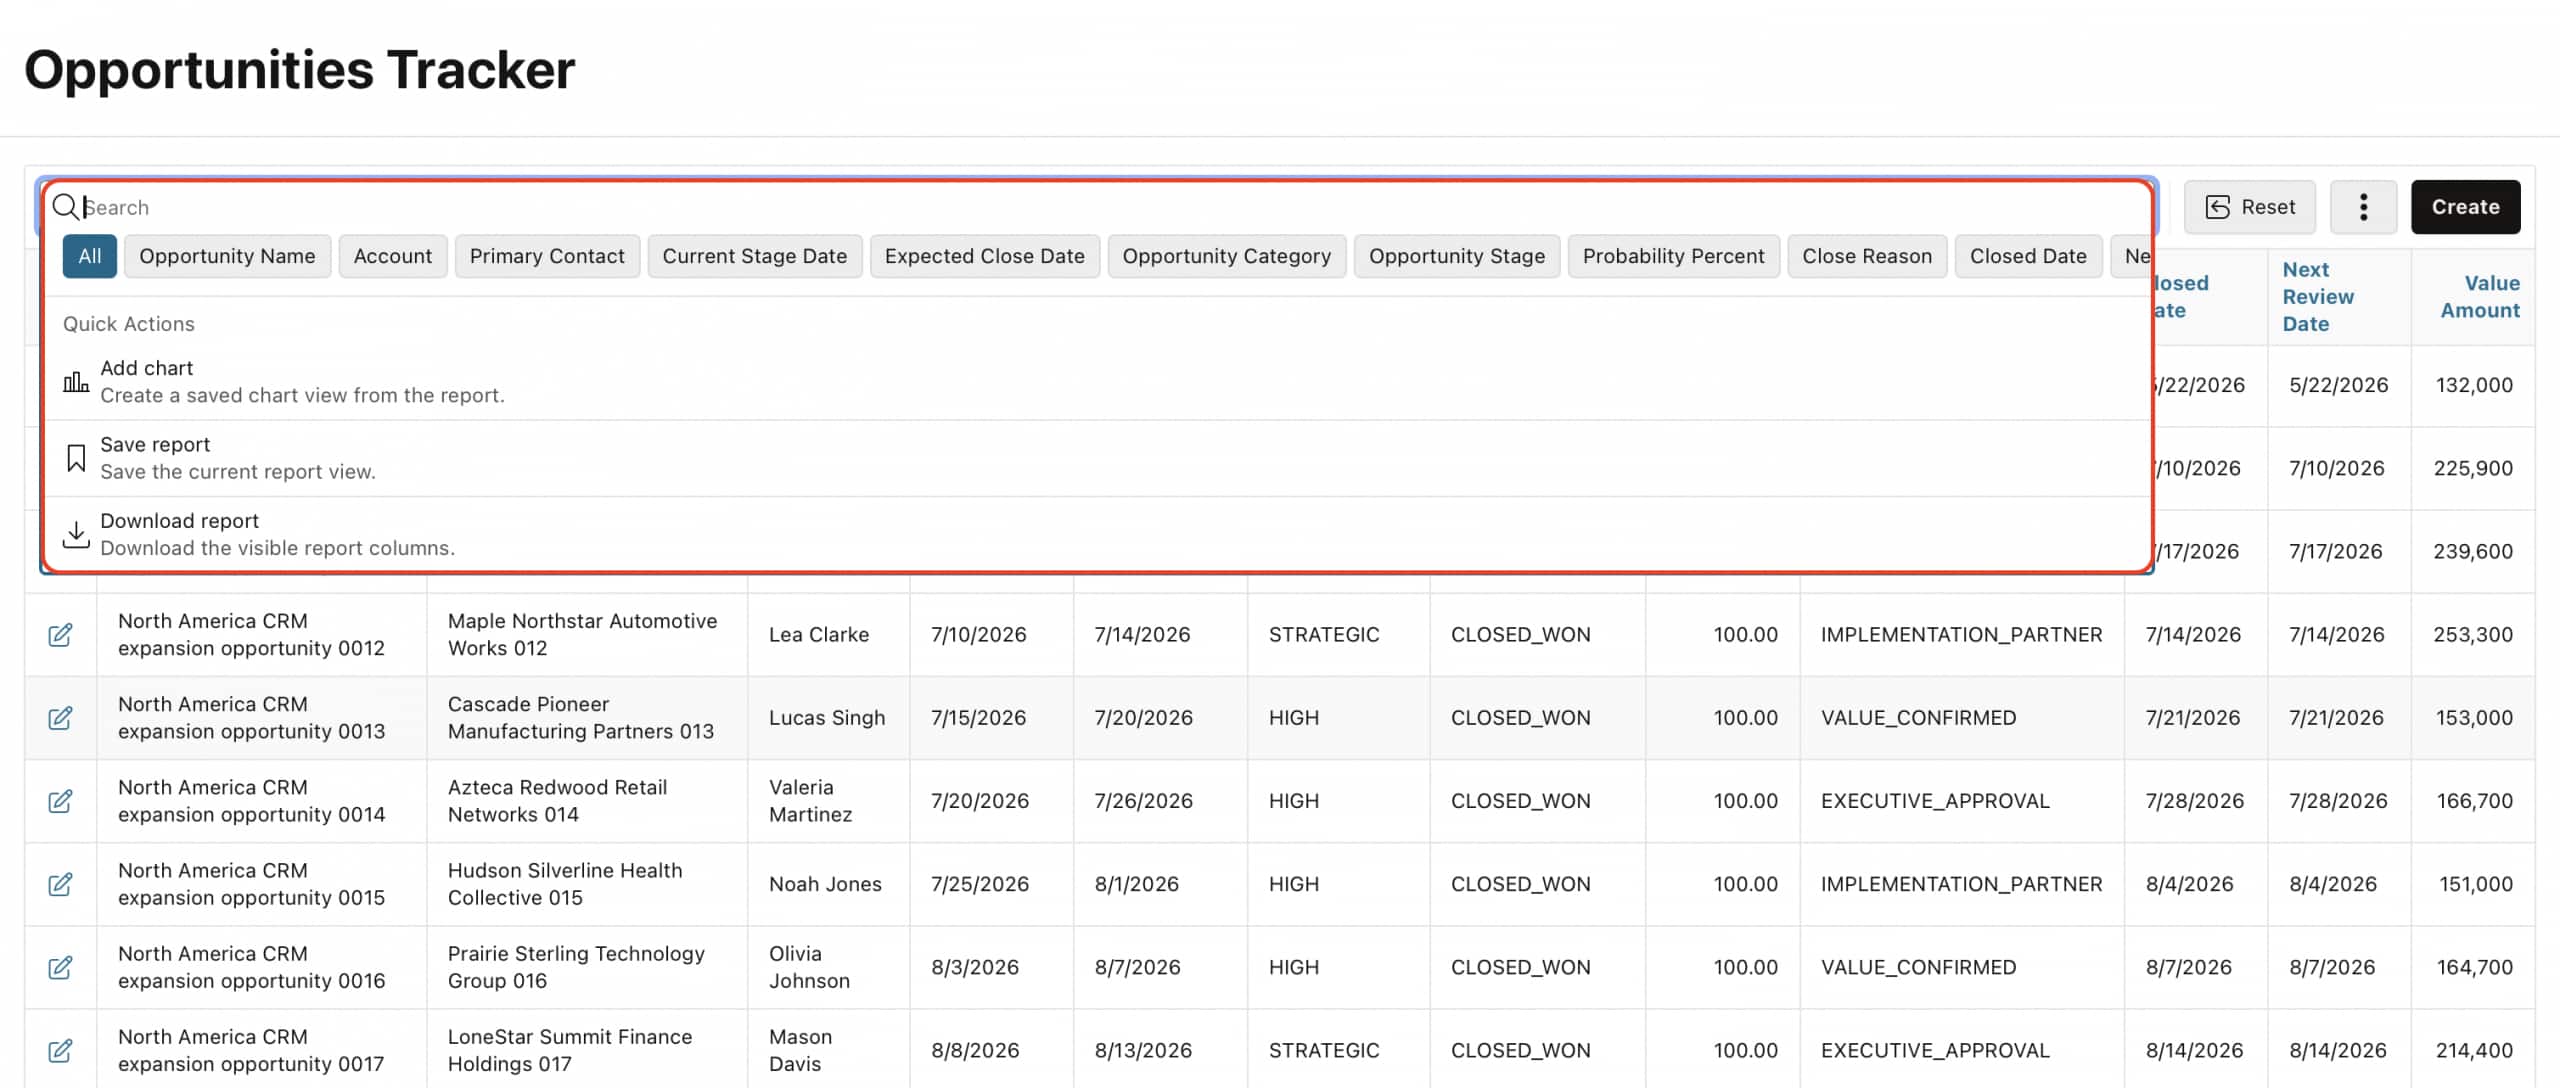
Search and filter chips
The search bar continues to support traditional row search while providing a clearer way to work with column-specific filters.
Active filters and report settings are surfaced as chips, making the current report state visible without requiring users to reopen multiple dialogs.
This improves transparency during analysis and presentations. Users can quickly understand which filters are active and how the report has been configured.
The chip-based experience also makes it easier to modify or remove individual filters without rebuilding the complete report configuration.
Multi-select header filters
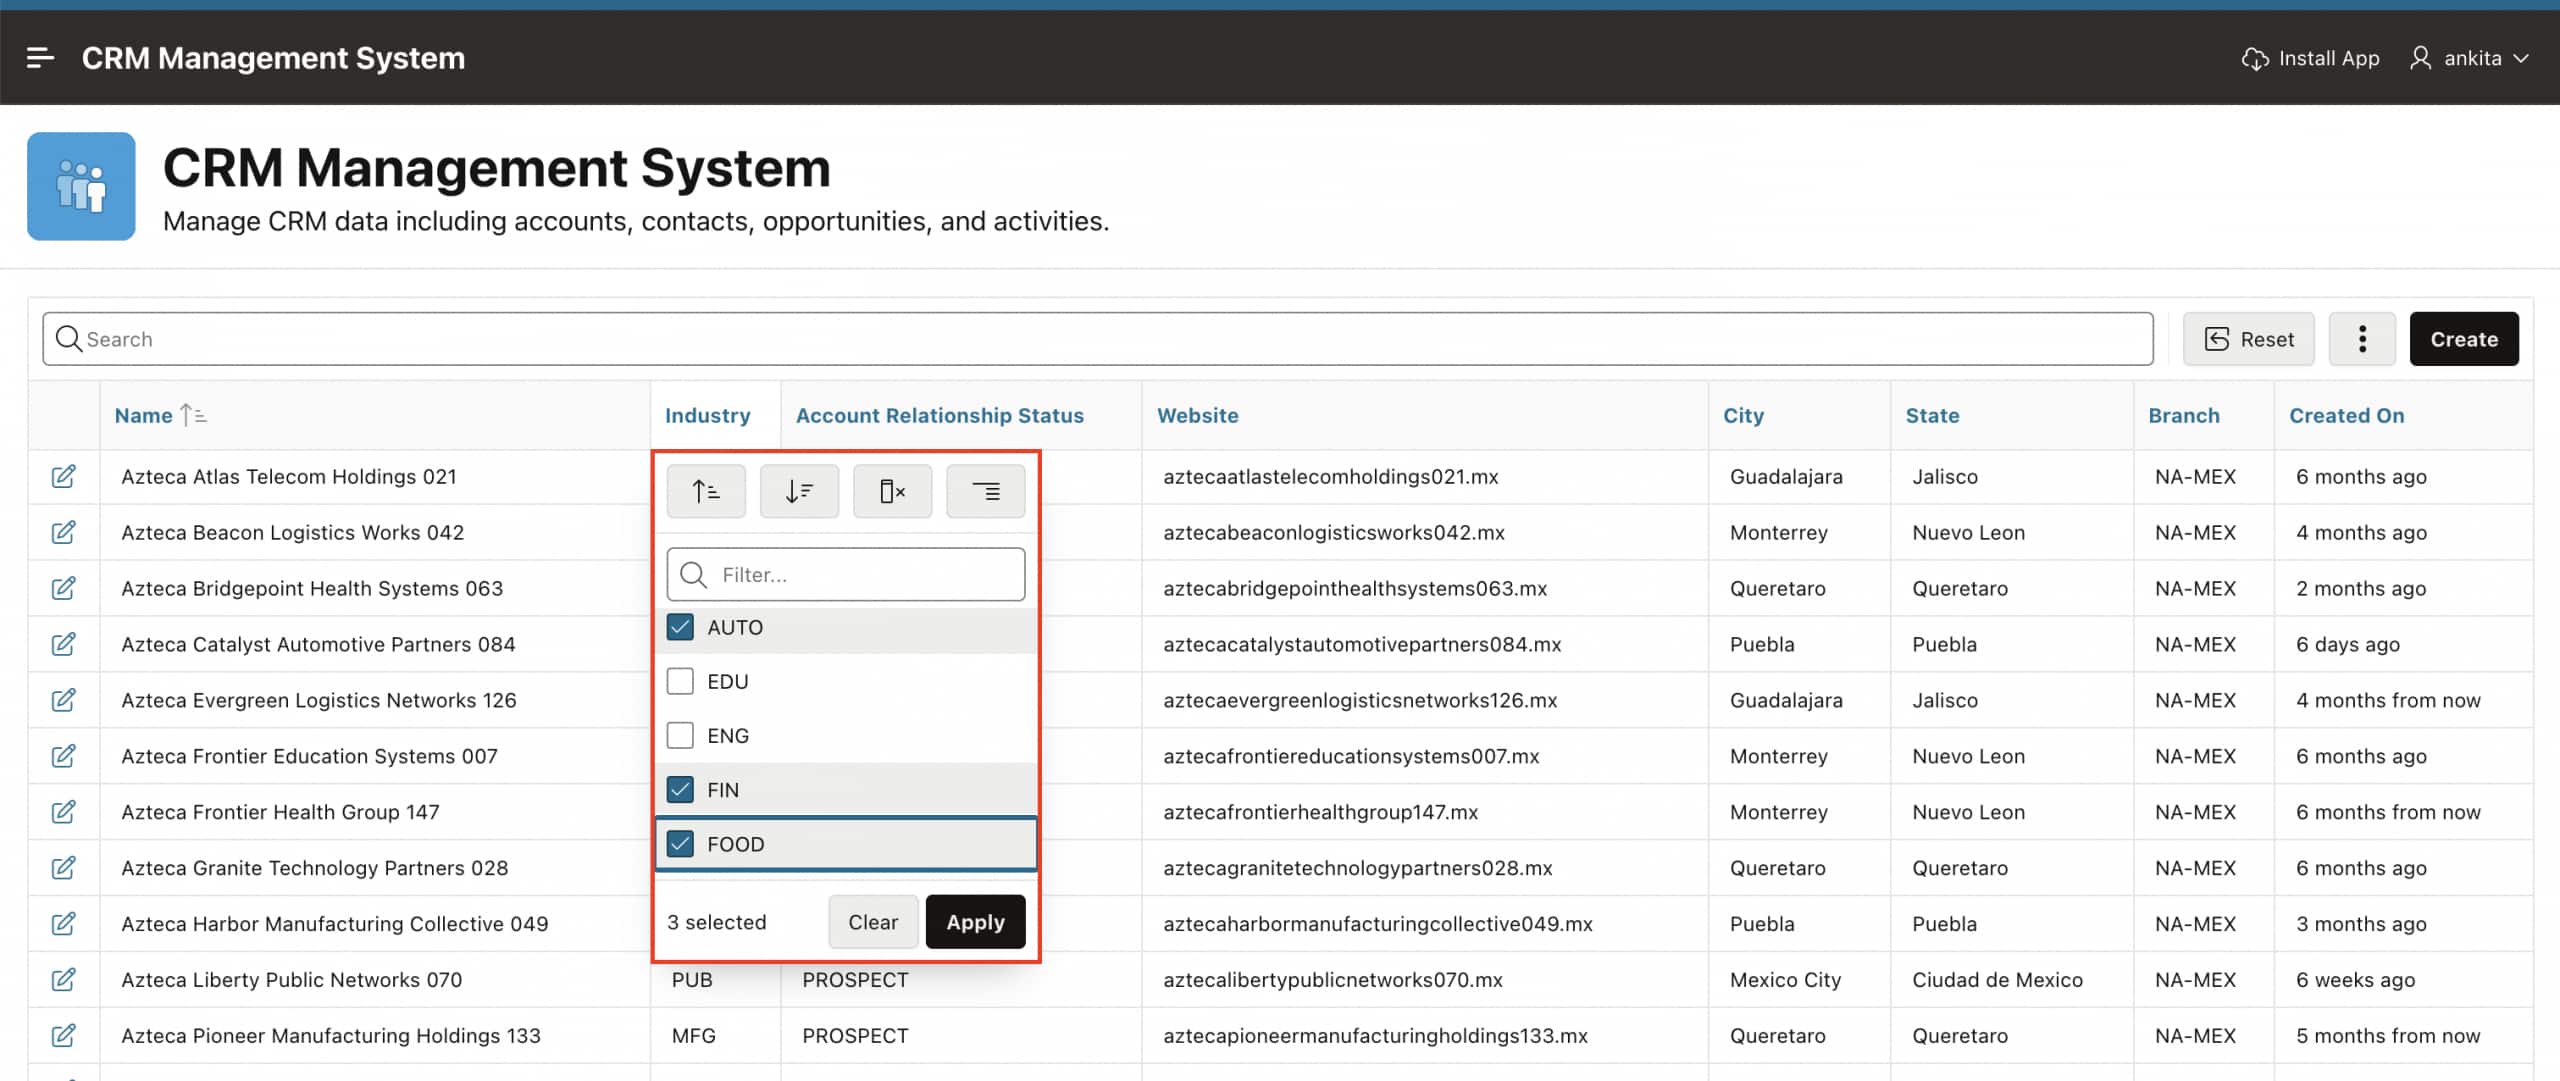
Column-header filters now support multiple selected values.
This makes it easier to analyze several categories, stages, regions, or other values within the same report column.
When a column already has a filter, opening its header filter displays the current selections. Updating those selections updates the existing filter rather than creating a separate conflicting filter.
Common header actions such as sorting, hiding columns, and creating control breaks remain familiar.
Numeric range filtering
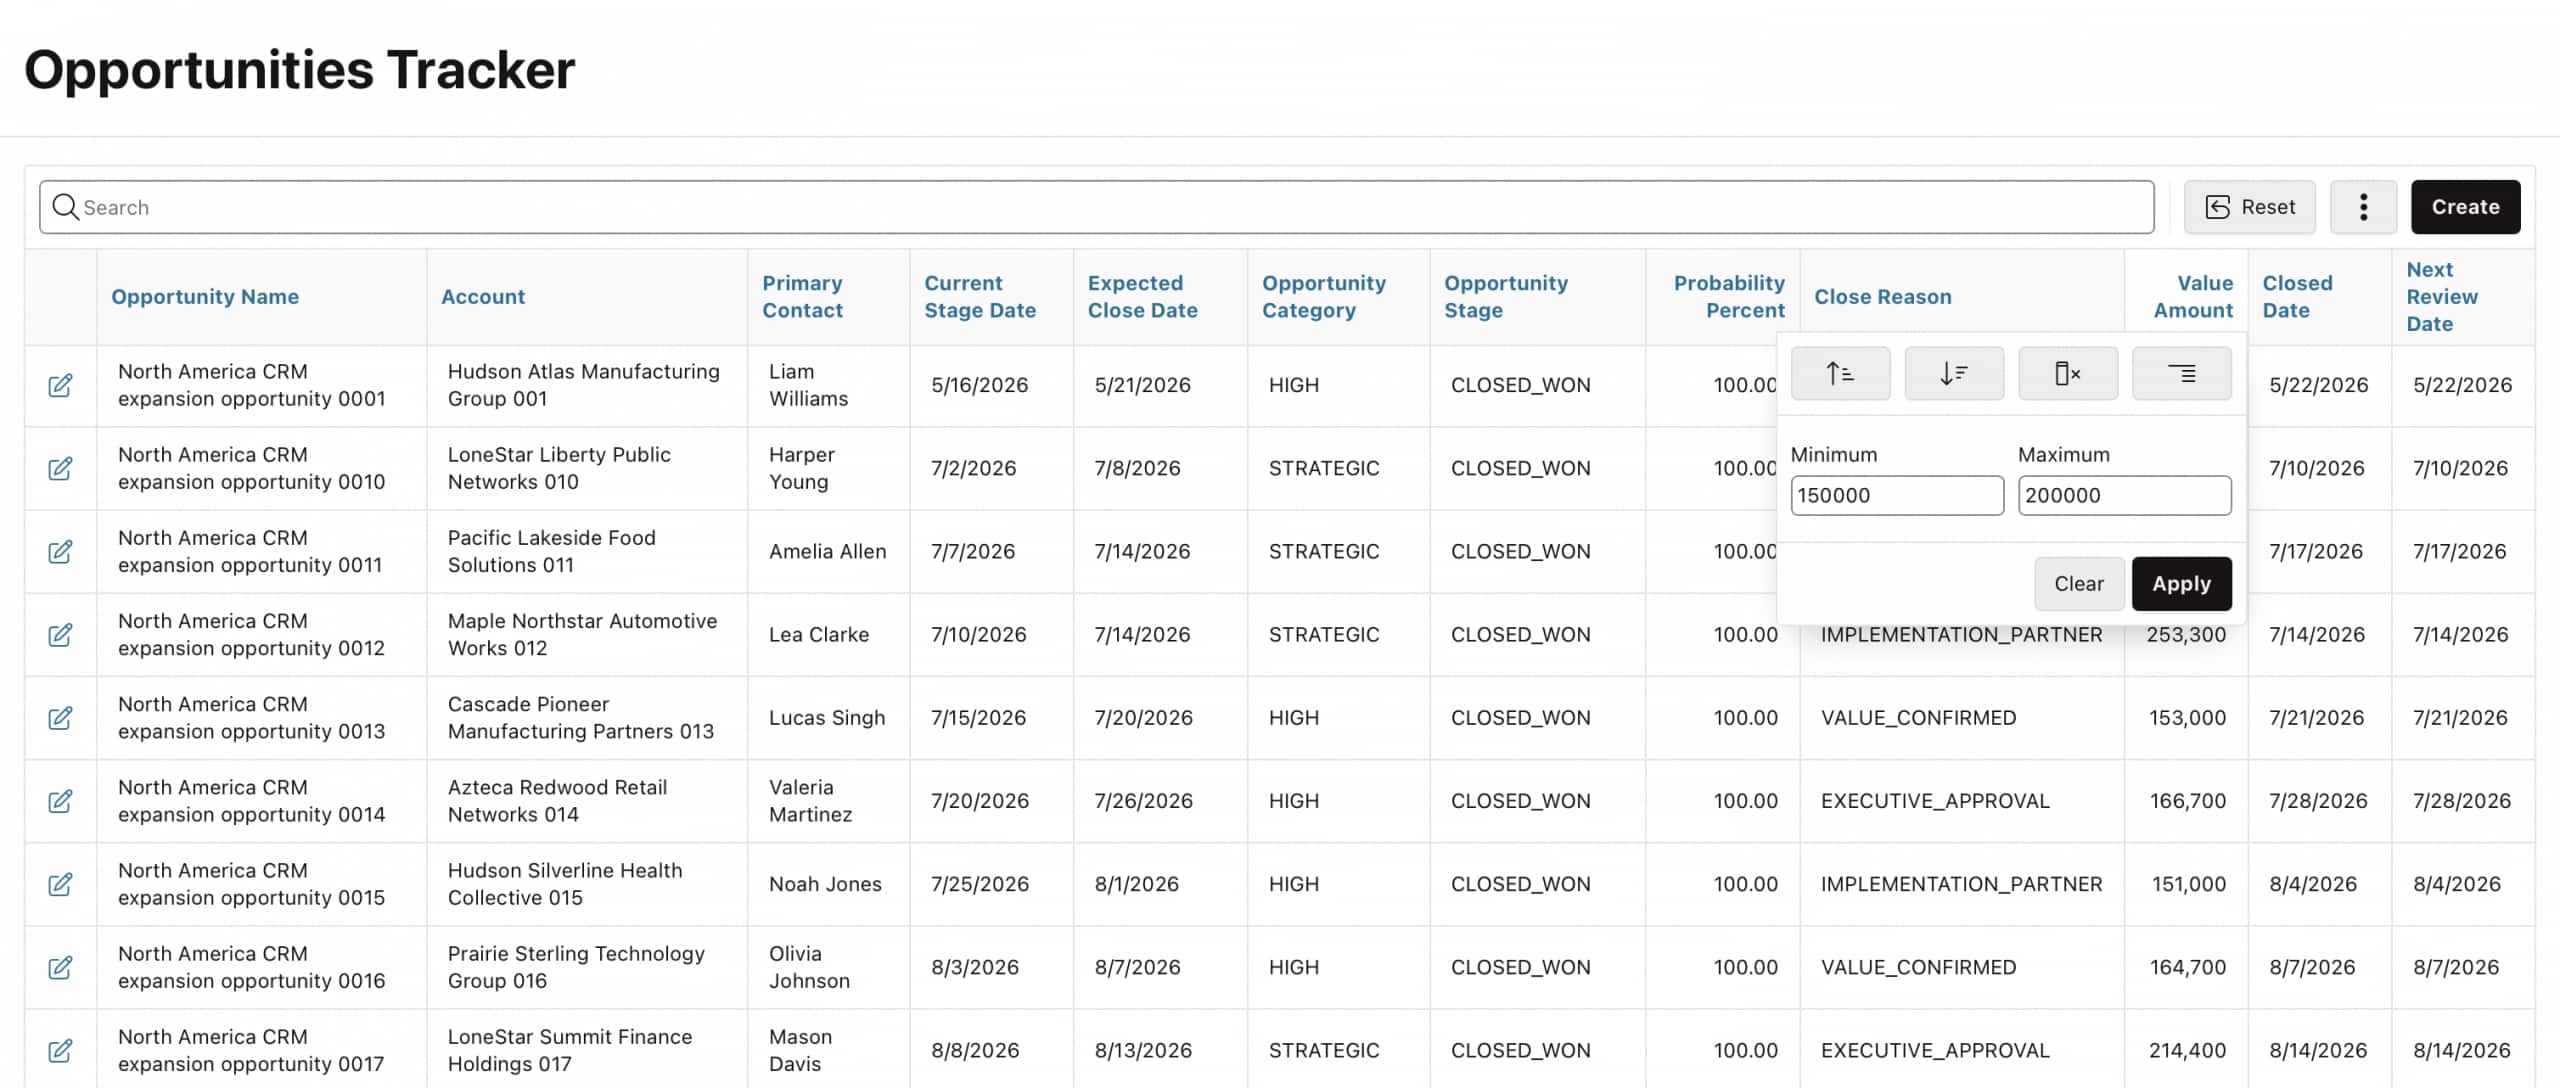
Numeric columns receive a filtering experience better suited to numerical data.
Instead of relying on distinct-value lists, users can define minimum and maximum values. The interface supports lower bounds, upper bounds, and ranges.
This provides a more useful way to analyze numeric fields such as amounts, percentages, quantities, and calculated metrics.
Date filtering
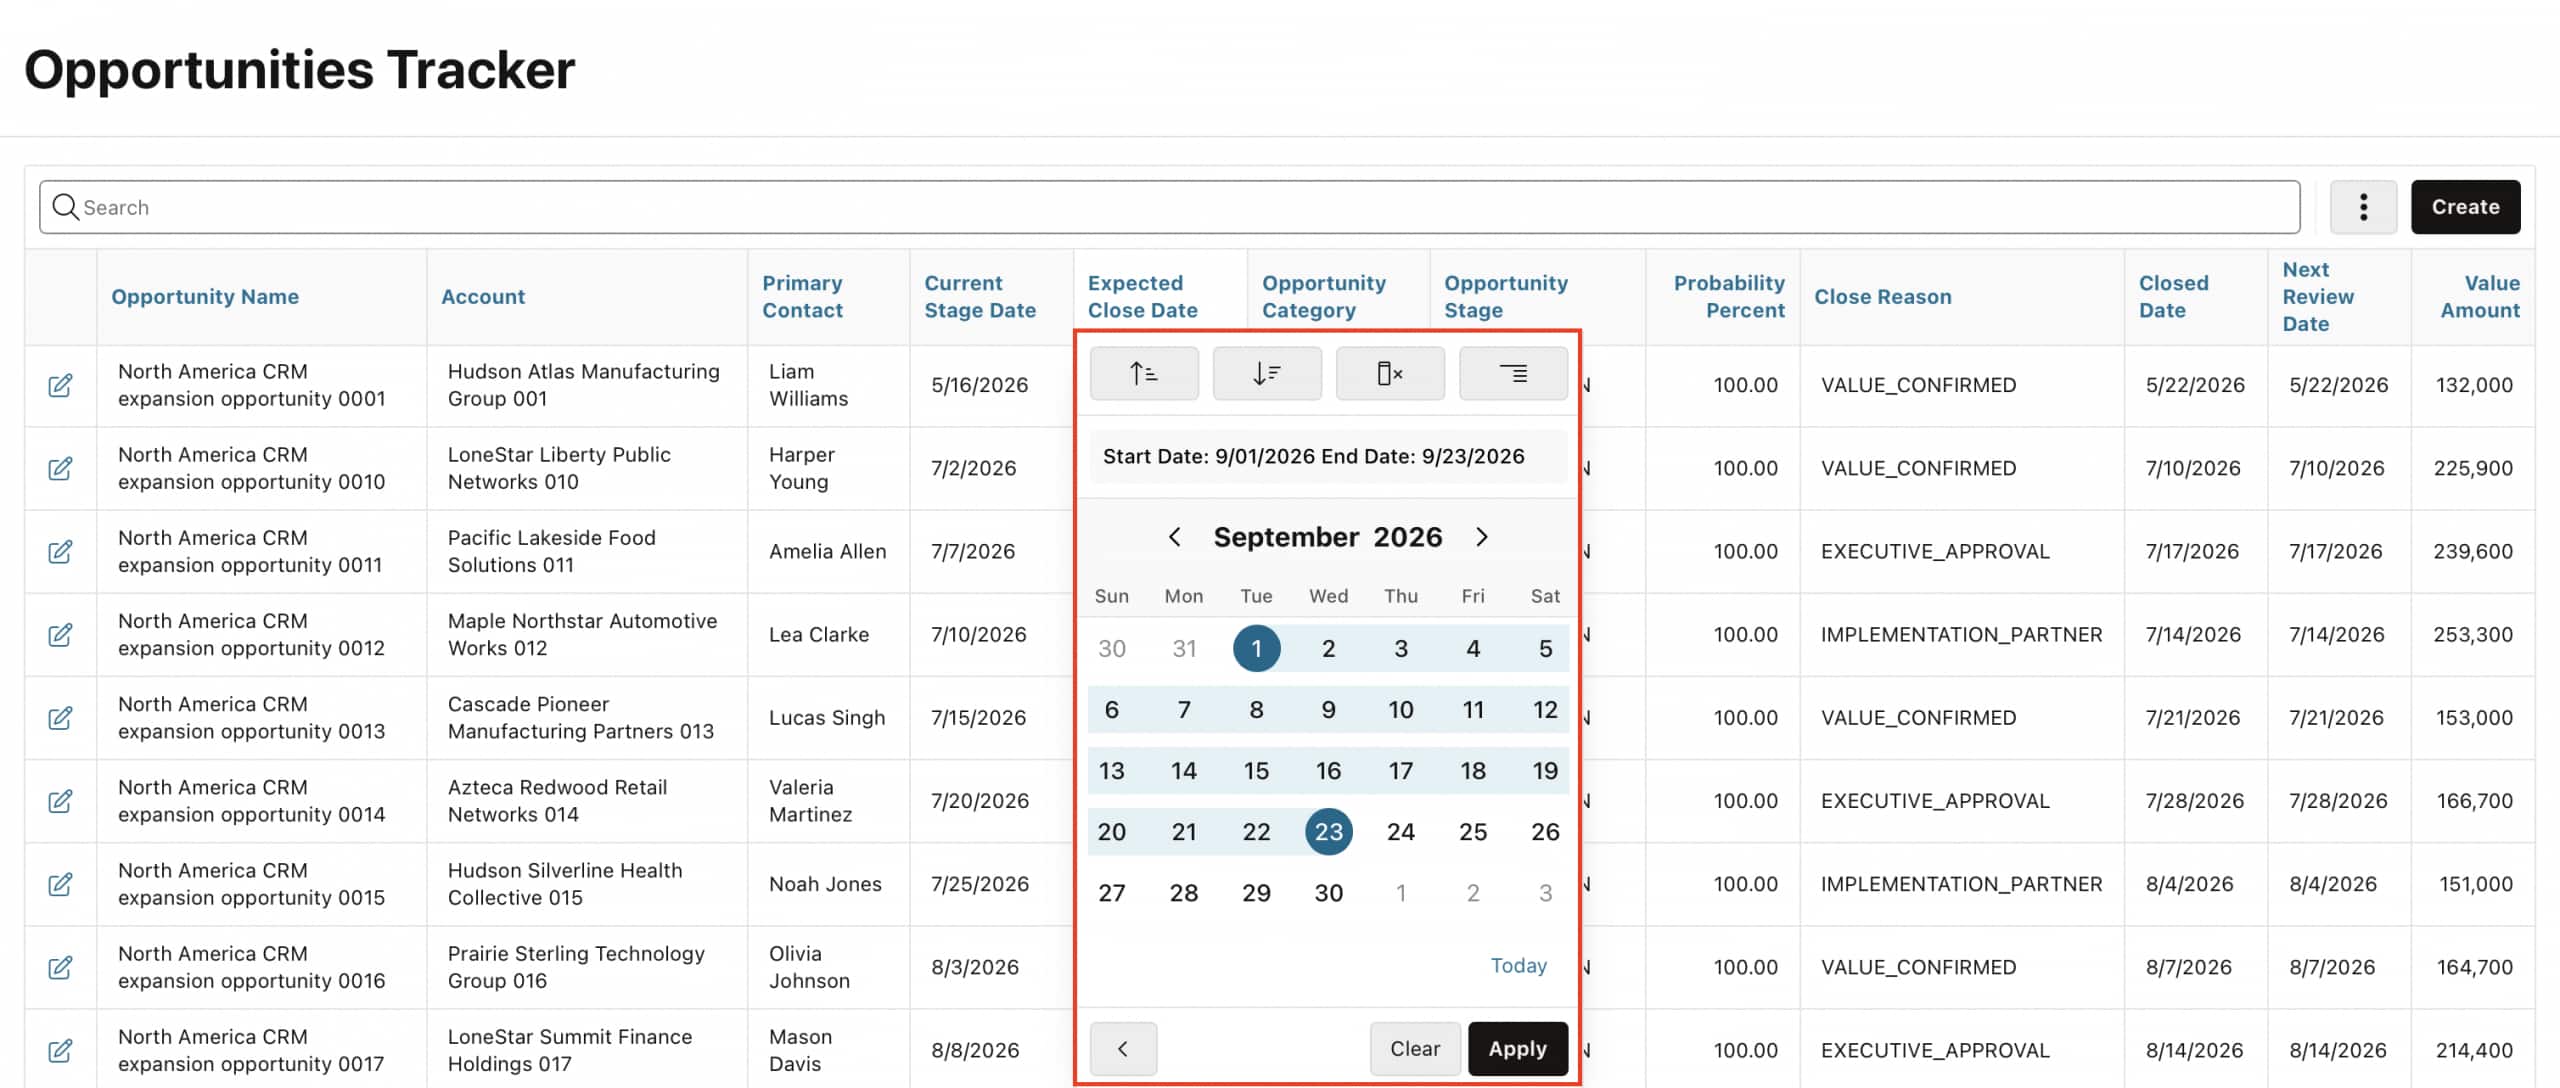
Date columns support a combination of presets, exact dates, and start-and-end ranges.
The filter interface makes it easier to work with relative time periods as well as specific calendar ranges. When a date filter is already applied, the current selection is reflected when the dialog is reopened.
This creates a more consistent experience for time-based reporting.
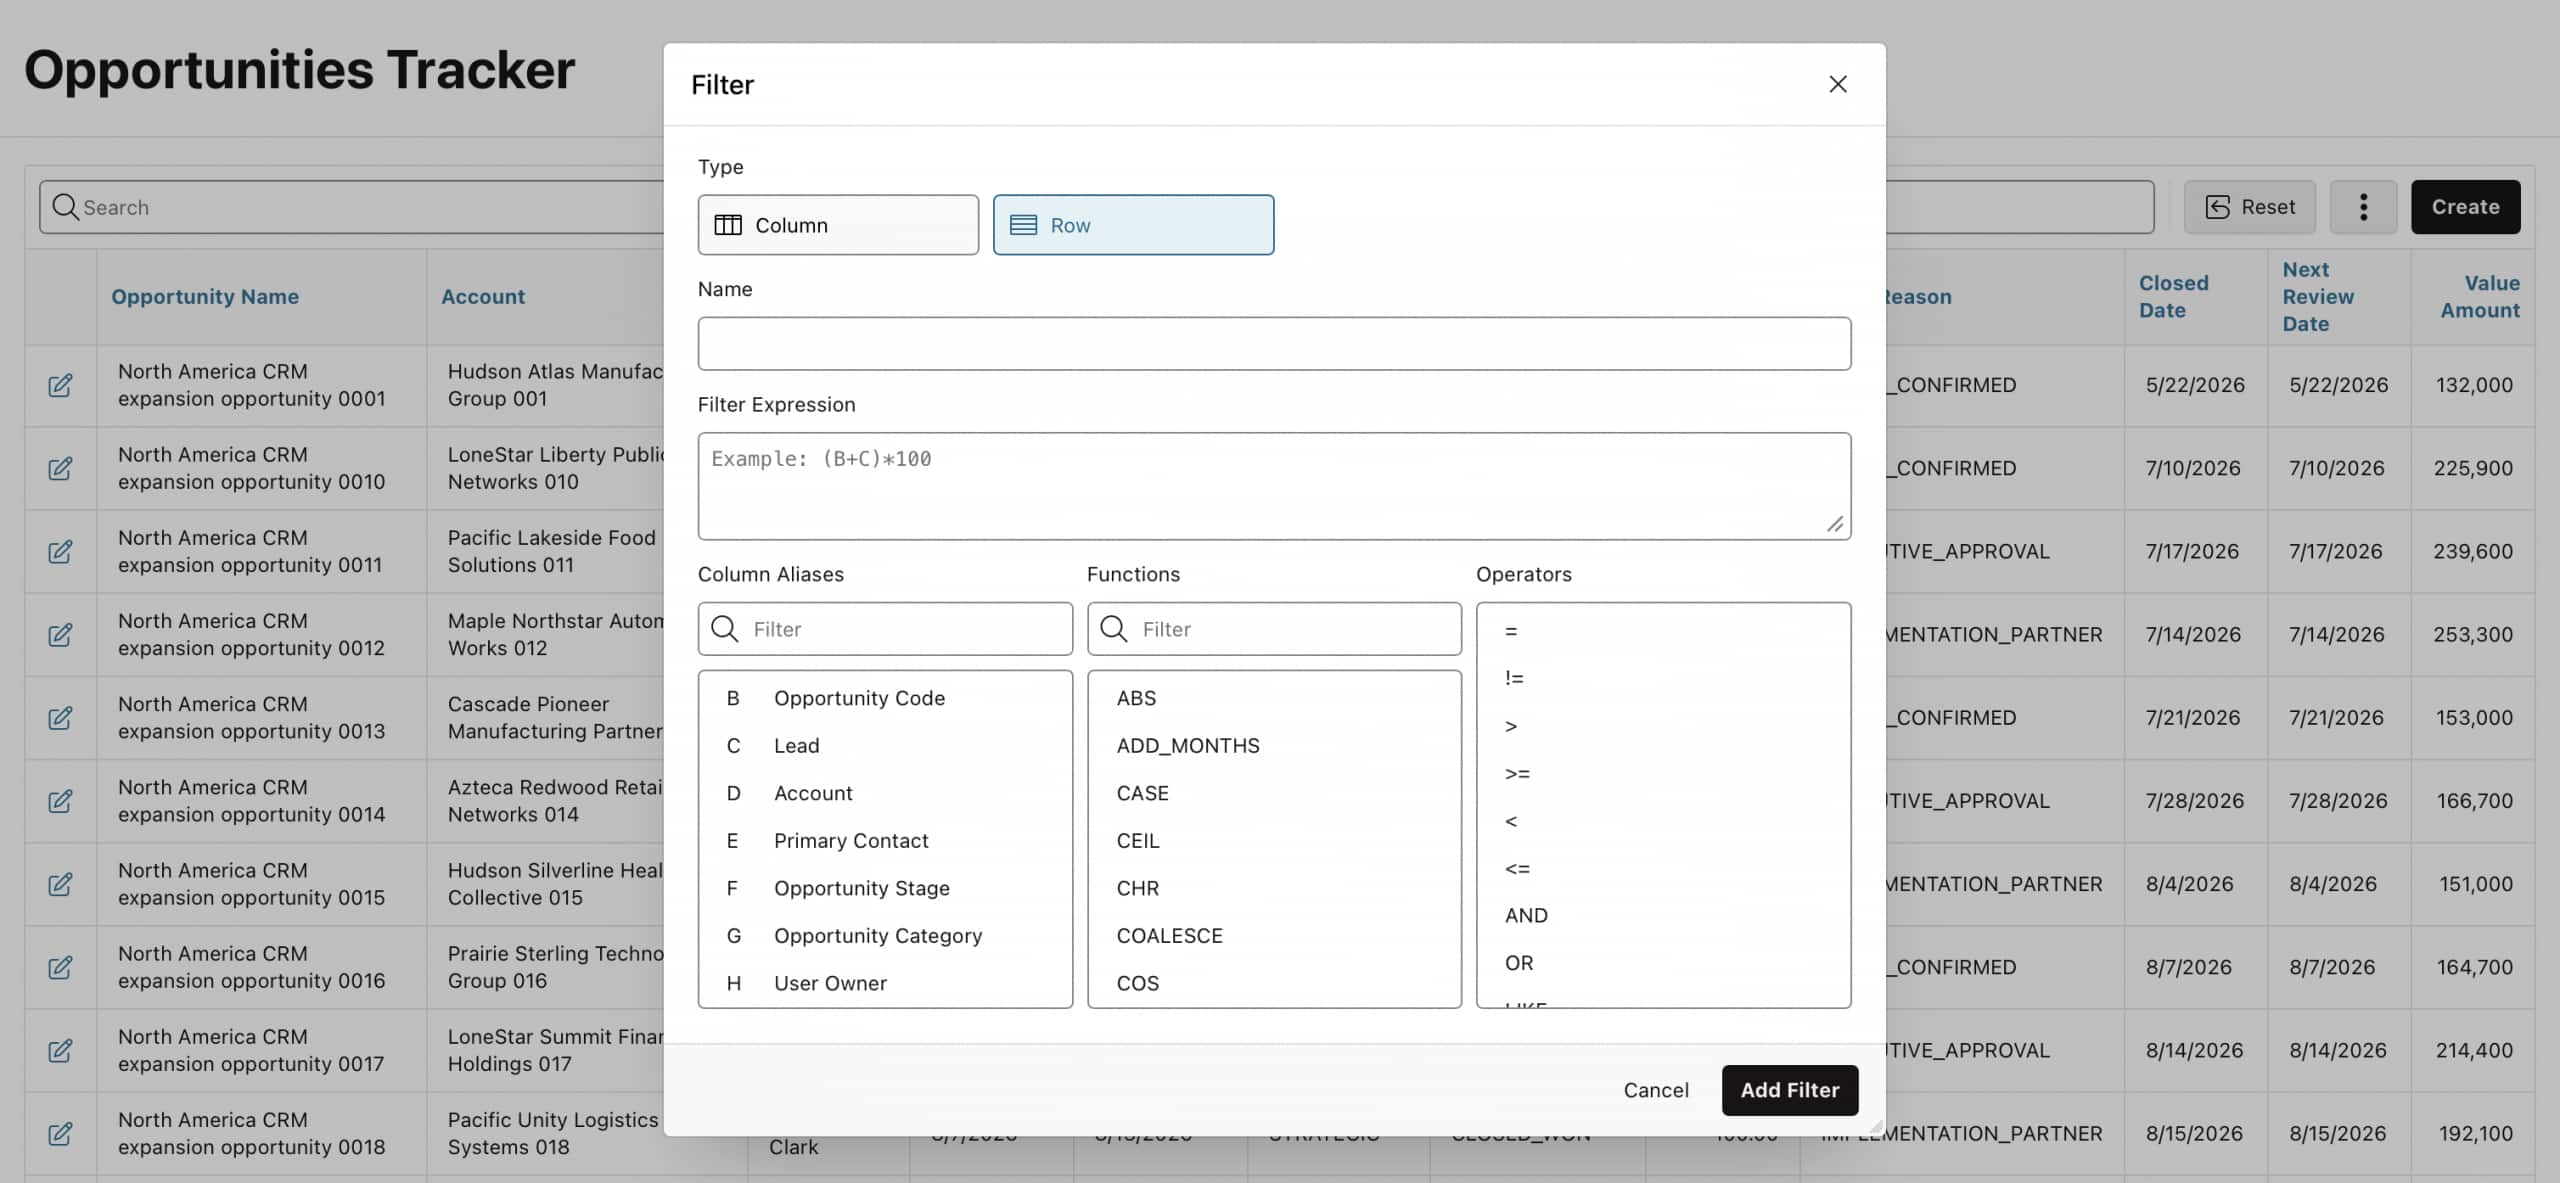
Cleaner filter dialogs
Filter dialogs use more understandable controls and clearer operator descriptions.
Column and row selections are presented through consistent pill-style controls. Operators are shown with clearer labels and visual indicators, helping users understand how a filter will be applied.
The workflow also makes it clearer when a user is adding a filter to the report.
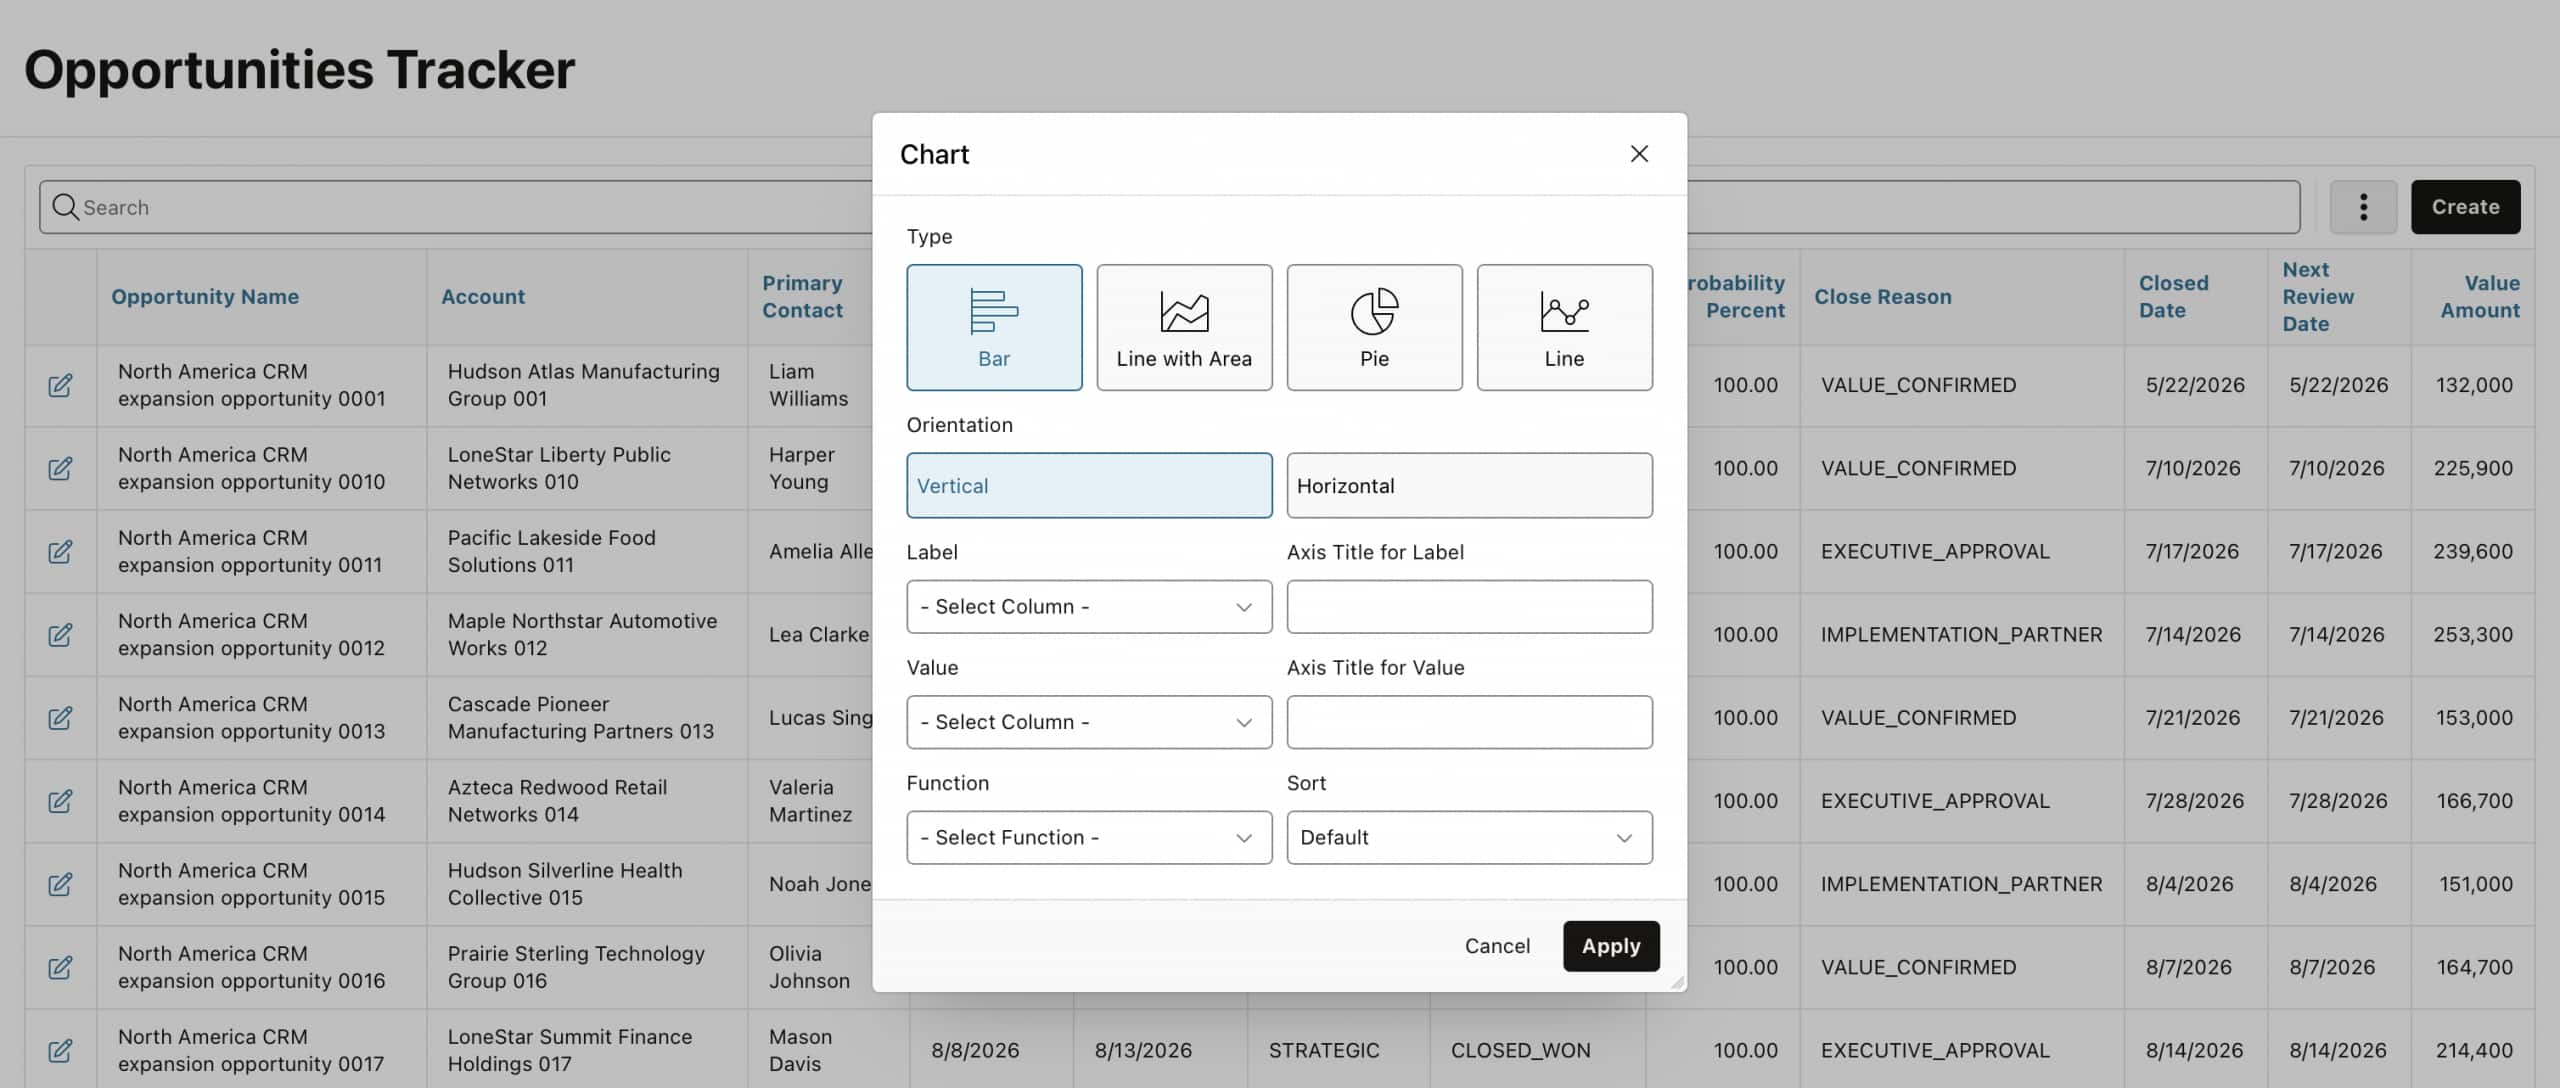
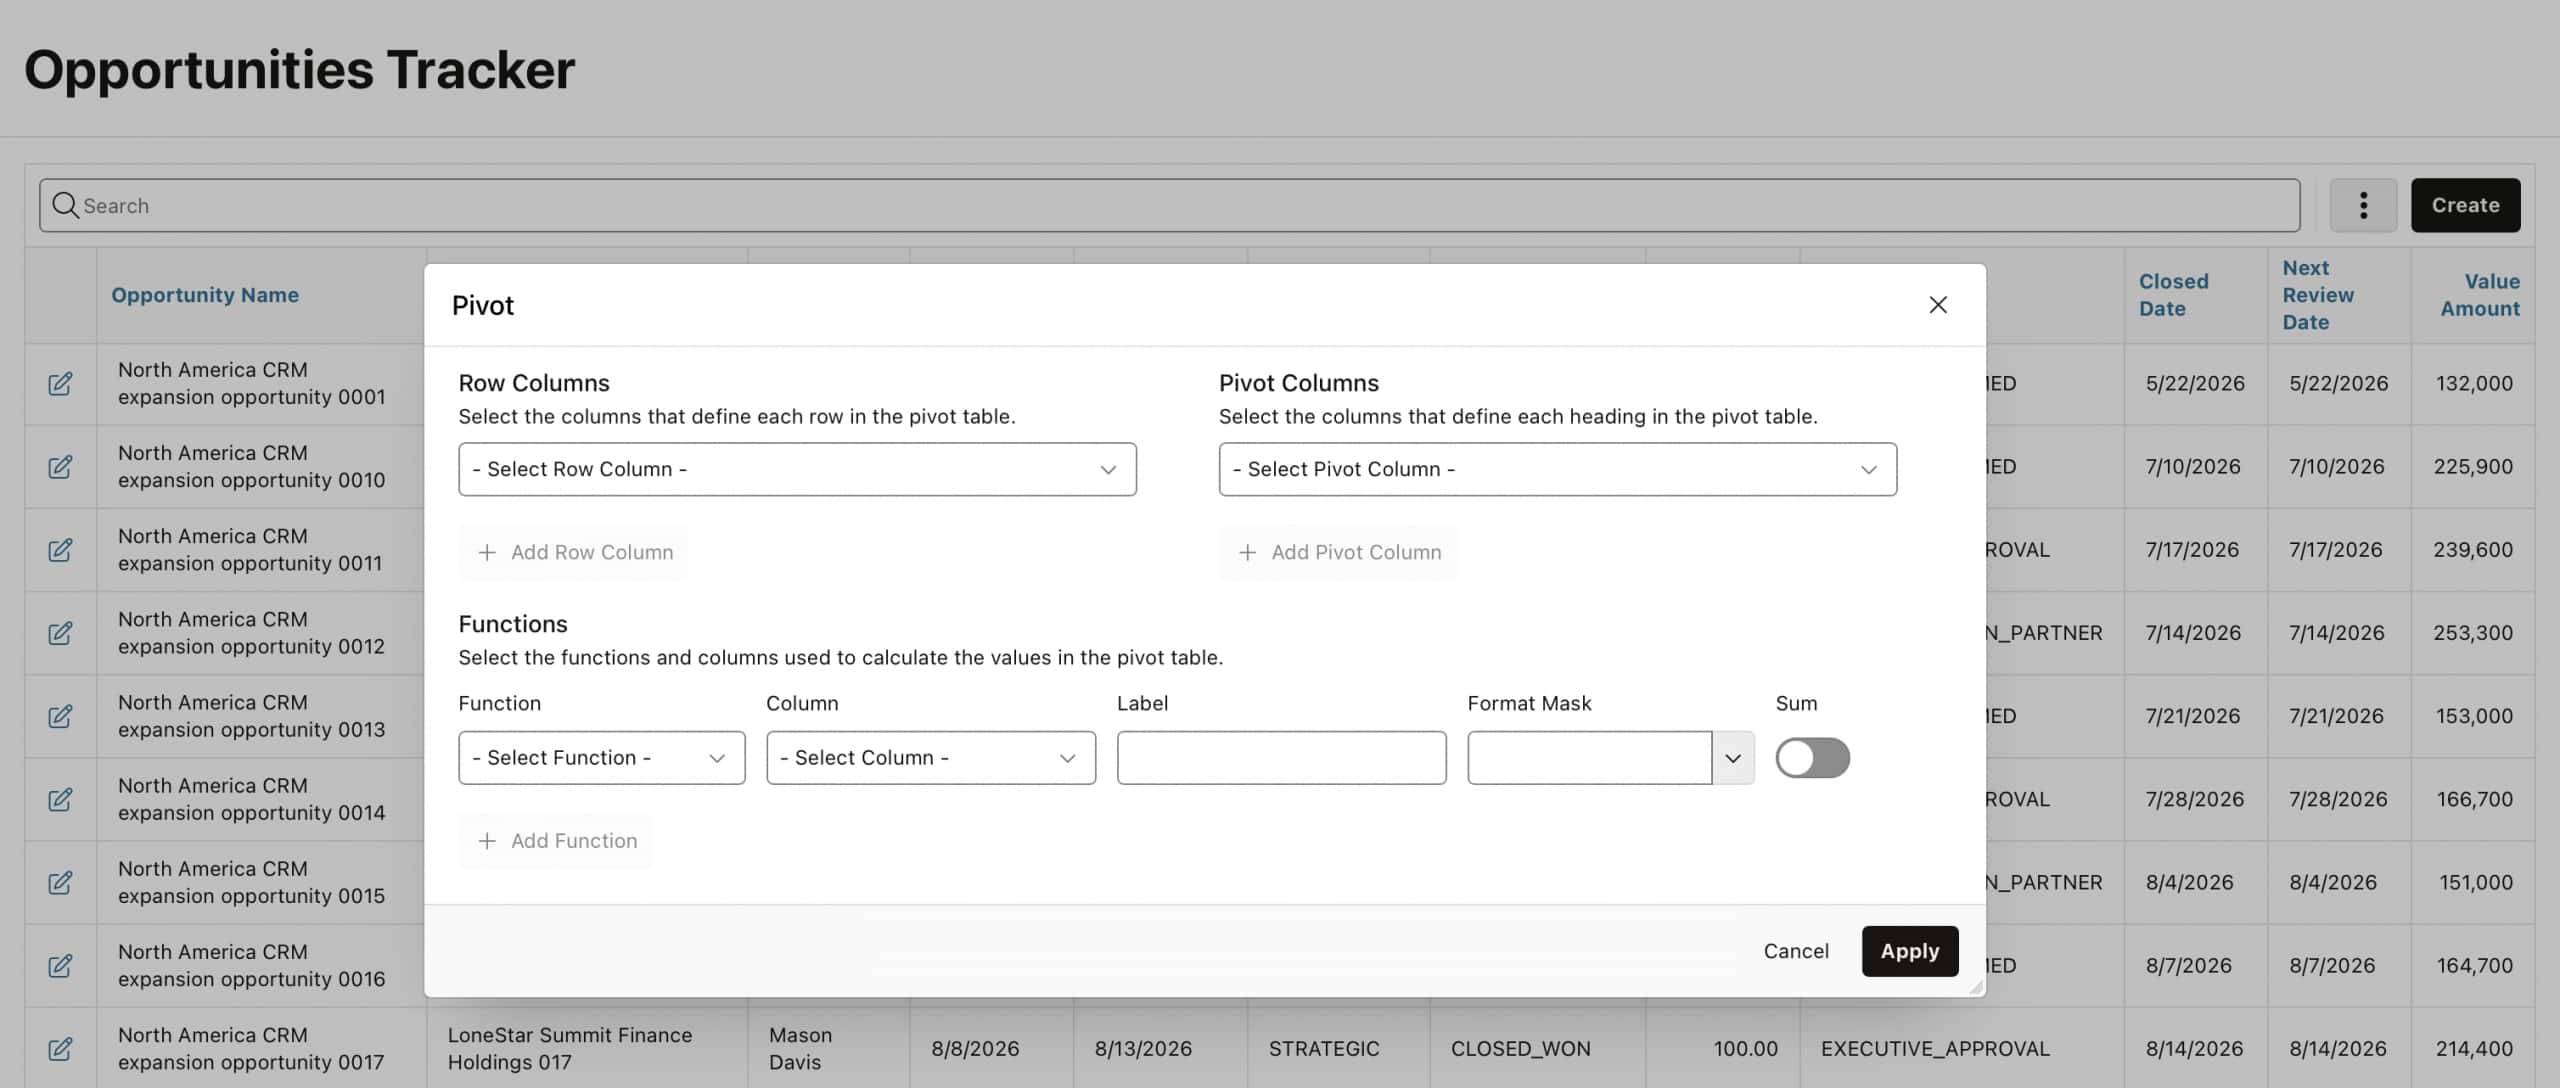
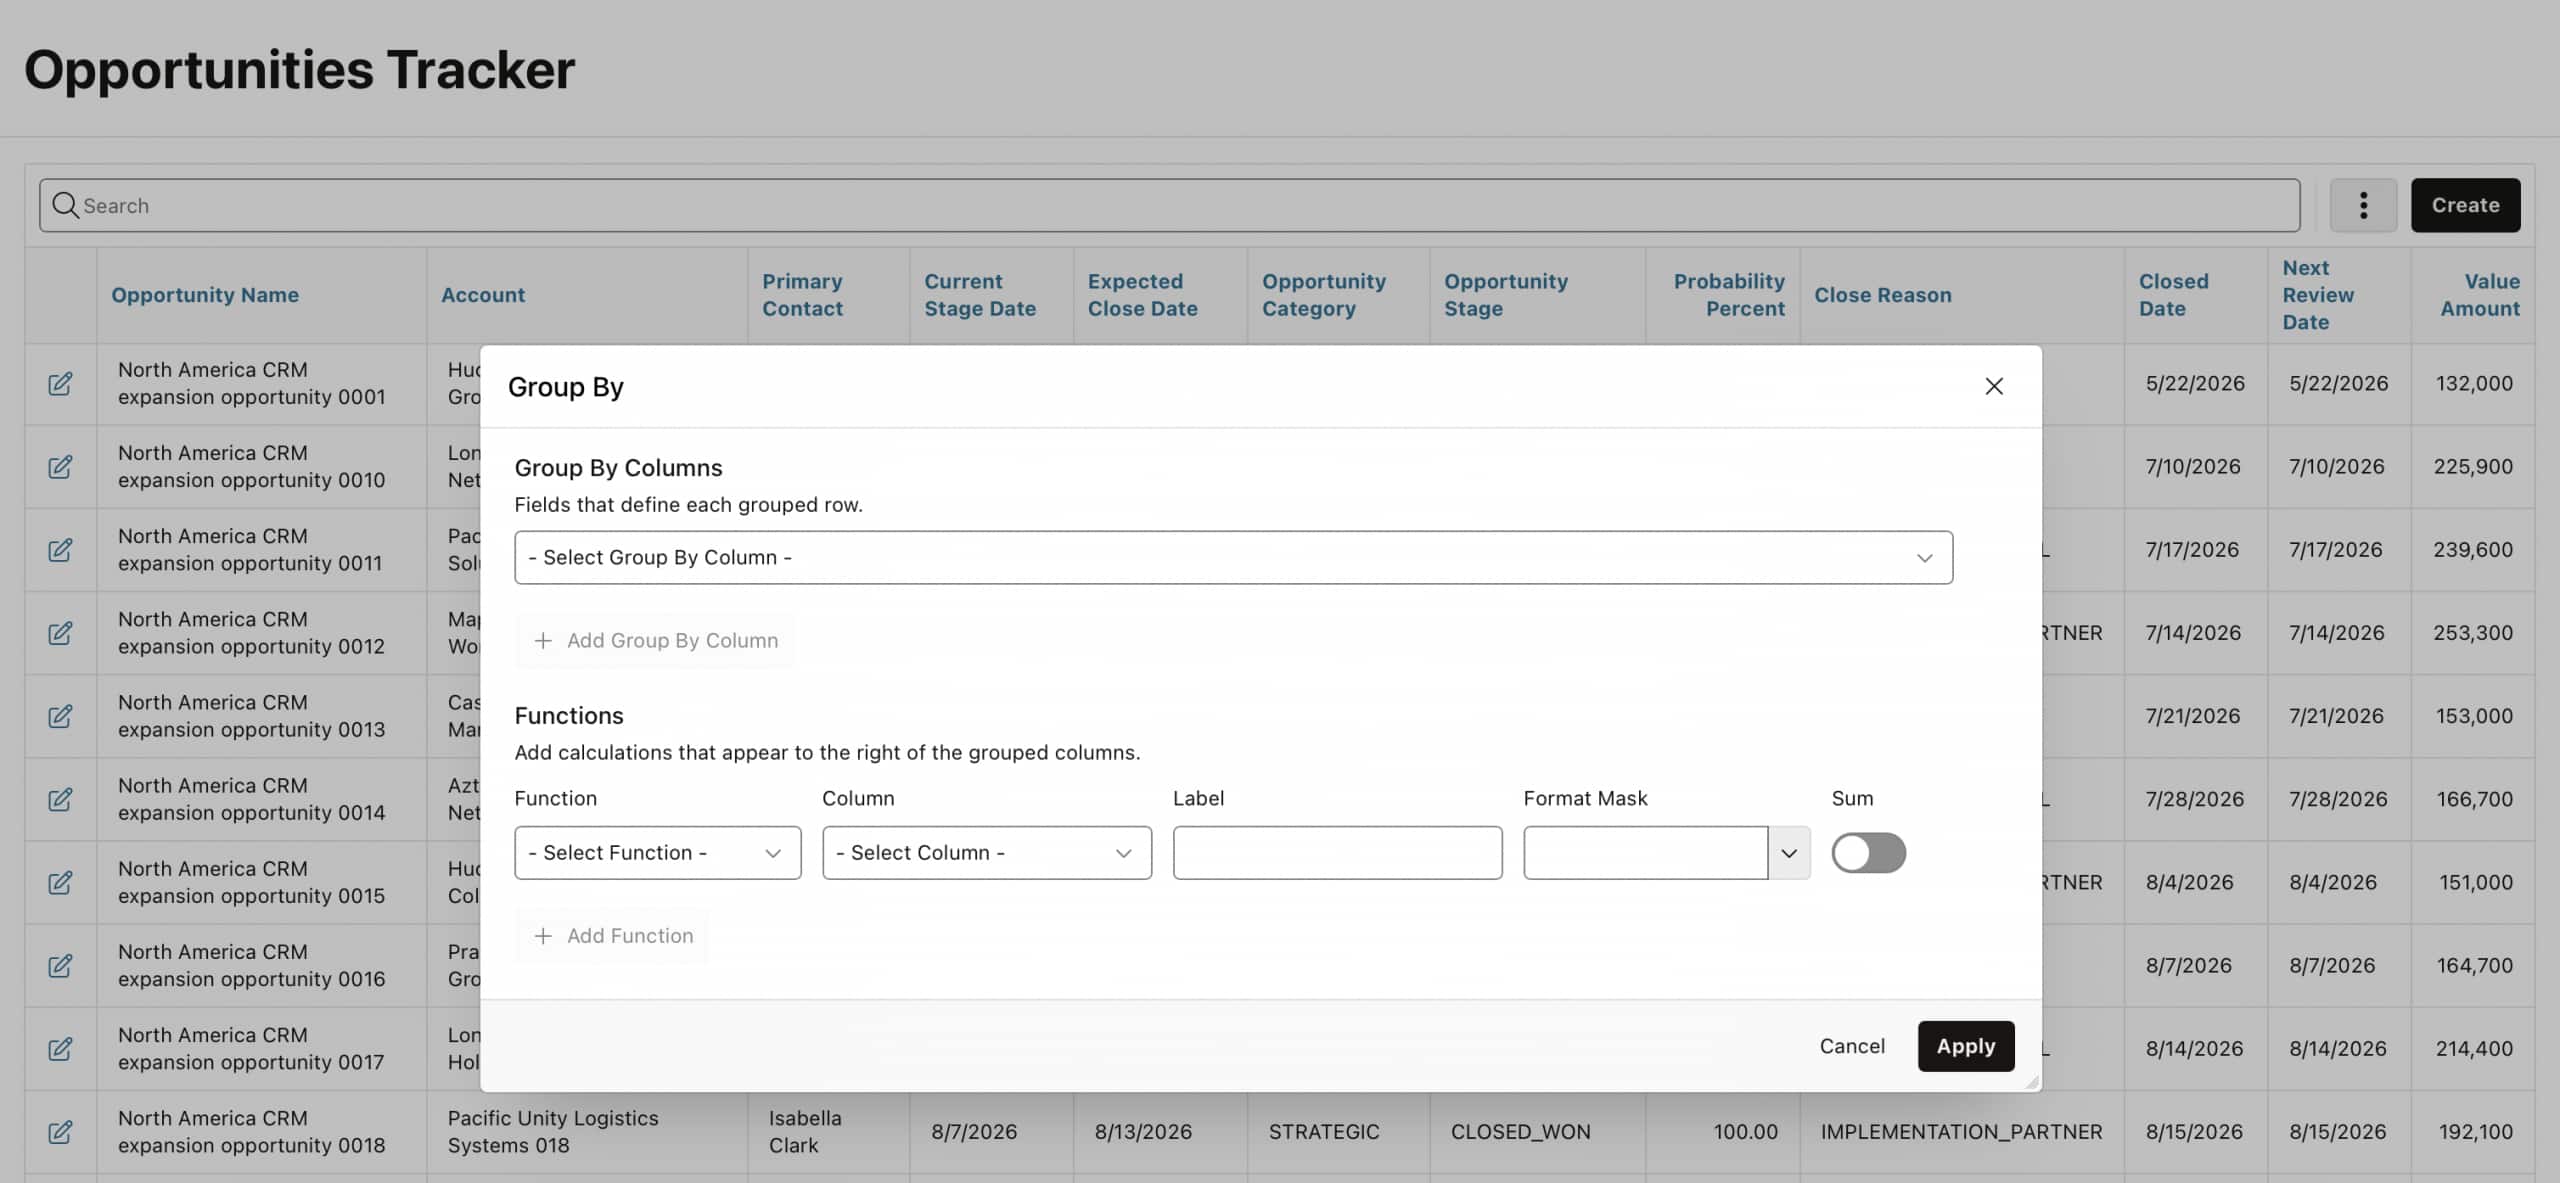
Improved chart, pivot, and grouping workflows
Chart configuration is being reorganized around clearer concepts such as chart type, title, orientation, grouping, metrics, and drill-down behavior.
Pivot configuration provides clearer separation between row columns, pivot columns, and values.
Group By configuration gives users better context for selected columns and functions, while making it easier to add or remove items from the configuration.
These changes improve discoverability without removing the analytical capabilities that Interactive Reports already provide.
Better report layout management
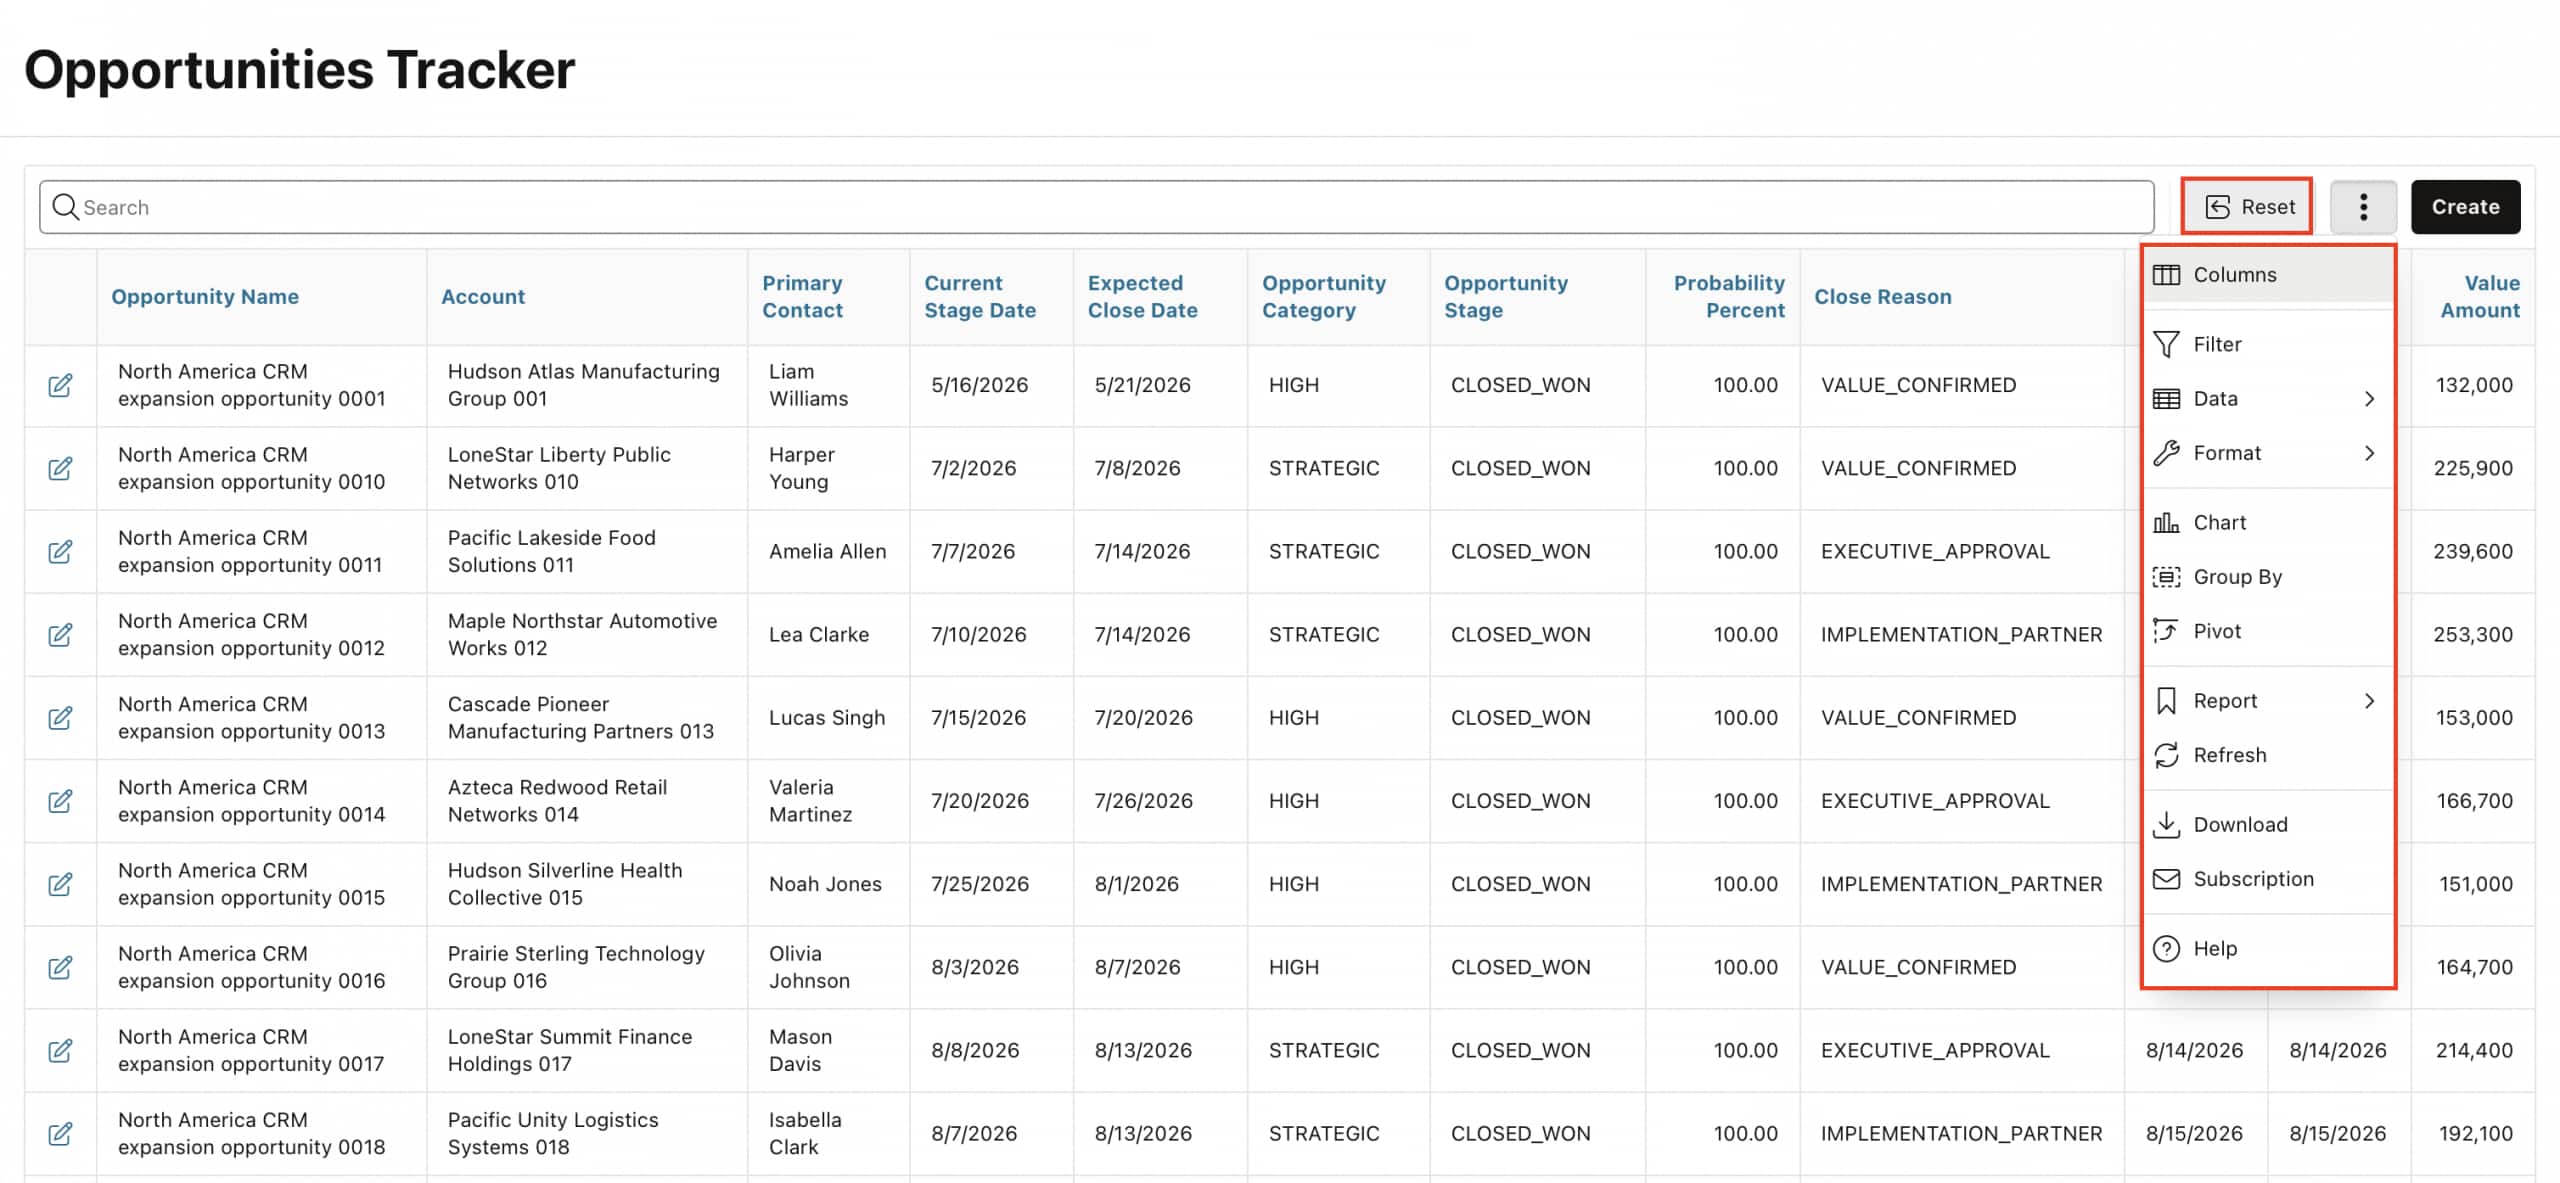
The modernization also improves report customization through drag-and-drop column ordering, better frozen-column support, and a reorganized Actions menu.
Frequently used functionality can be surfaced more prominently, while advanced capabilities remain available in a more organized structure.
Reset behavior is also more adaptive. The reset control appears when filters or report customizations have been applied, helping users return to the original report state when necessary.
Existing saved reports, subscriptions, downloads, and report management capabilities remain compatible.
Key phrases for common report actions
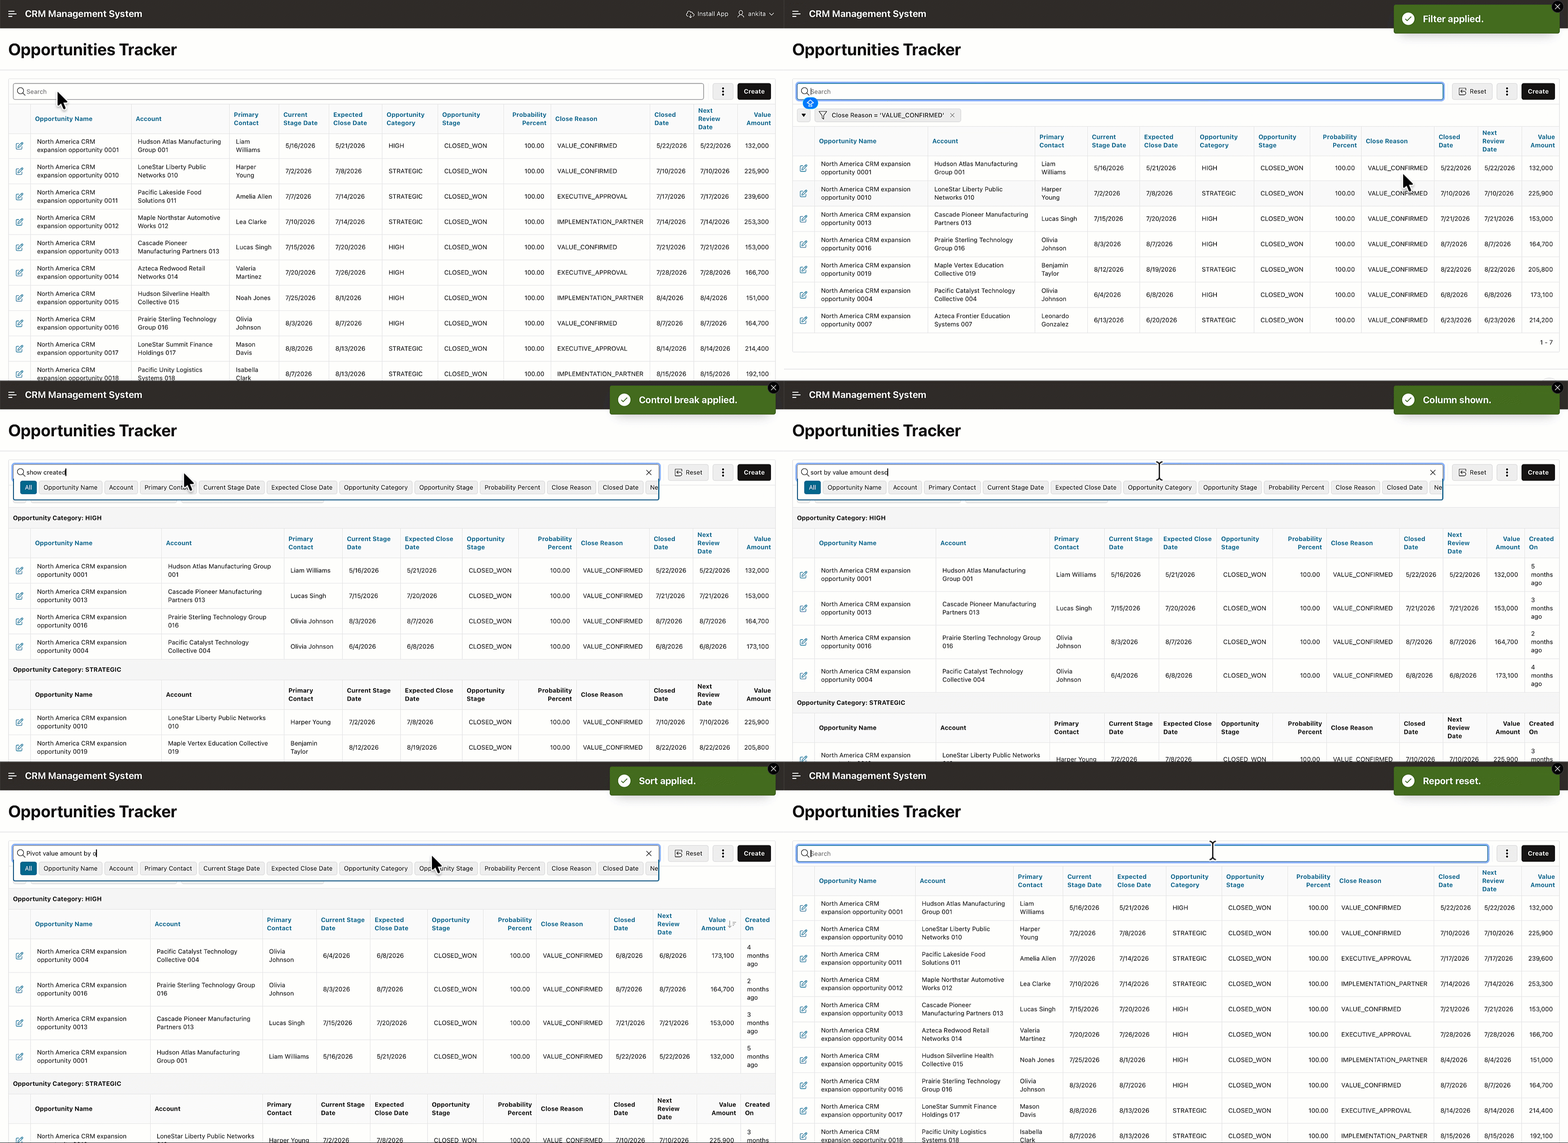
Not every report request requires AI interpretation. Many Interactive Report actions are short, explicit, and predictable, so APEX 26.2 handles them using predefined key-phrase templates.
Each supported request follows a predefined template with meaningful placeholders. When a request matches one of these templates, APEX validates the specified columns and values against the current report before applying the action.
| Template | Action | Behavior |
|---|---|---|
filter %column by %value | Filter | Applies a filter to the specified column. |
search %column for %value | Search | Searches the specified column using contains-search behavior. |
sort %column | Sort | Sorts the specified column in ascending order by default. |
sort %column asc | Sort | Sorts the specified column in ascending order. |
sort %column ascending | Sort | Sorts the specified column in ascending order. |
sort %column desc | Sort | Sorts the specified column in descending order. |
sort %column descending | Sort | Sorts the specified column in descending order. |
show %column | Display column | Shows the specified report column. |
hide %column | Hide column | Hides the specified report column. |
pivot %row_column by %column_column | Pivot | Creates a pivot using the specified row and pivot columns. |
break %column | Control break | Creates a control break using the specified column. |
reset | Reset report | Resets the current report customizations and filters. |
APEX validates %column, %value, %row_column, and %column_column against the current report metadata, enabled report capabilities, and available LOV or reference data.
Key phrases are supported in both AI-enabled and non-AI Interactive Reports. In non-AI Interactive Reports, supported key-phrase requests are treated as row searches. In AI-enabled Interactive Reports, requests that are invalid, ambiguous, unsupported, malformed, or too complex continue through the existing AI Interactive Report flow.
This gives users a fast path for clear, everyday report actions while preserving AI assistance for requests that require deeper interpretation.
Computed columns with AI Interactive Reports
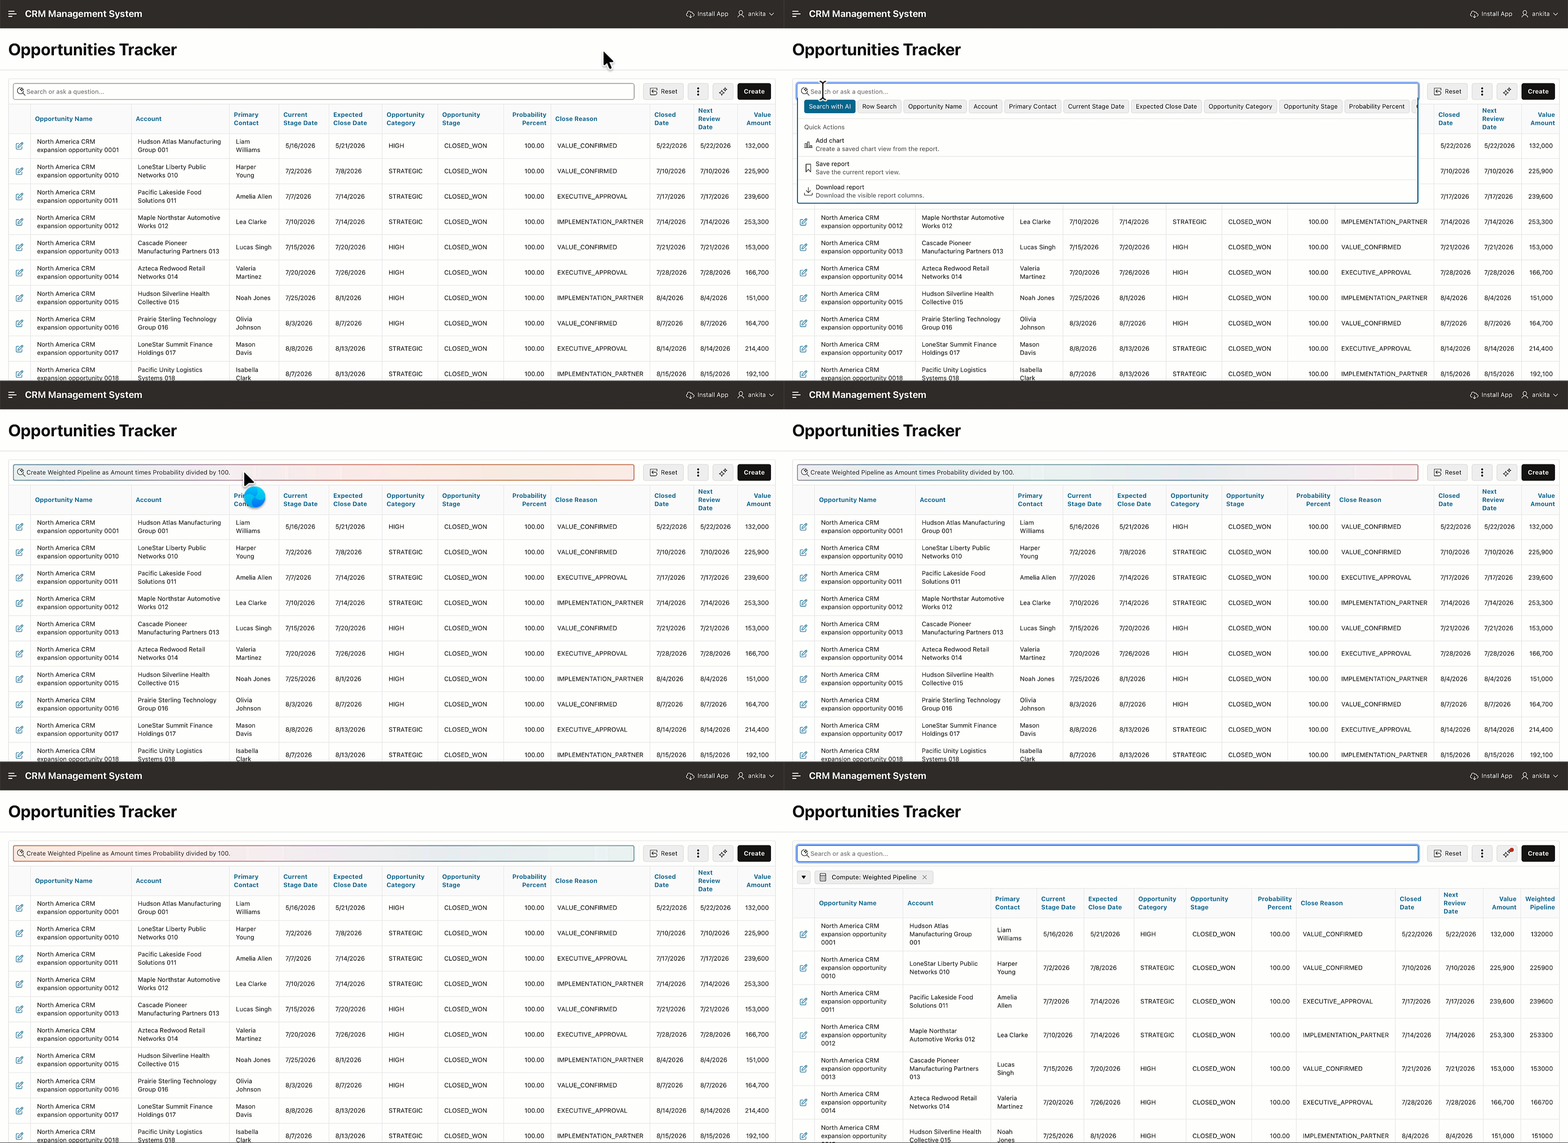
APEX 26.2 also extends AI Interactive Reports with natural-language support for computed columns.
Computed columns allow users to derive new values from existing report columns. They are useful for business metrics that are not stored directly in the underlying data source.
Users can describe the calculation in business language. AI translates the request into a valid Interactive Report computation using eligible report columns and their identifiers.
Users can now ask:
Create Weighted Pipeline as Amount times Probability divided by 100.
APEX creates the computed column: Weighted Pipeline = Amount * Probability / 100
If an opportunity has an Amount of 200,000 and a Probability of 60 percent, the Weighted Pipeline value is 120,000.
The calculation becomes a standard Interactive Report customization. Users can review, edit, save, or remove it through the existing report customization experience.
The underlying SQL query and data source remain unchanged.
Conclusion
APEX 26.2 takes the next step by modernizing the report interface and extending the AI experience with deterministic key phrases and natural-language computed columns.
The result is a more consistent, discoverable, and efficient way to work with data while preserving the power, flexibility, compatibility, and declarative model that Interactive Report users already rely on.