Introduction and Prerequisites
Did you know that you can use Oracle APEX to help analyzing plain CSV files in your Object Store bucket? This blog posting describes how to use APEX to first create a reference to the file in your Object Store bucket, and then to create reports, charts or other visualizations – without having to write a single line of code. Let’s assume we have a CSV file named testdata.csv in a bucket on Object Store (Fig. 1).
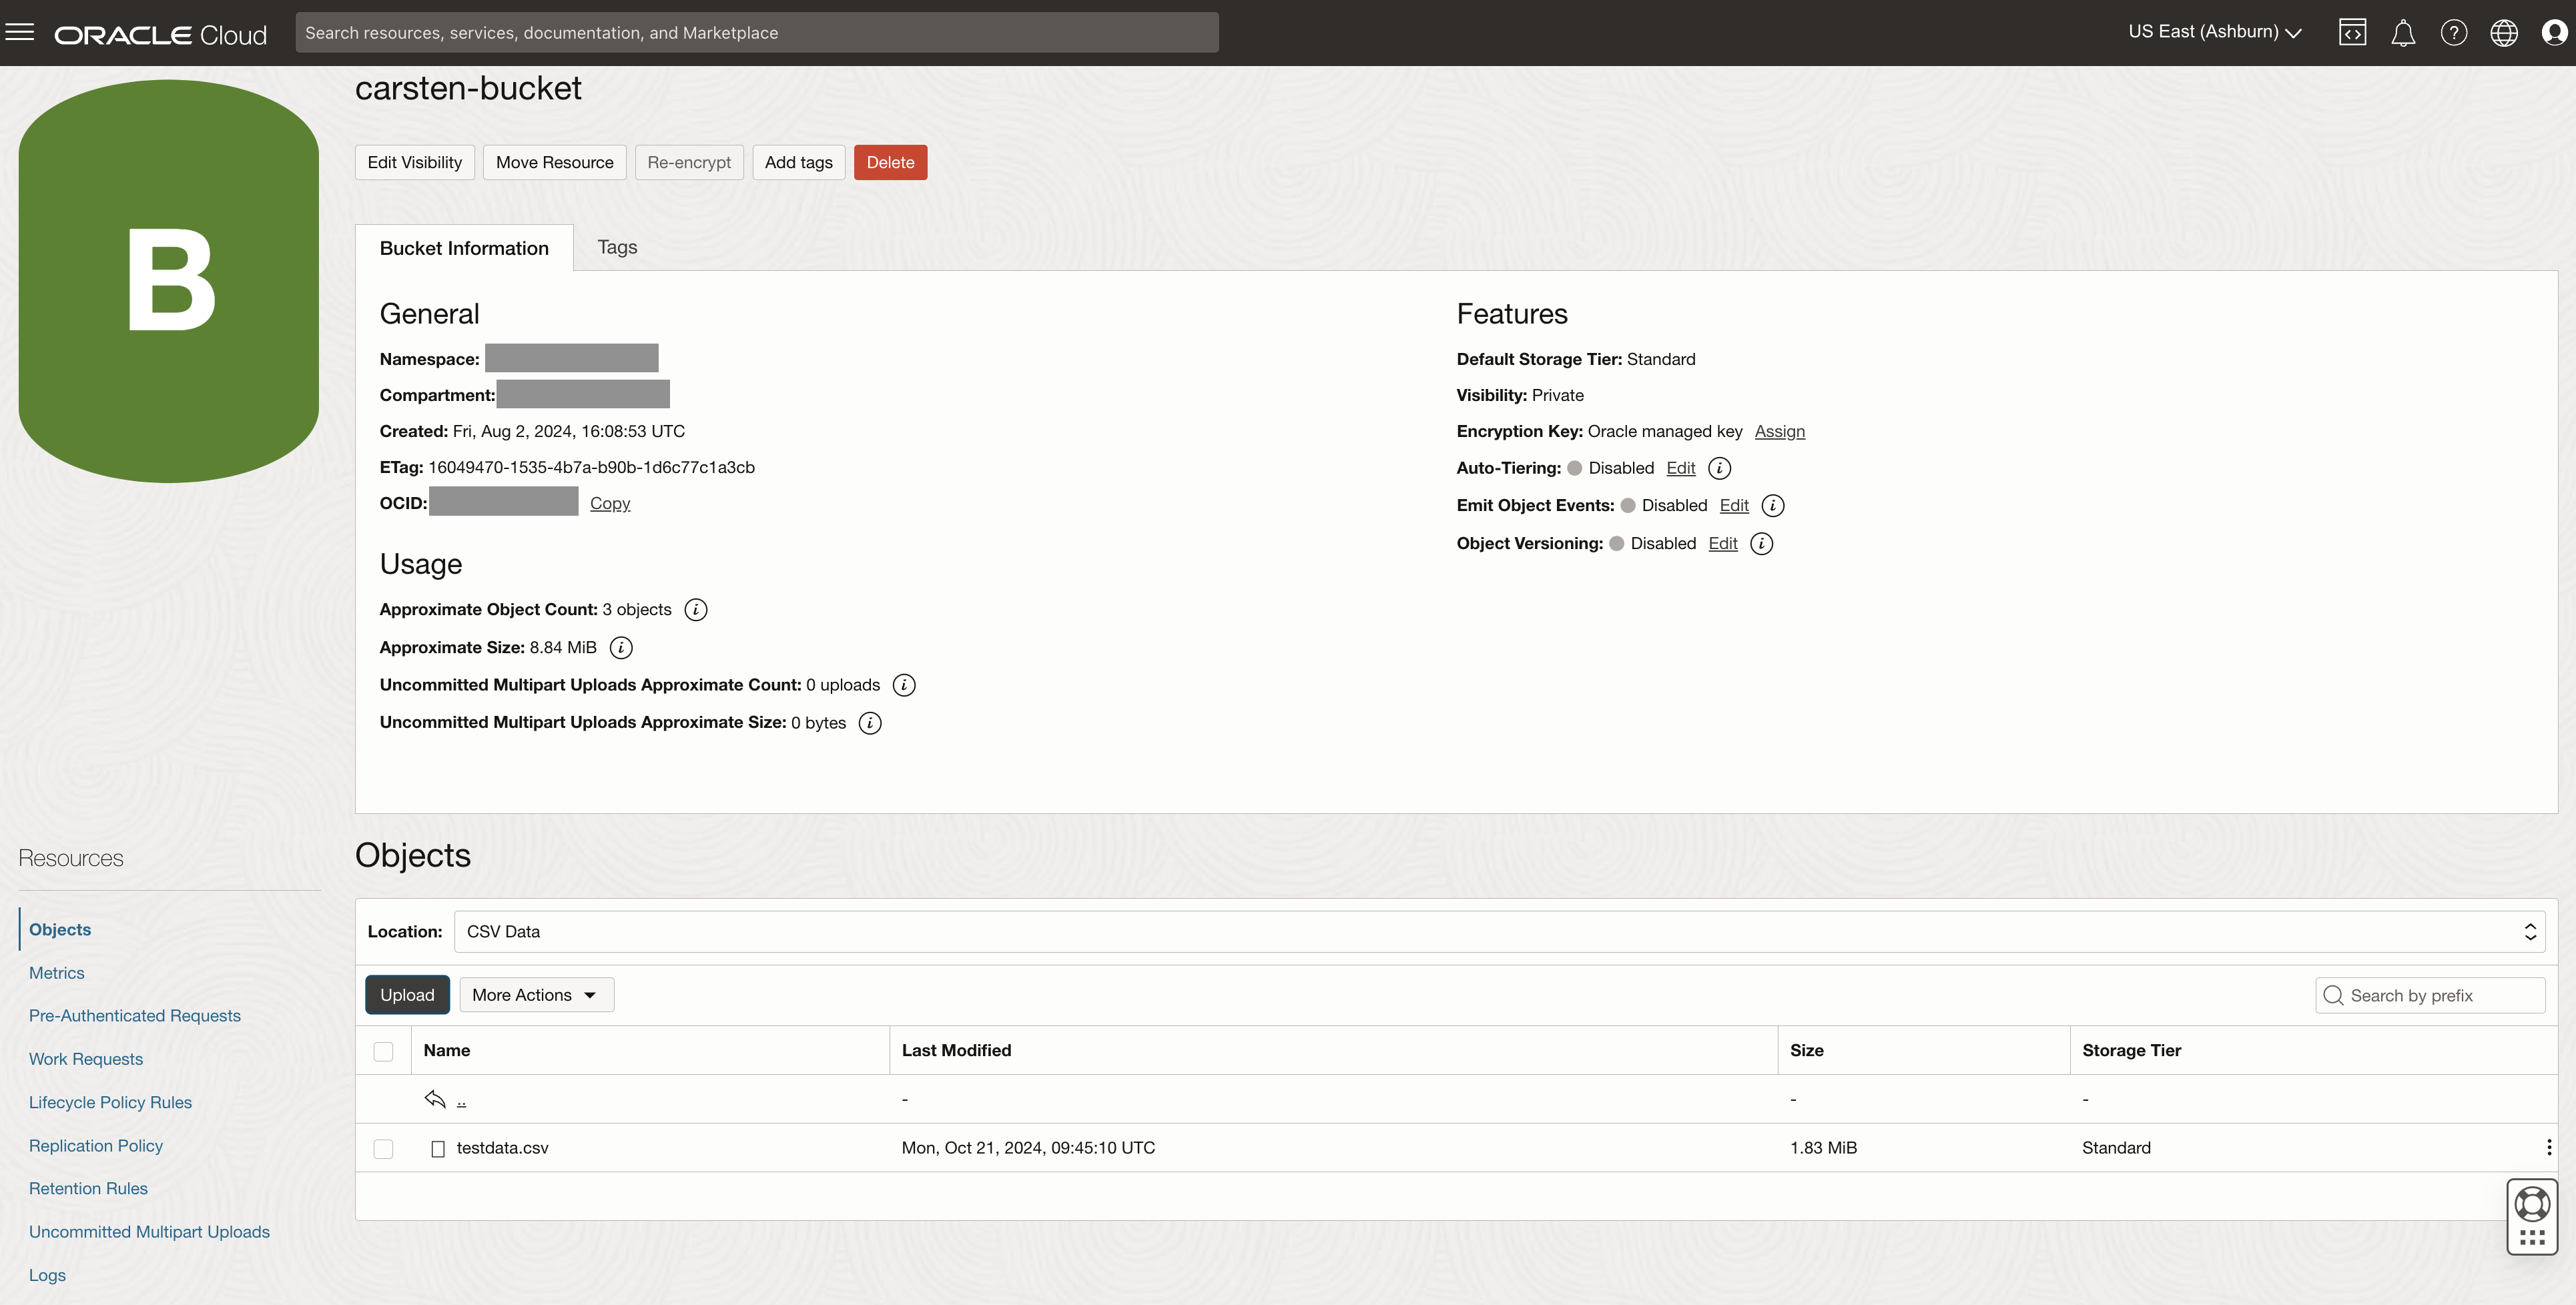
Fig. 1: A CSV file with data to be analyzed is stored in OCI Object Storage Bucket.
For this blog posting, the CSV file was generated with the APEX Data Generator feature, and contains 20,000 rows of “employee sample data”, as shown in Fig. 2. Note that CSV files must have a header line with column names in order for this blog posting to work.
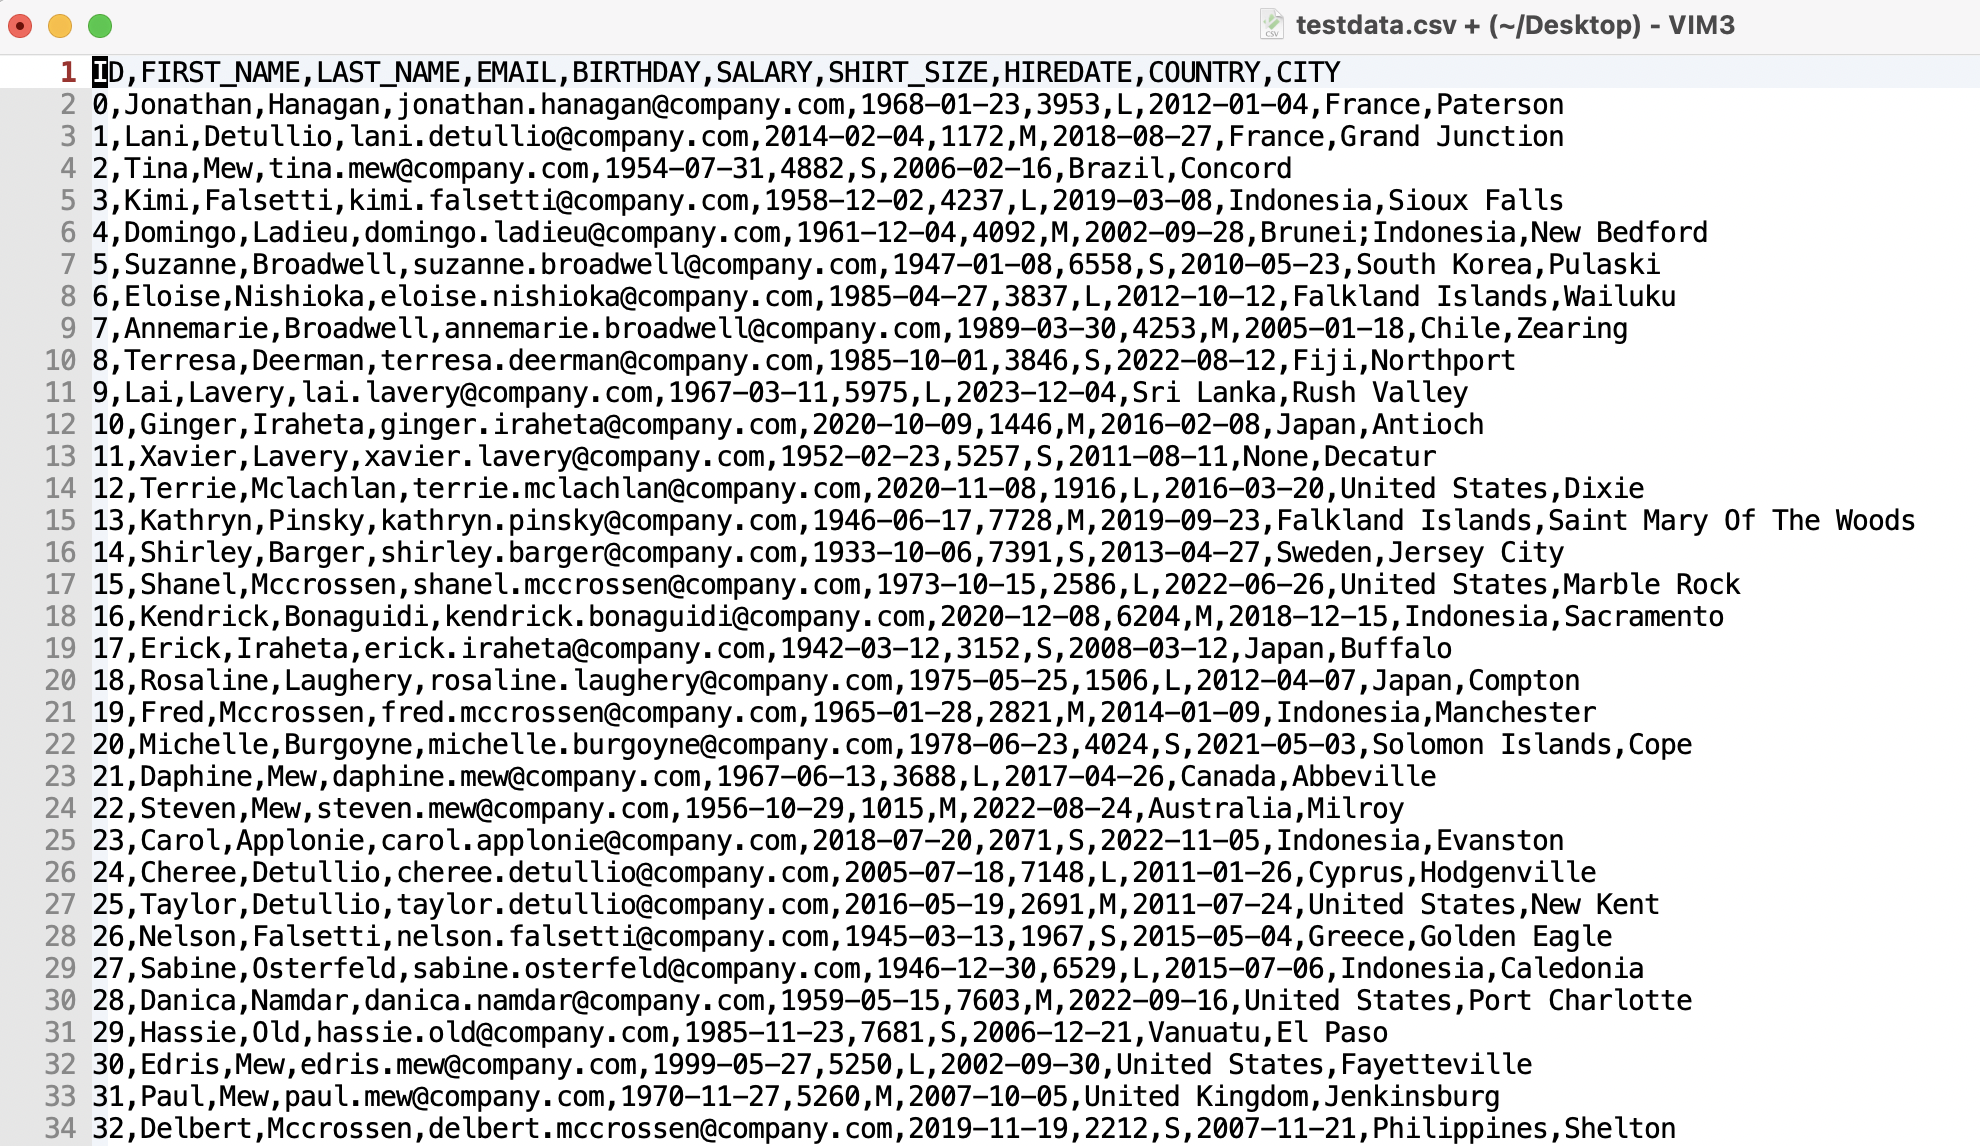
Fig. 2: CSV file with sample data generated for employees.
First, we need to make sure that APEX can access that CSV file. For this, we have two options.
- Create a pre-authenticated request (PAR) URL. With that URL, the file can be access without any further authentication.
- Generate an API key which APEX uses to access Object Store.
The first option is probably the simplest one – especially as we only want to access the file from one application (APEX). We can control the level of access, the PAR persists if a file is re-uploaded and contents are replaced. The PAR has an expiry data, and can be removed, effectively revoking access, if required. To create a PAR, click the “dot-menu” to the right of your file and choose Create Pre-Authenticated Request.
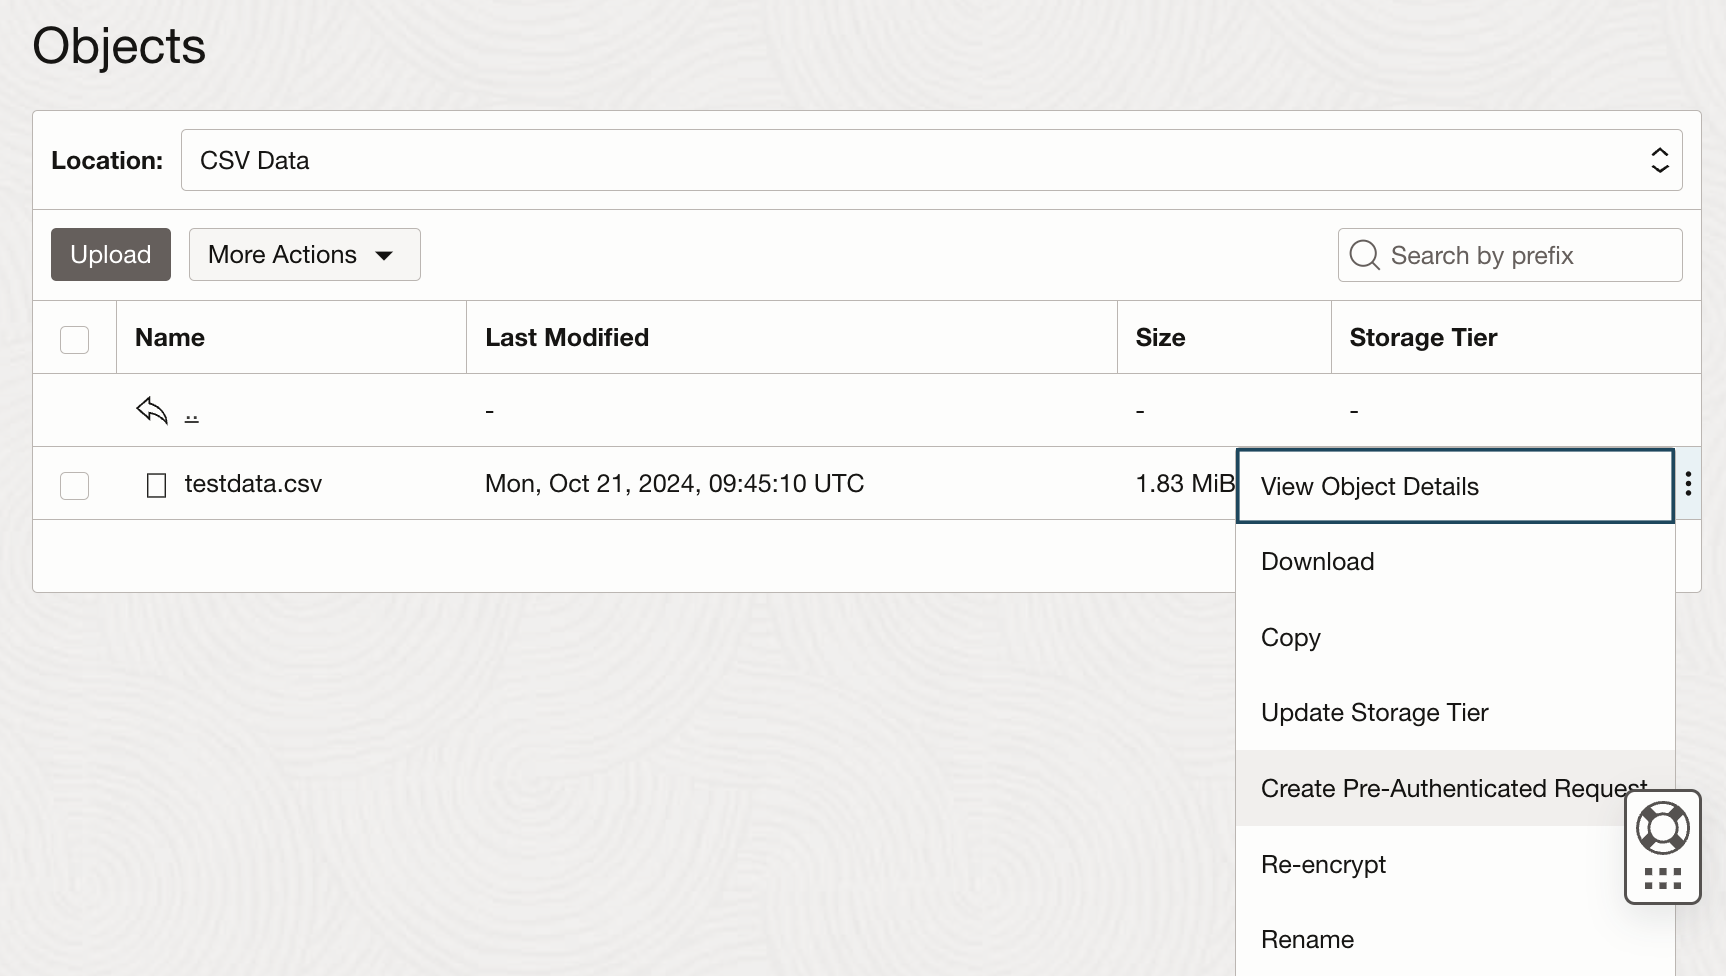
Fig. 3: Creating Pre-Authenticated aka Pre-Auth request for an Object in OCI Bucket.
In this example, we’re creating a PAR which lasts very long, in this case until 2030. We can always replace the file on object store, the PAR will remain valid, so that APEX will always be able to access the latest version of the file. Also make sure to set privileges right; we only need to read the file, so let’s not grant write privileges.
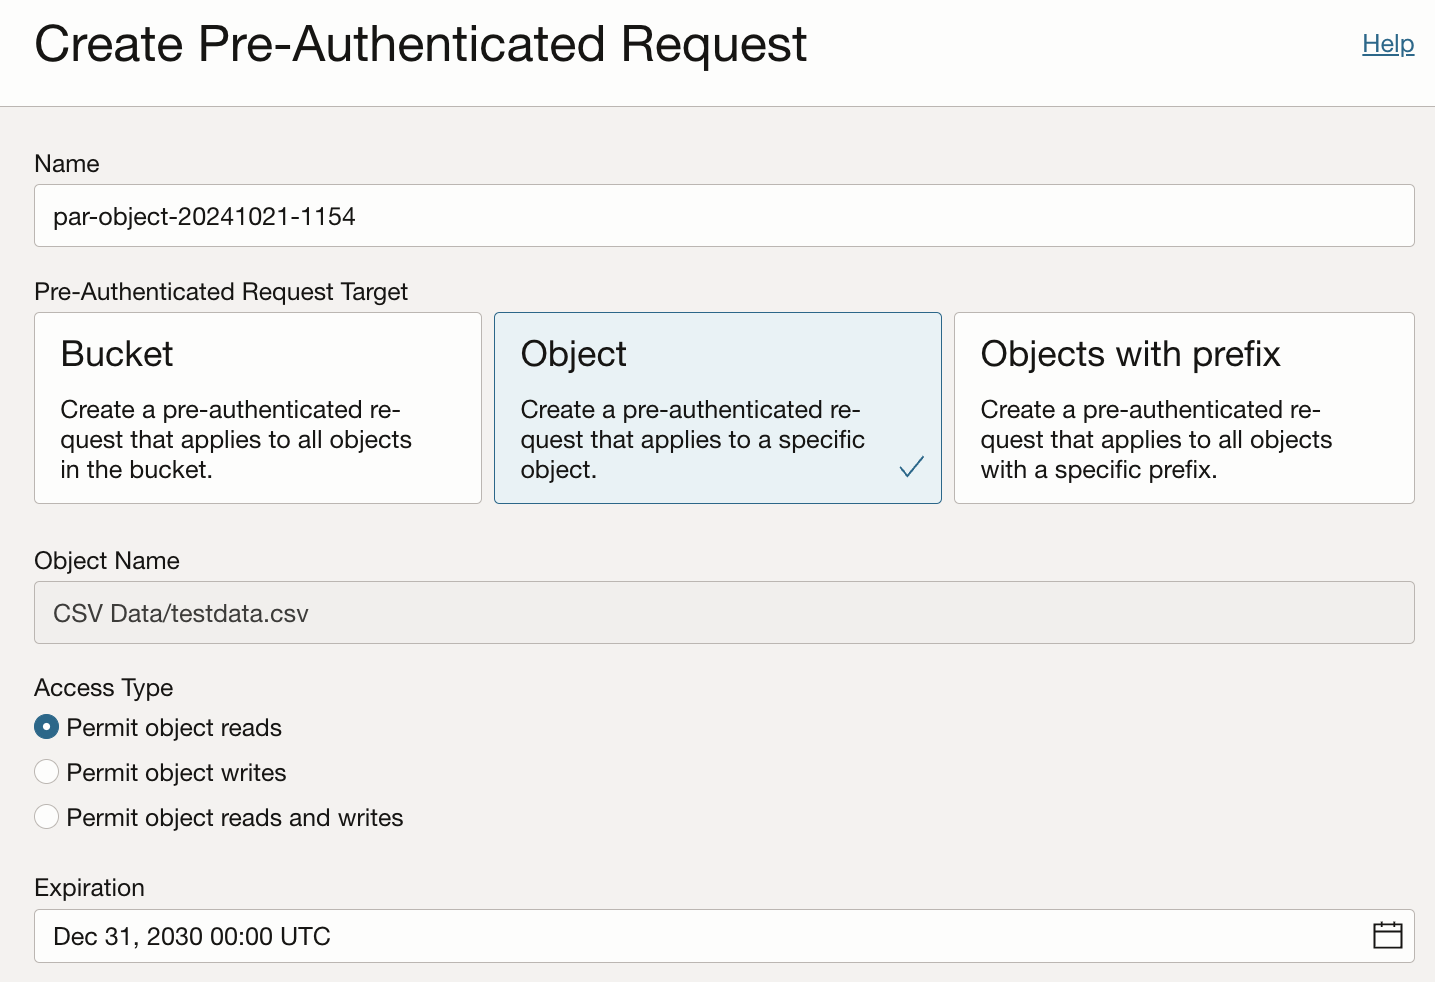
Fig. 4: Creating a Pre-Auth request for an Object with access type and expiration date.
Once the PAR was created, we can review its URL. Note that the URL must be copied right now.
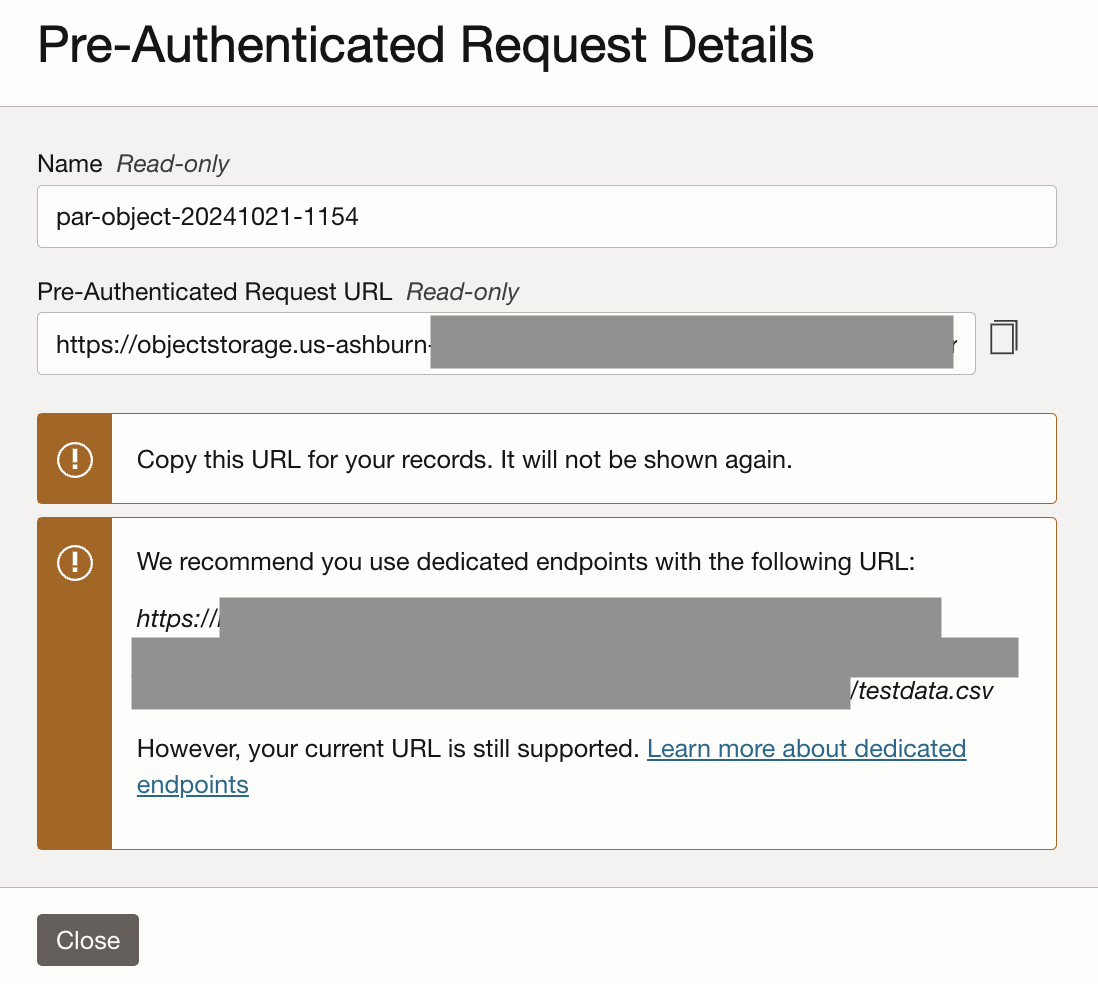
Fig. 5: Generated Pre-Auth request aka PAR URL.
Create an APEX application and a REST Data Source
Now, head over to APEX and log into your workspace. Fig. 6 shows an empty application which has just been created.
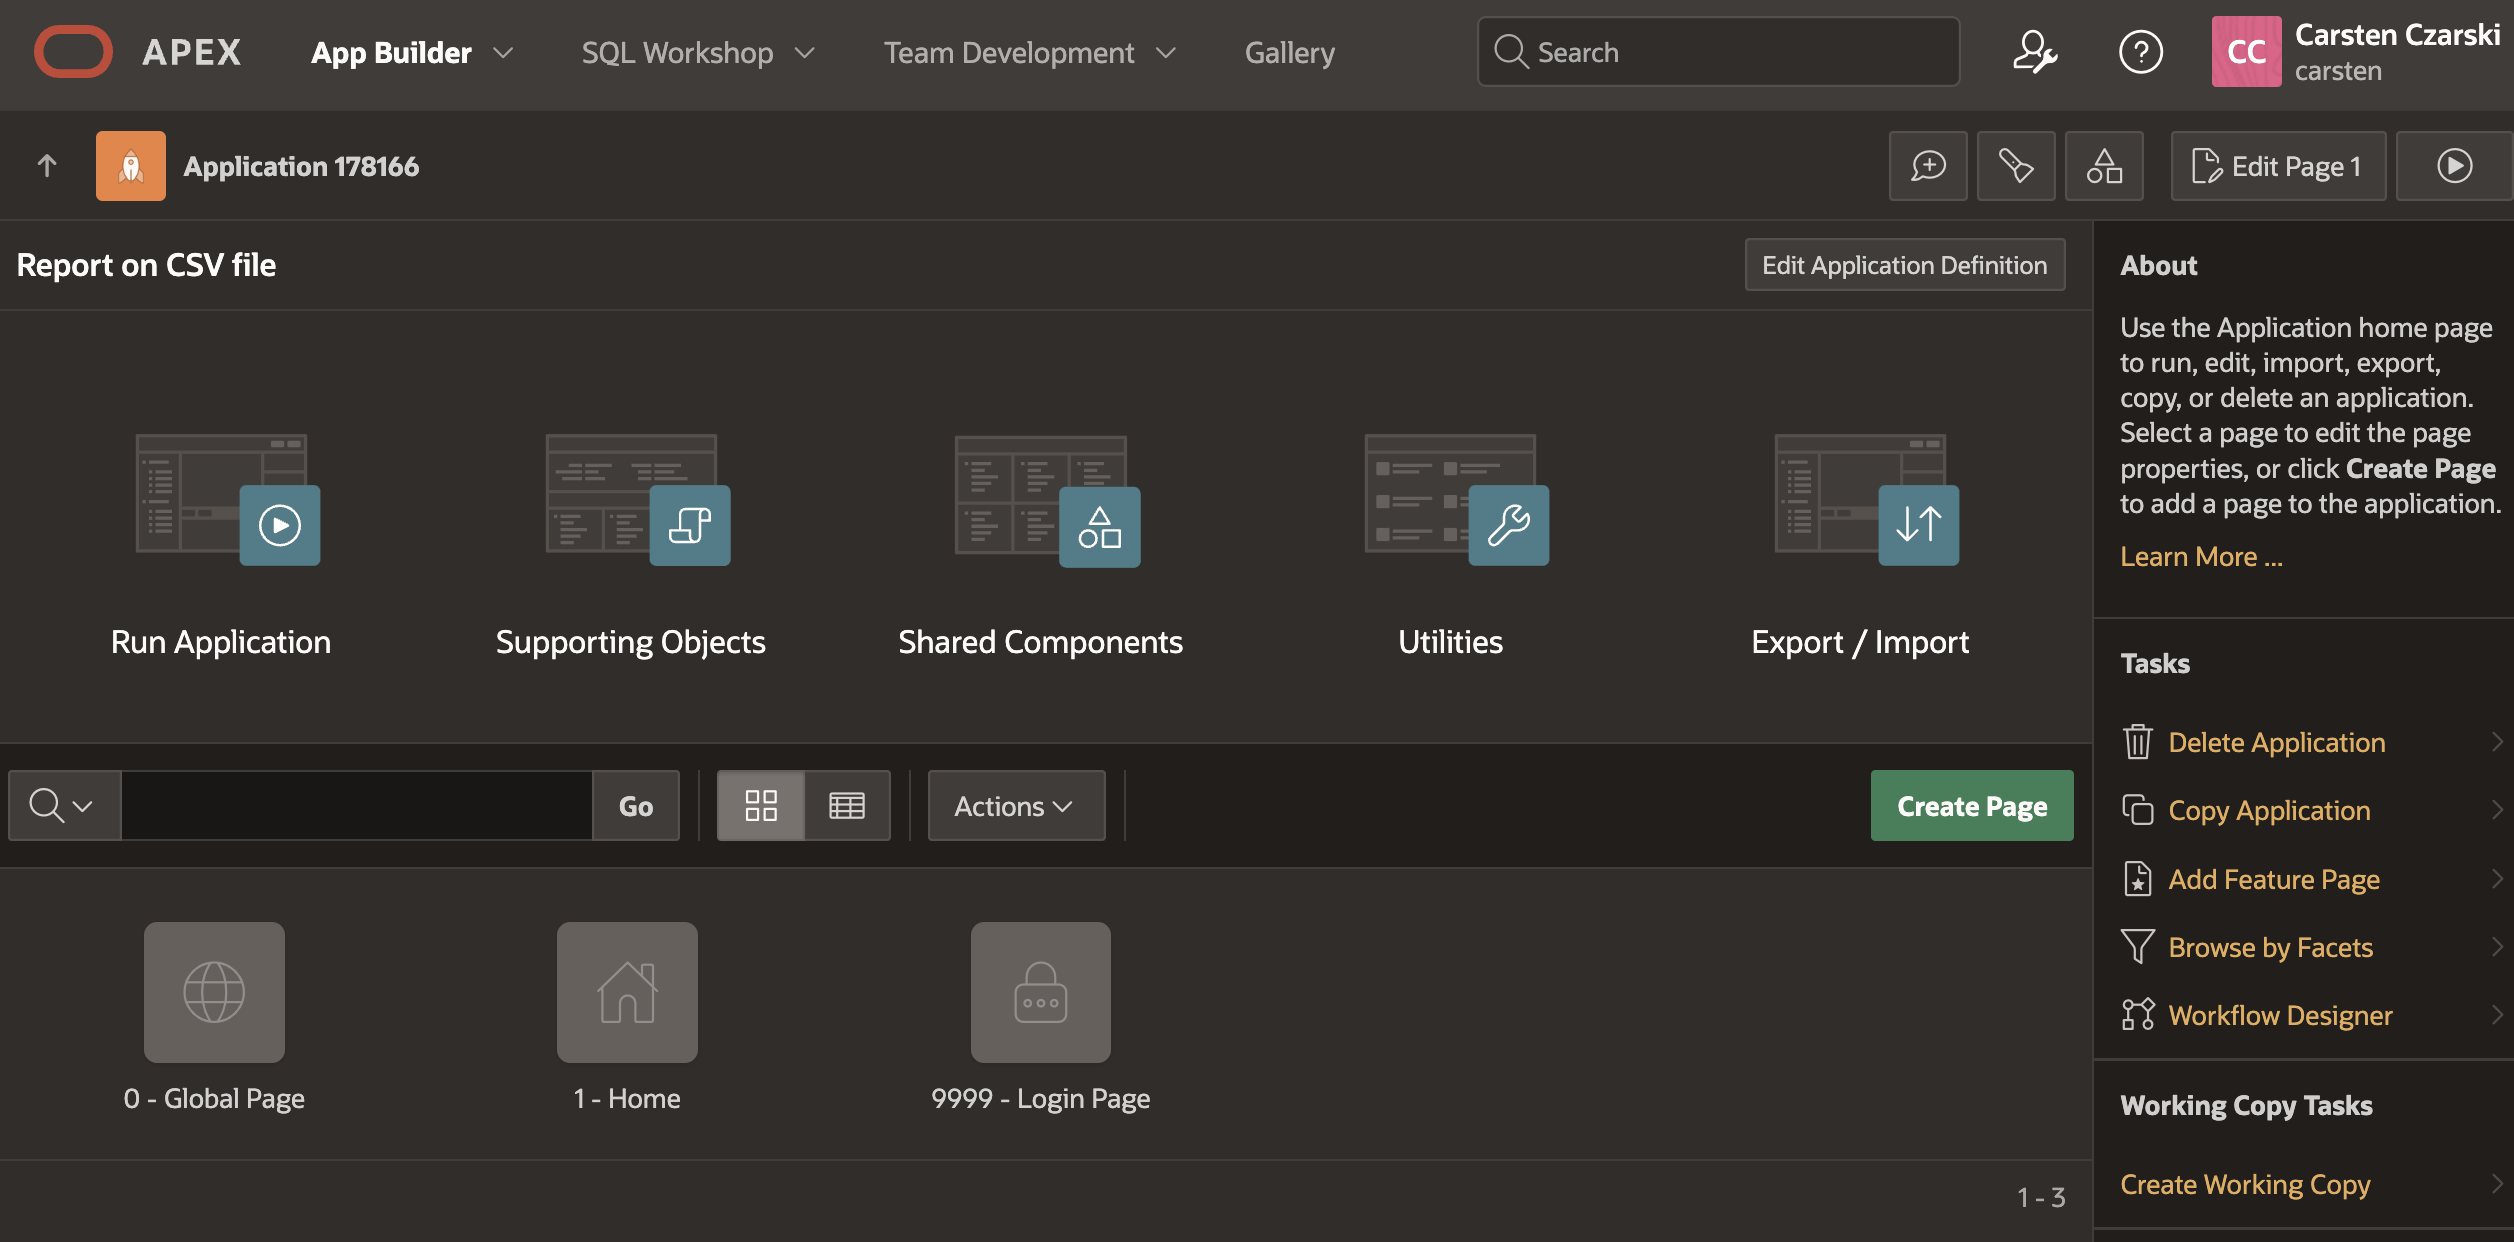
Fig. 6: Simple APEX application.
Navigate to Shared Components, and then look up REST Data Sources in the lower left corner.
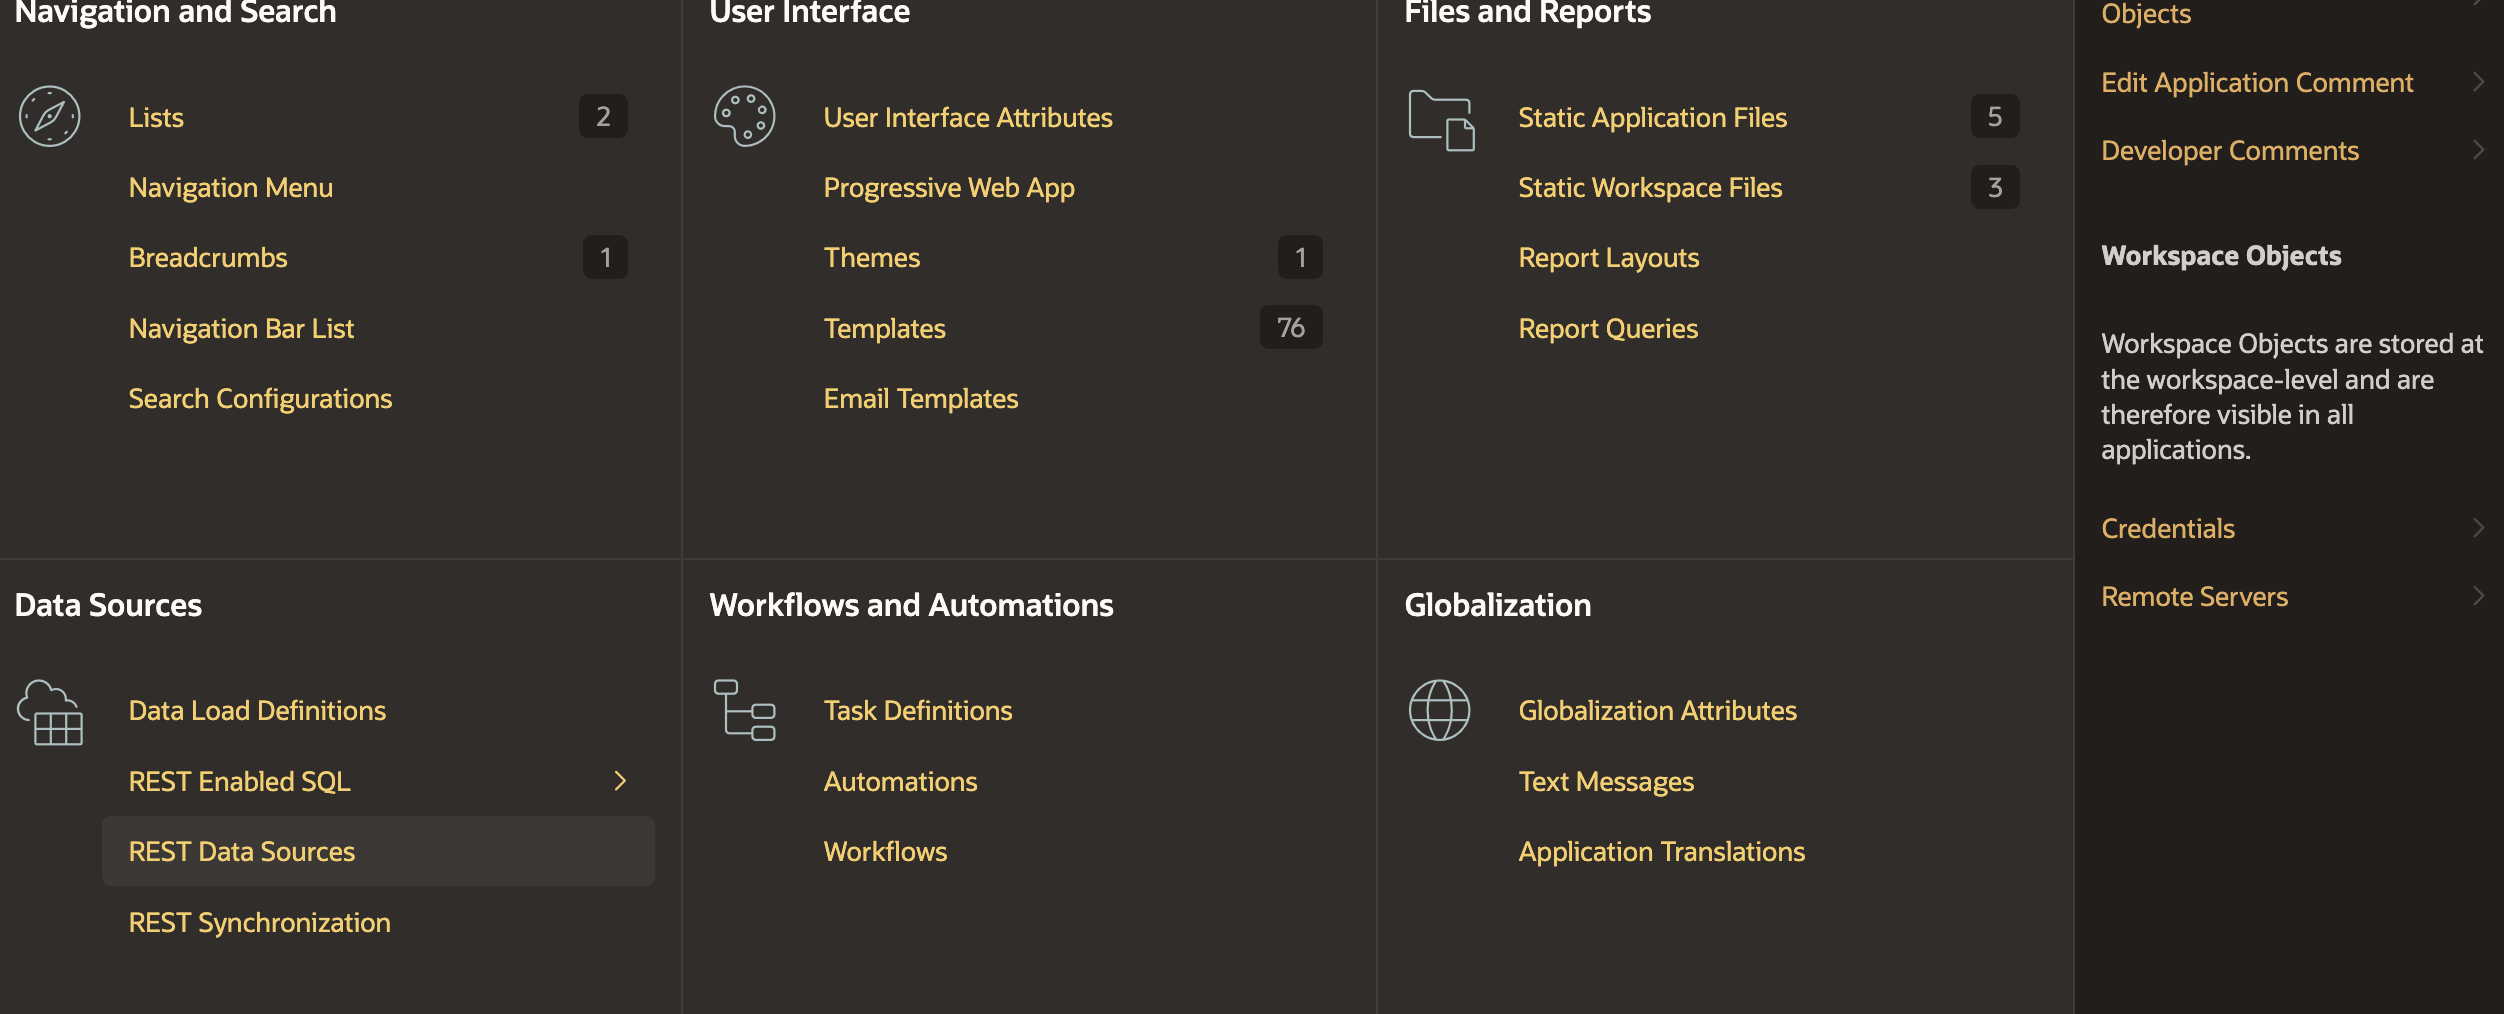
Fig. 7: REST Data Sources within Shared Components.
Now create a REST Data Source. Use the From Scratch method, then the Simple HTTP Type and provide the PAR URL, which you’ve copied and pasted from the Cloud Console page, as the URL Endpoint. Do not use the Oracle Cloud Infrastructure (OCI) REST Source type, as we’re not using the OCI REST APIs; we’re simply grabbing CSV over HTTP. Then click Next.
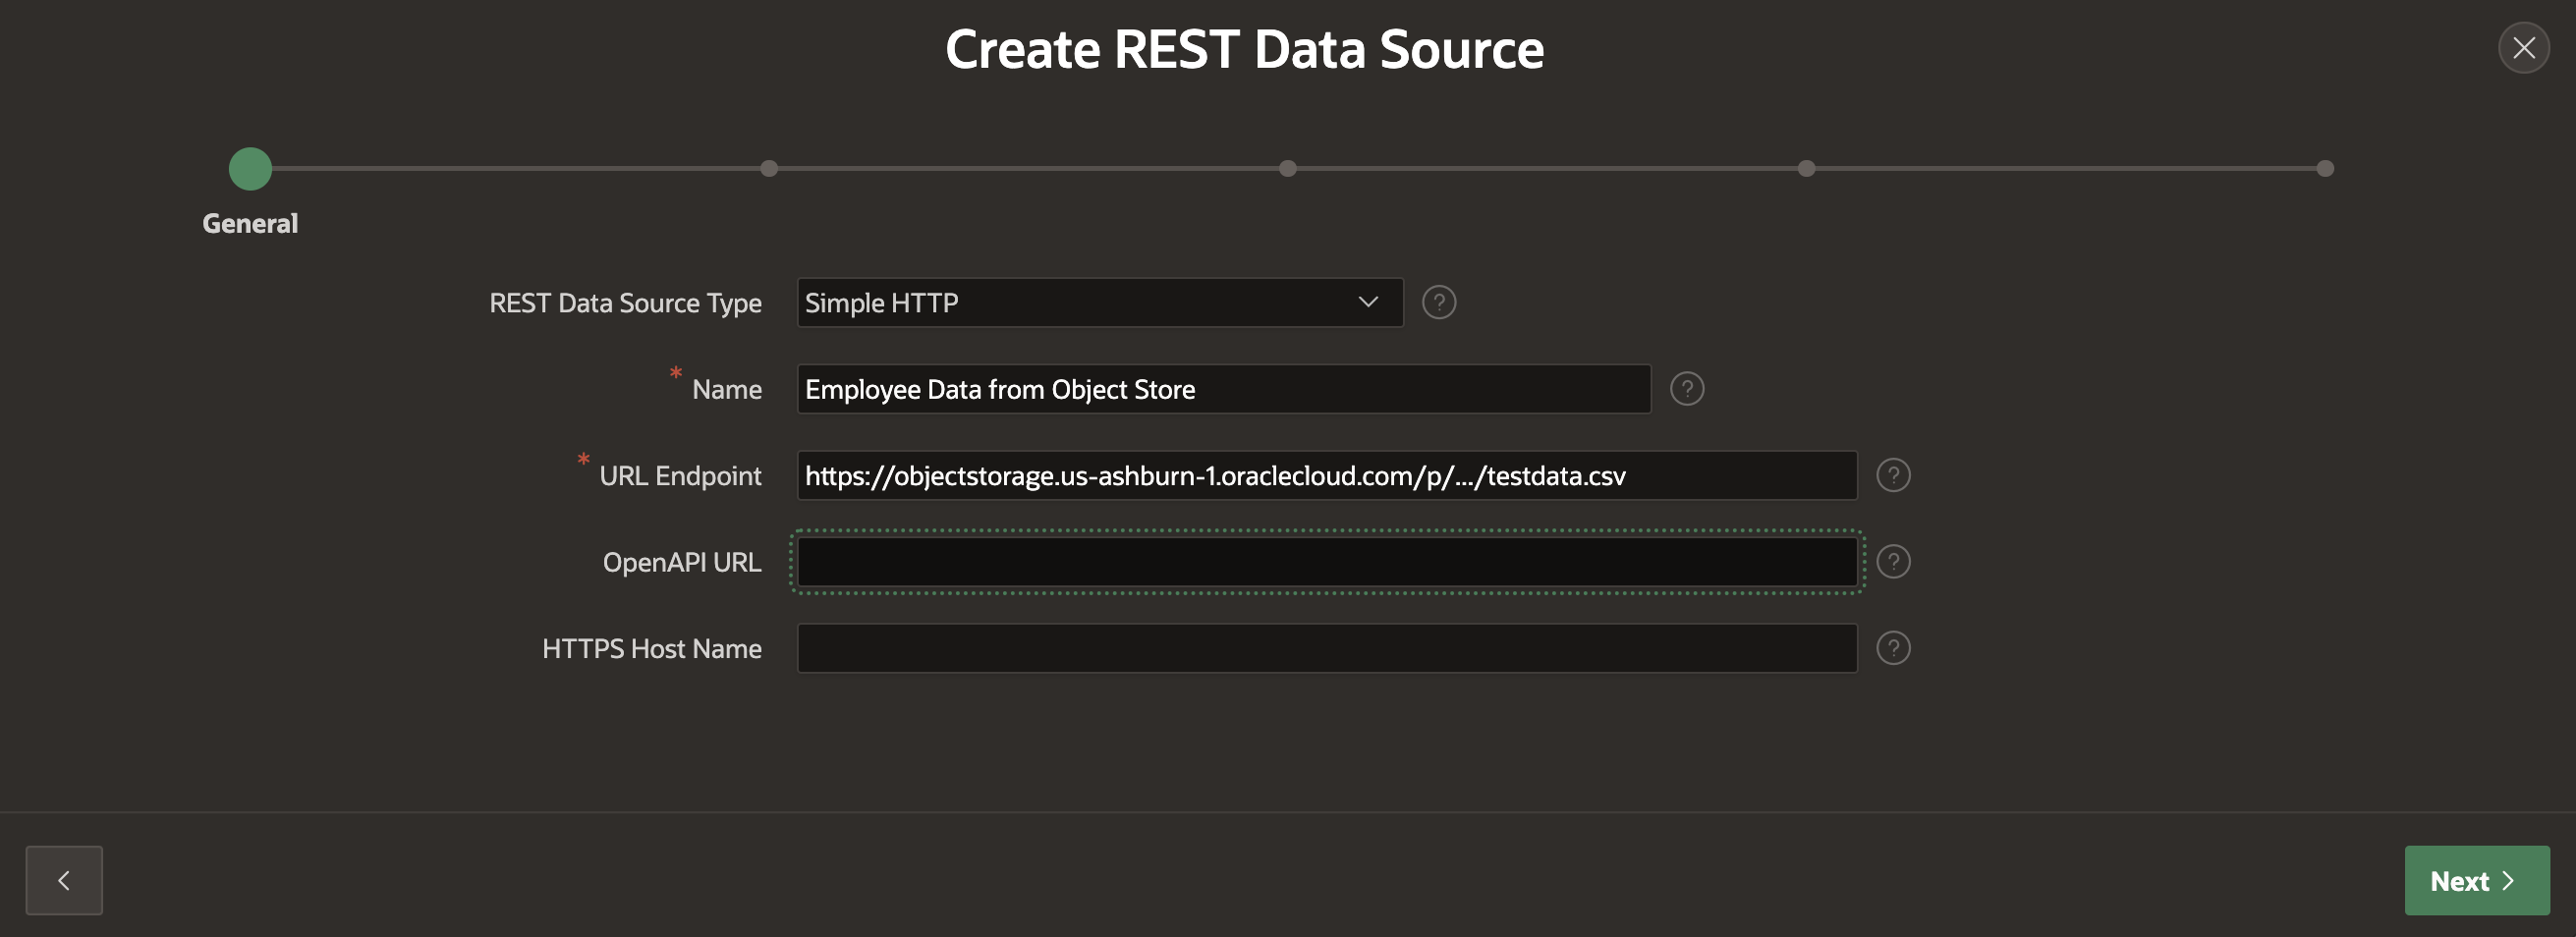
Fig. 8. Configuring PAR URL in Oracle APEX REST Data Source.
The next screen, Remote Server, becomes interesting if you have multiple REST Data Sources, all using URL endpoints from the same server. The first part of the URL, the Remote Server is stored as its own entity in APEX, which makes it easy to change a full collection of REST Data Sources to use a different server. That is particularly interesting for Development, Test or Production environments. If needed, make adjustments, then click Next.
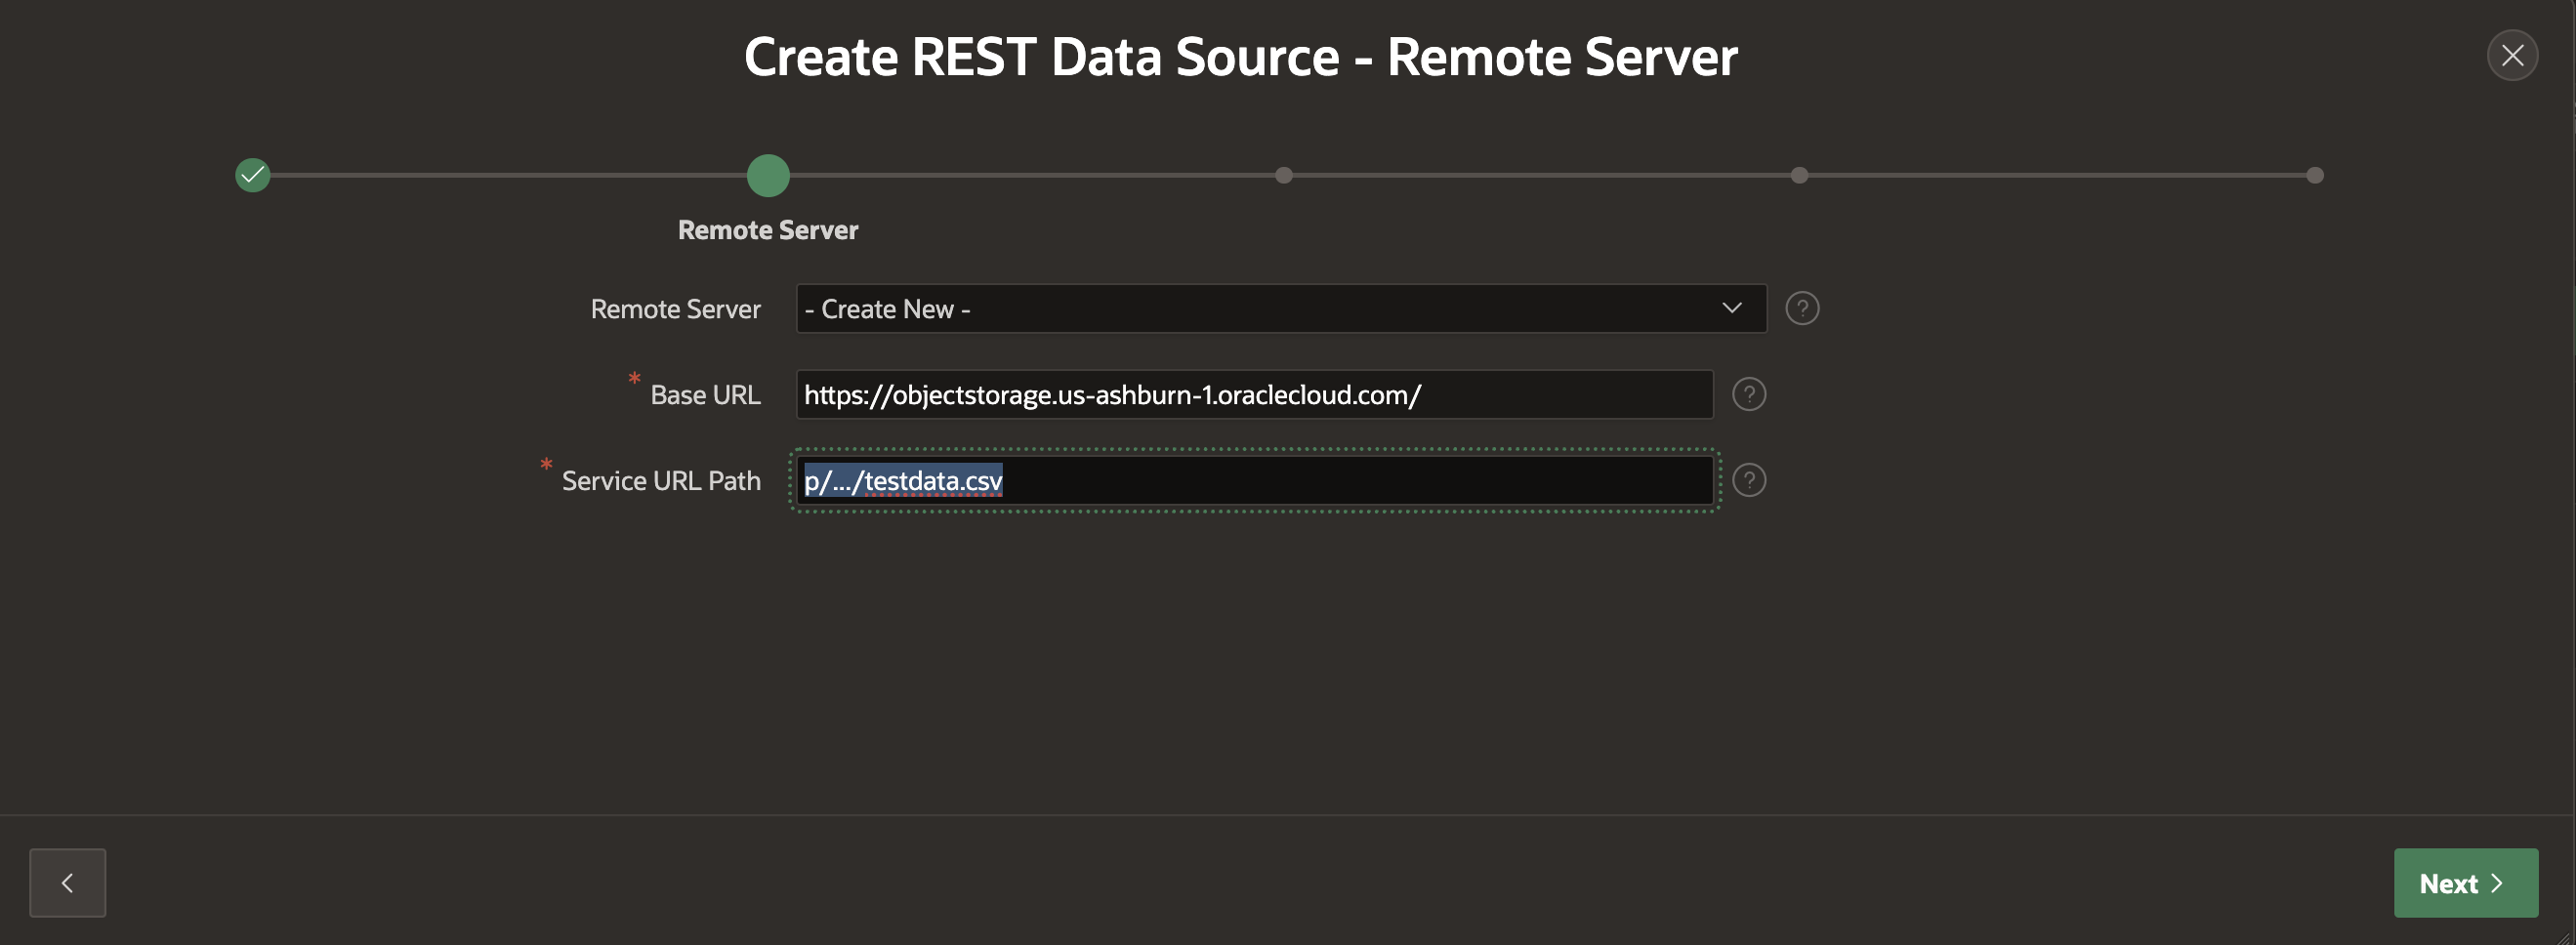
Fig. 9: Configure the Remote Server part of the REST Data Source URL Endpoint.
On the next screen, it is possible to configure Pagination settings for a REST API. For CSV this is not required, so simply click Next.
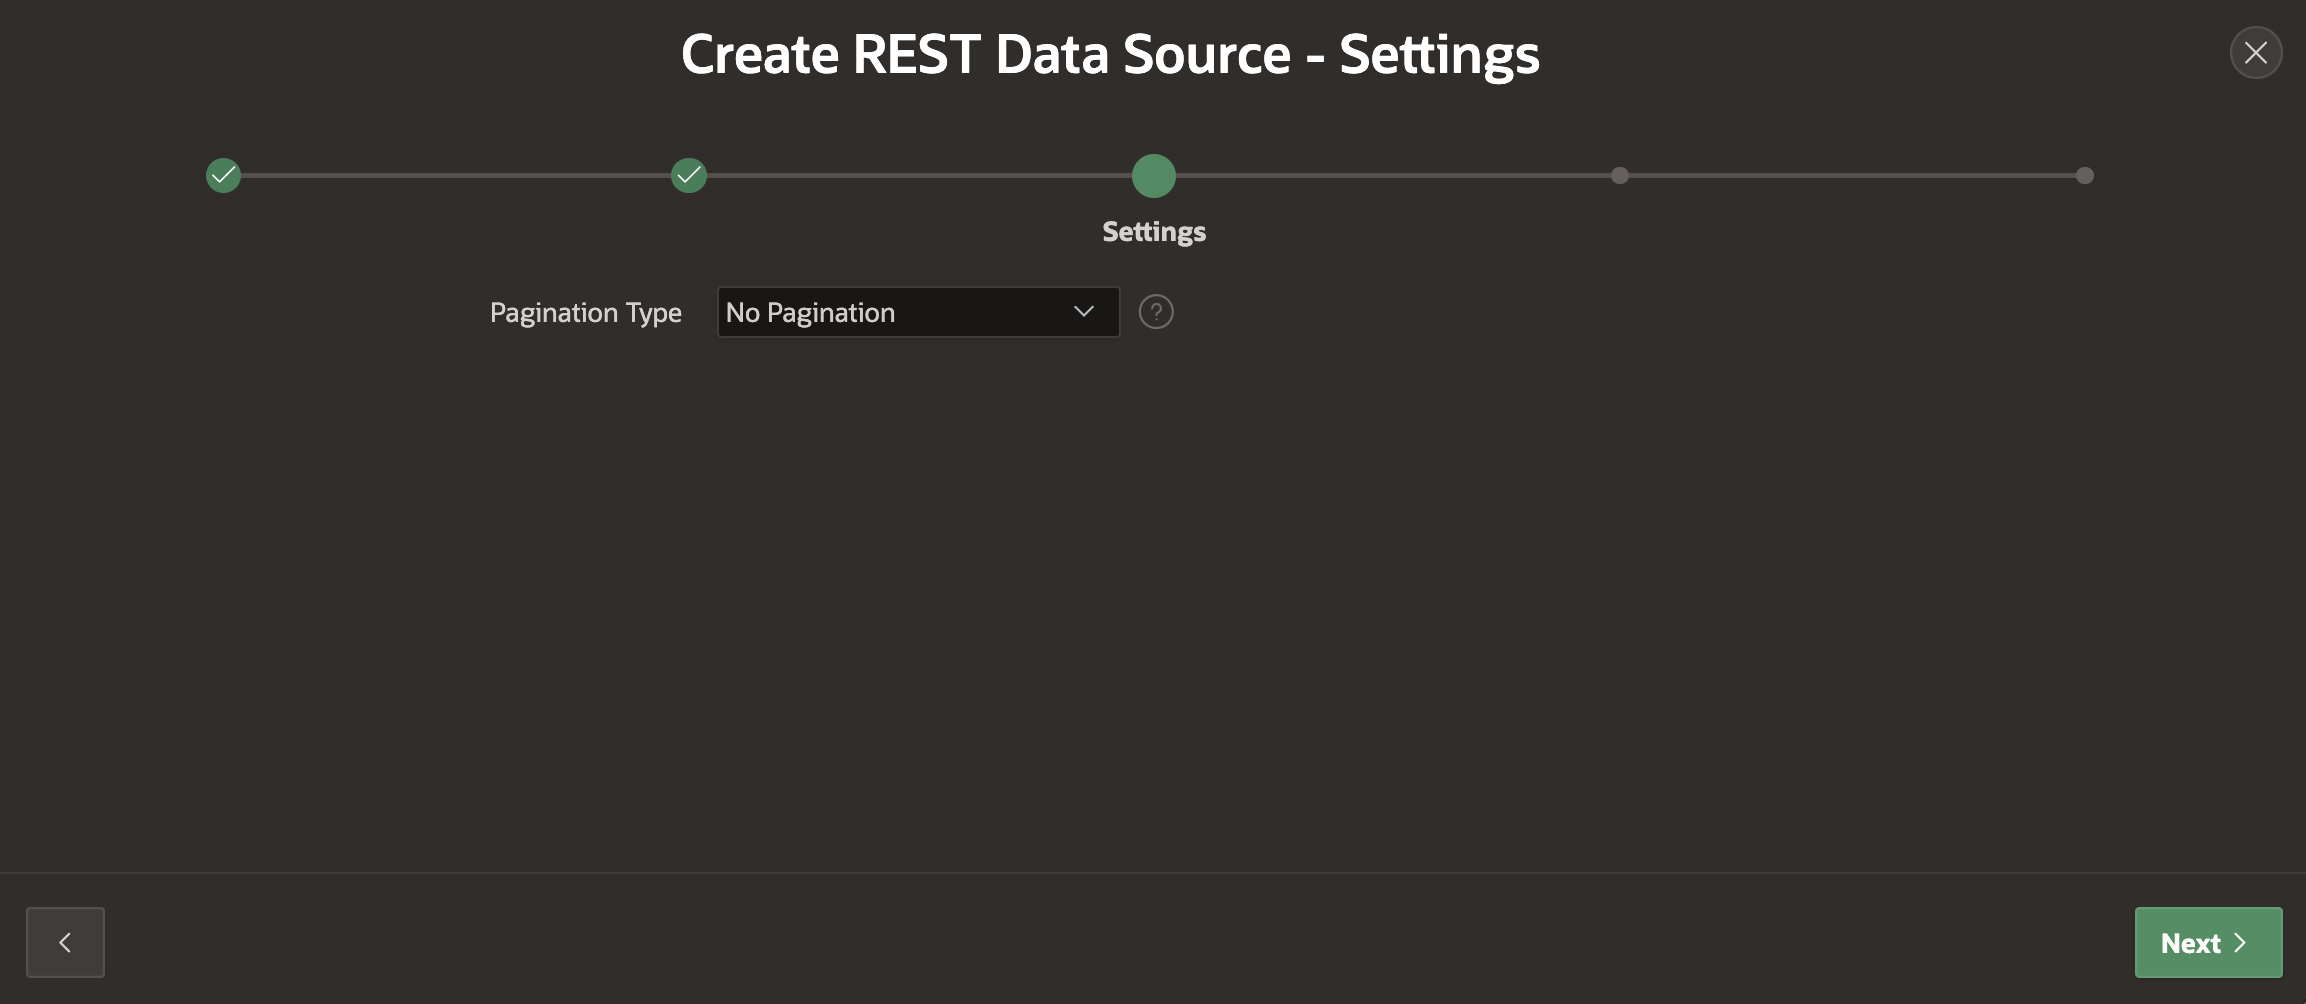
Fig. 10: Pagination type settings on Oracle APEX REST Data Source configuration page.
On the Authentication wizard step, we could provide credentials to authenticate against the server. If we used OCI API Keys for authentication, we would need to configure these for APEX here. However, we’re using a PAR instead, where the URL already contains the authentication information. So, nothing needs to be configured here; simply click Discover to finalize the REST Data Source creation.
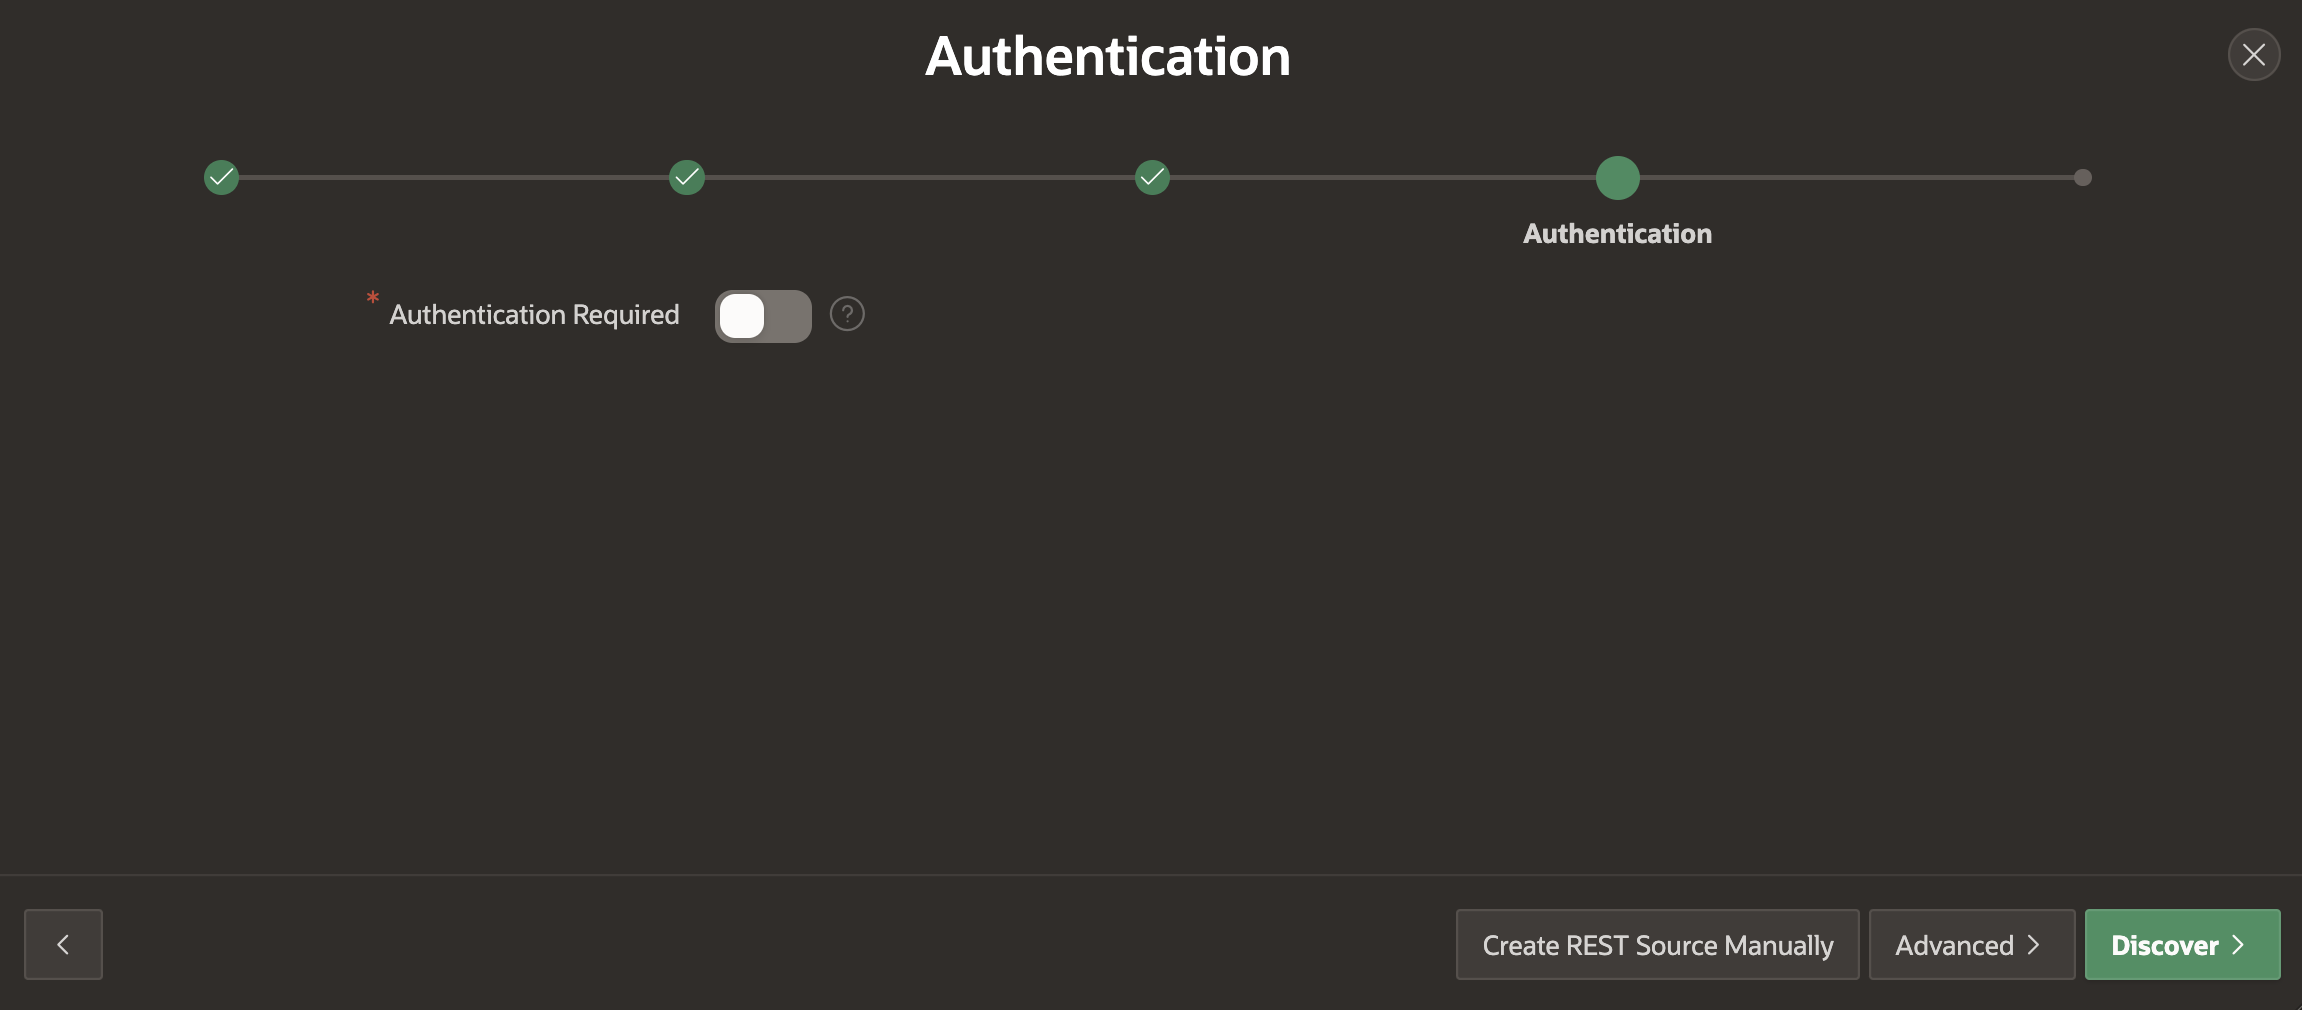
Fig. 11: Authentication details for a new REST Data Source.
APEX will now invoke the URL endpoint, download data and it will attempt to derive a data structure. CSV, JSON or XML files will be automatically detected. APEX then parses the first 200 rows, investigates the data and derives a structure, which is called the Data Profile. Based on this computed data profile, APEX parses the file and shows a Preview, so that we can see whether APEX can work fine with our CSV file.
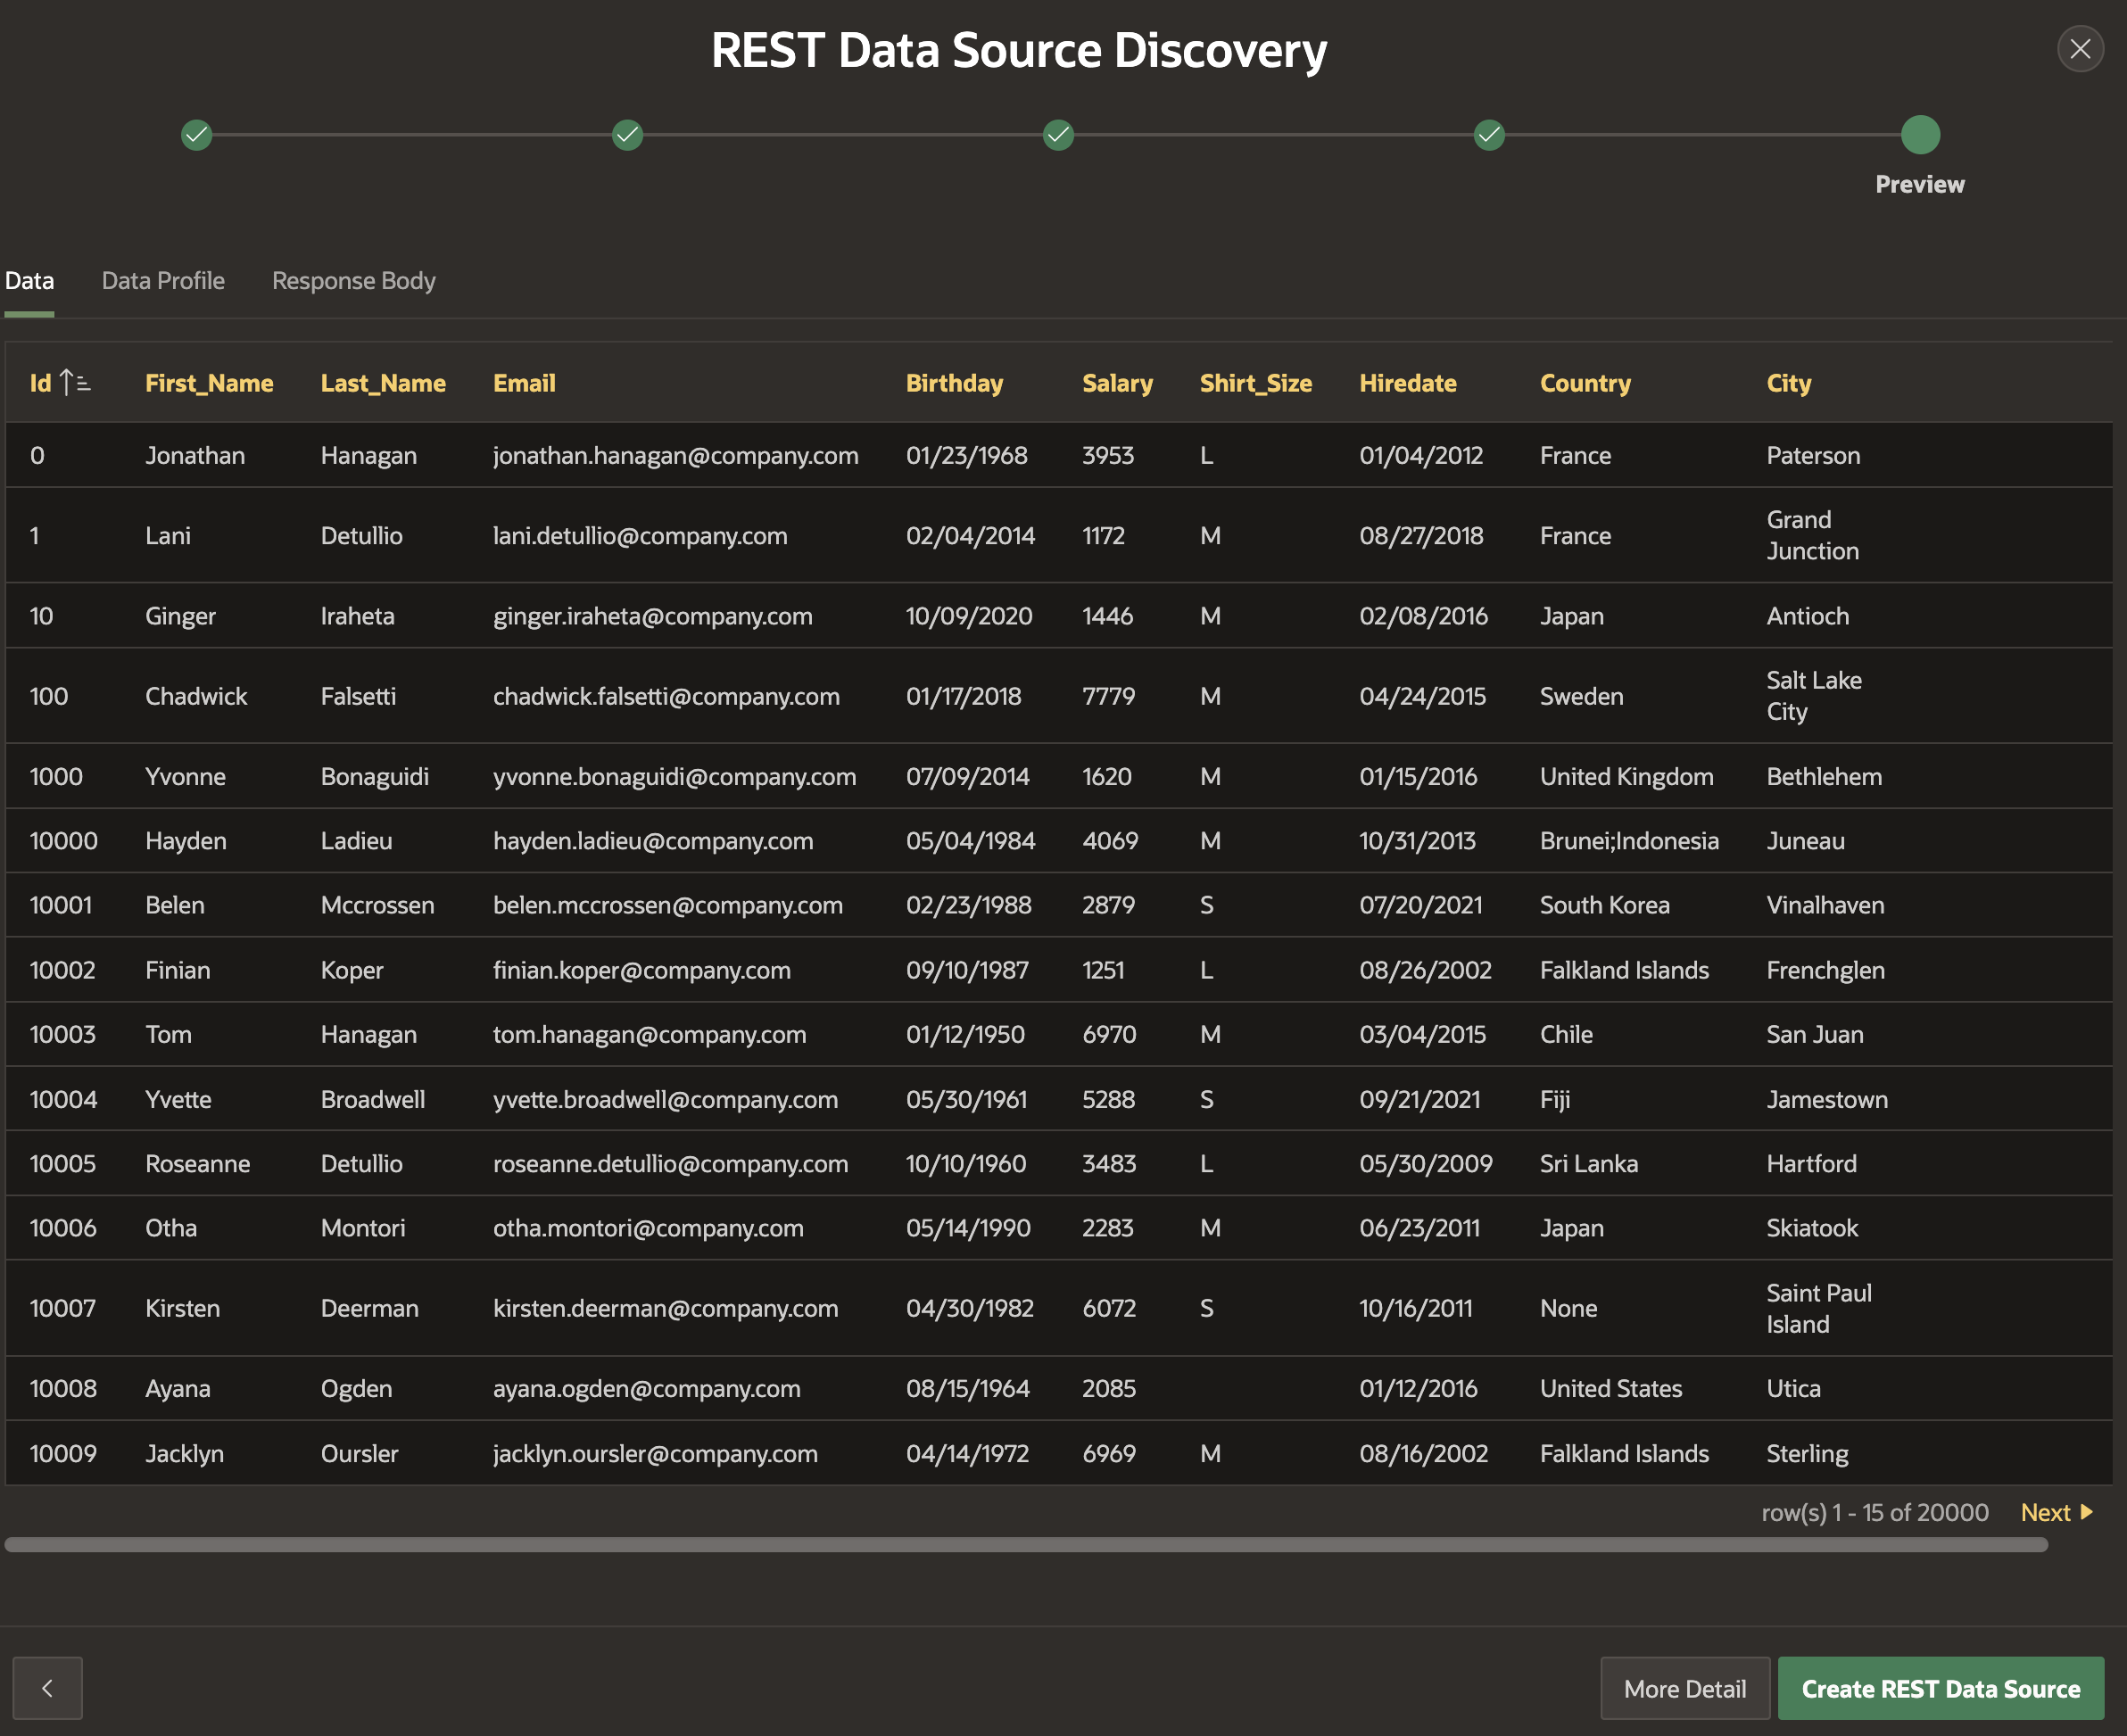
Fig. 12: The data preview shows that the CSV file can be parsed by APEX.
Finally click the Create REST Data Source button in order to save the new REST Source. Fig. 13 shows the newly created REST Source within Shared Components, REST Data Sources.
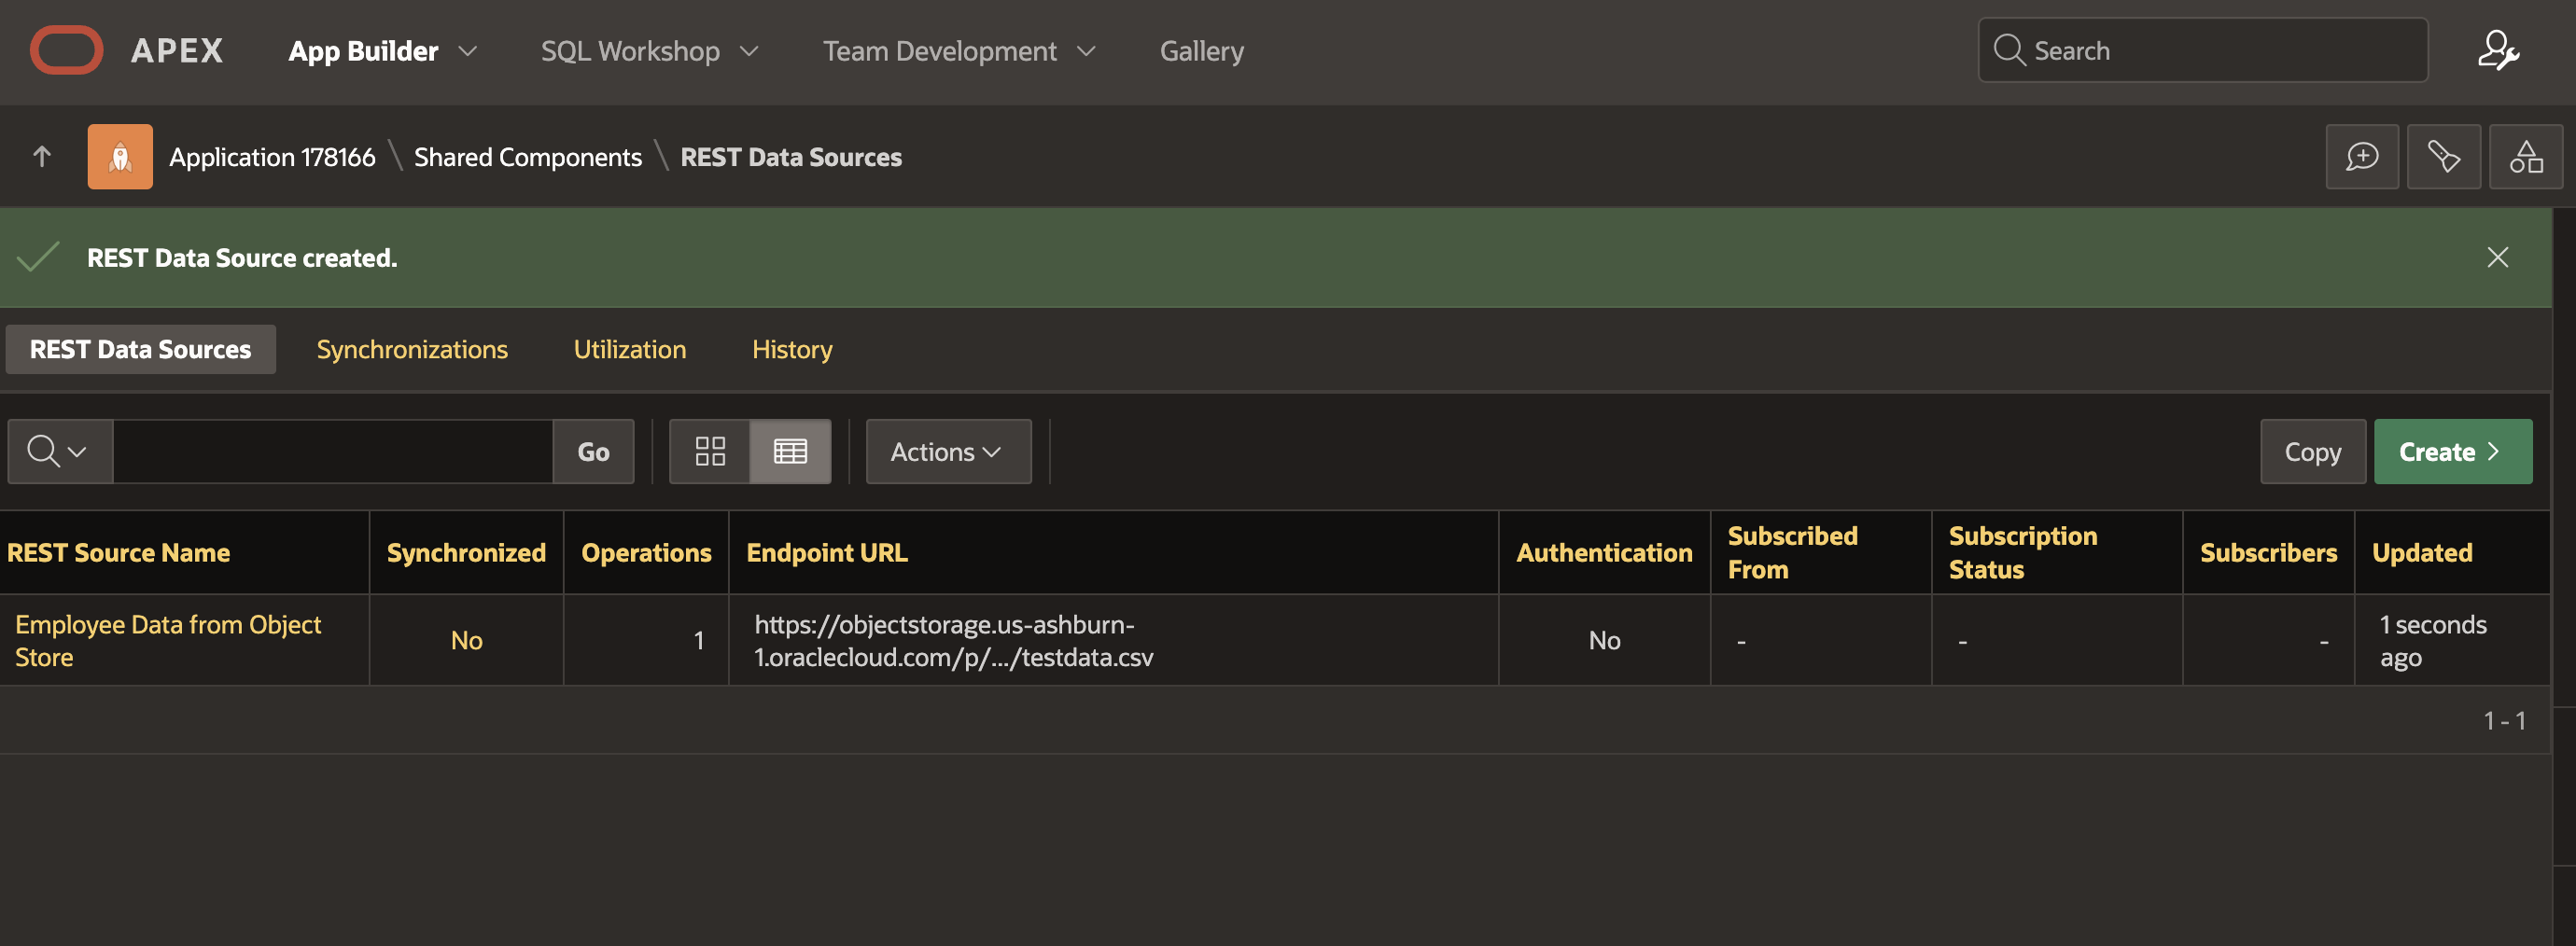
Fig. 13: The new REST Data Source has been created.
Create pages and visualize data
Now it’s time to use the new REST Data Source. Navigate to the page overview of your application and click the Create button to add a new page to your application. Choose Interactive Report.
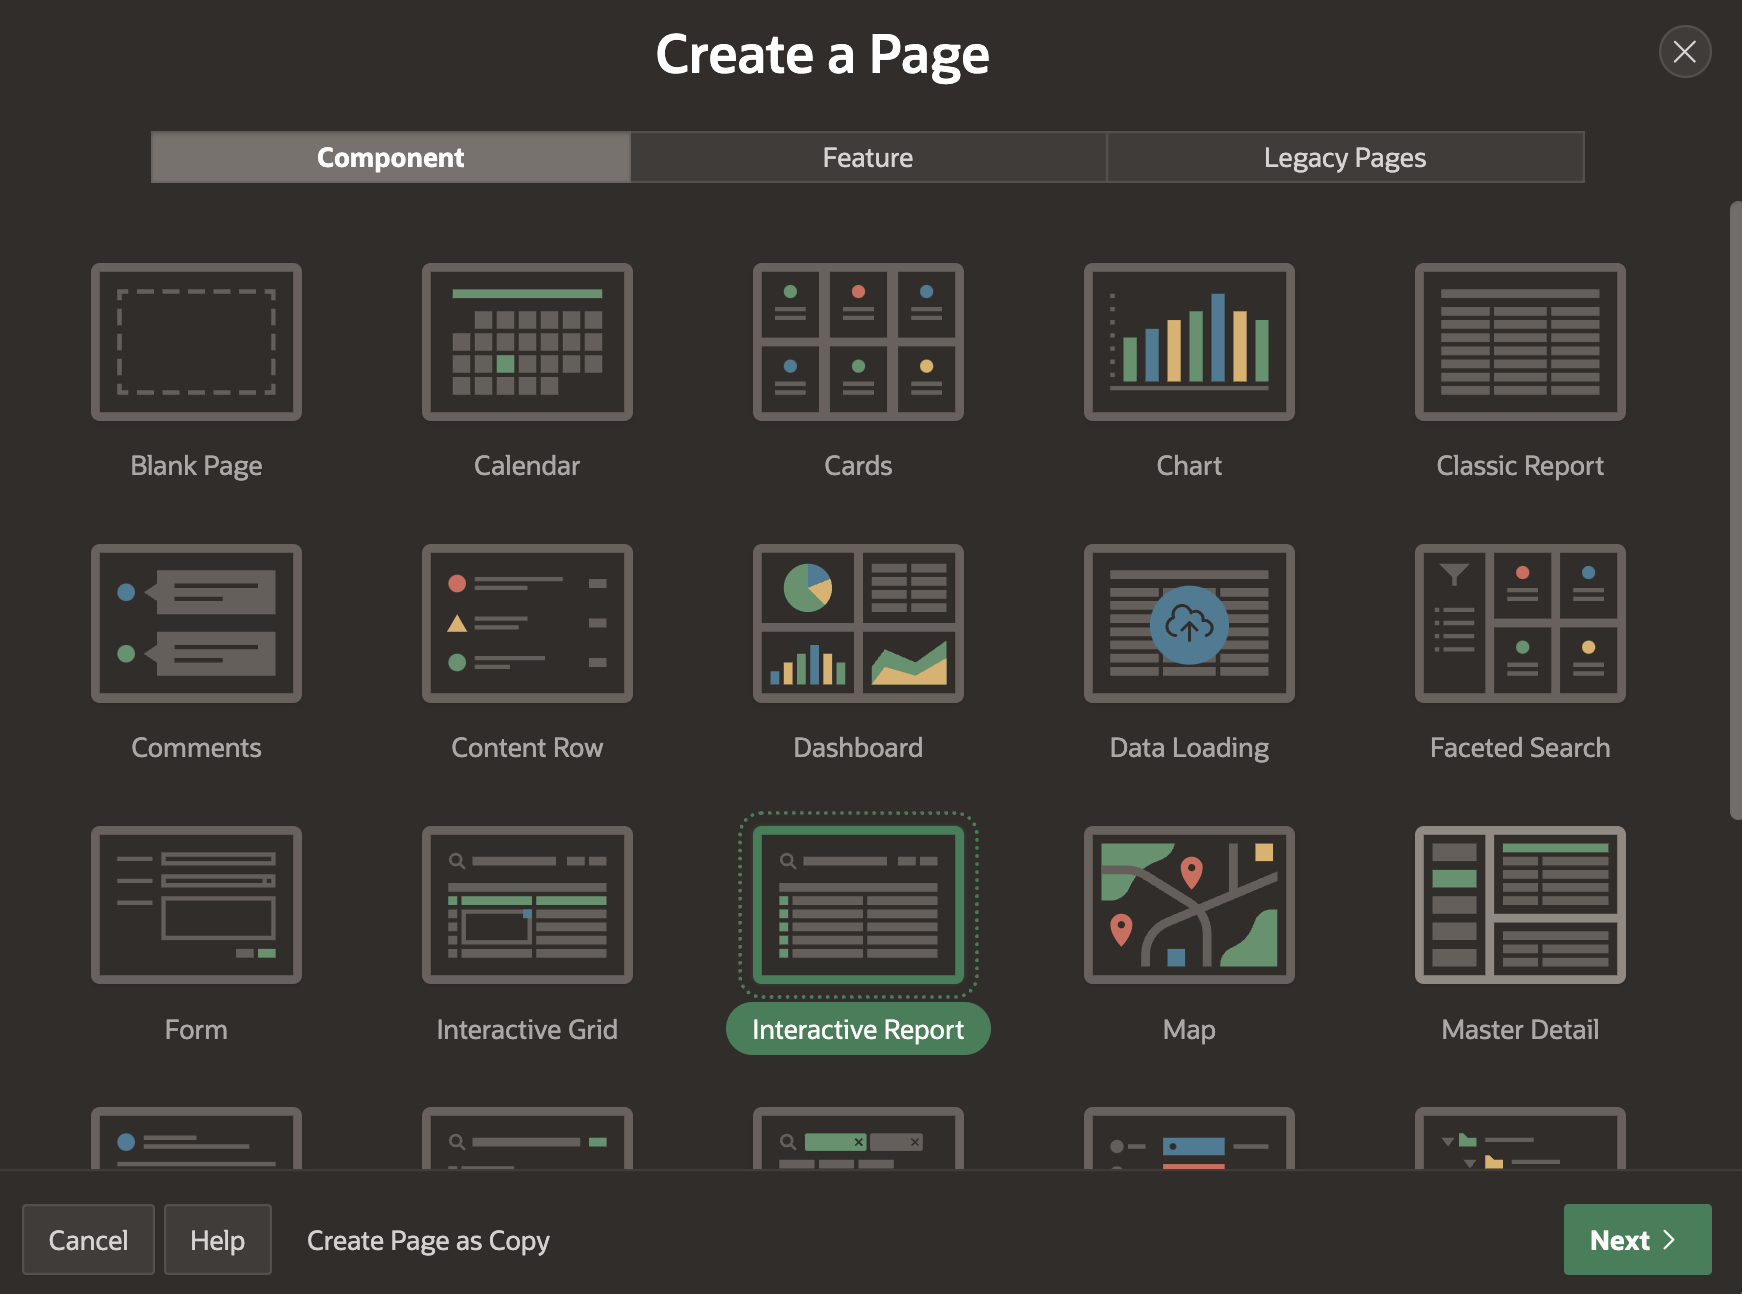
Fig. 14: Creating an Interactive Report page using Create Page Wizard.
Then provide a name for your new page, and configure the Data Source. Pick REST Data Source and choose the REST Source you’ve just created.
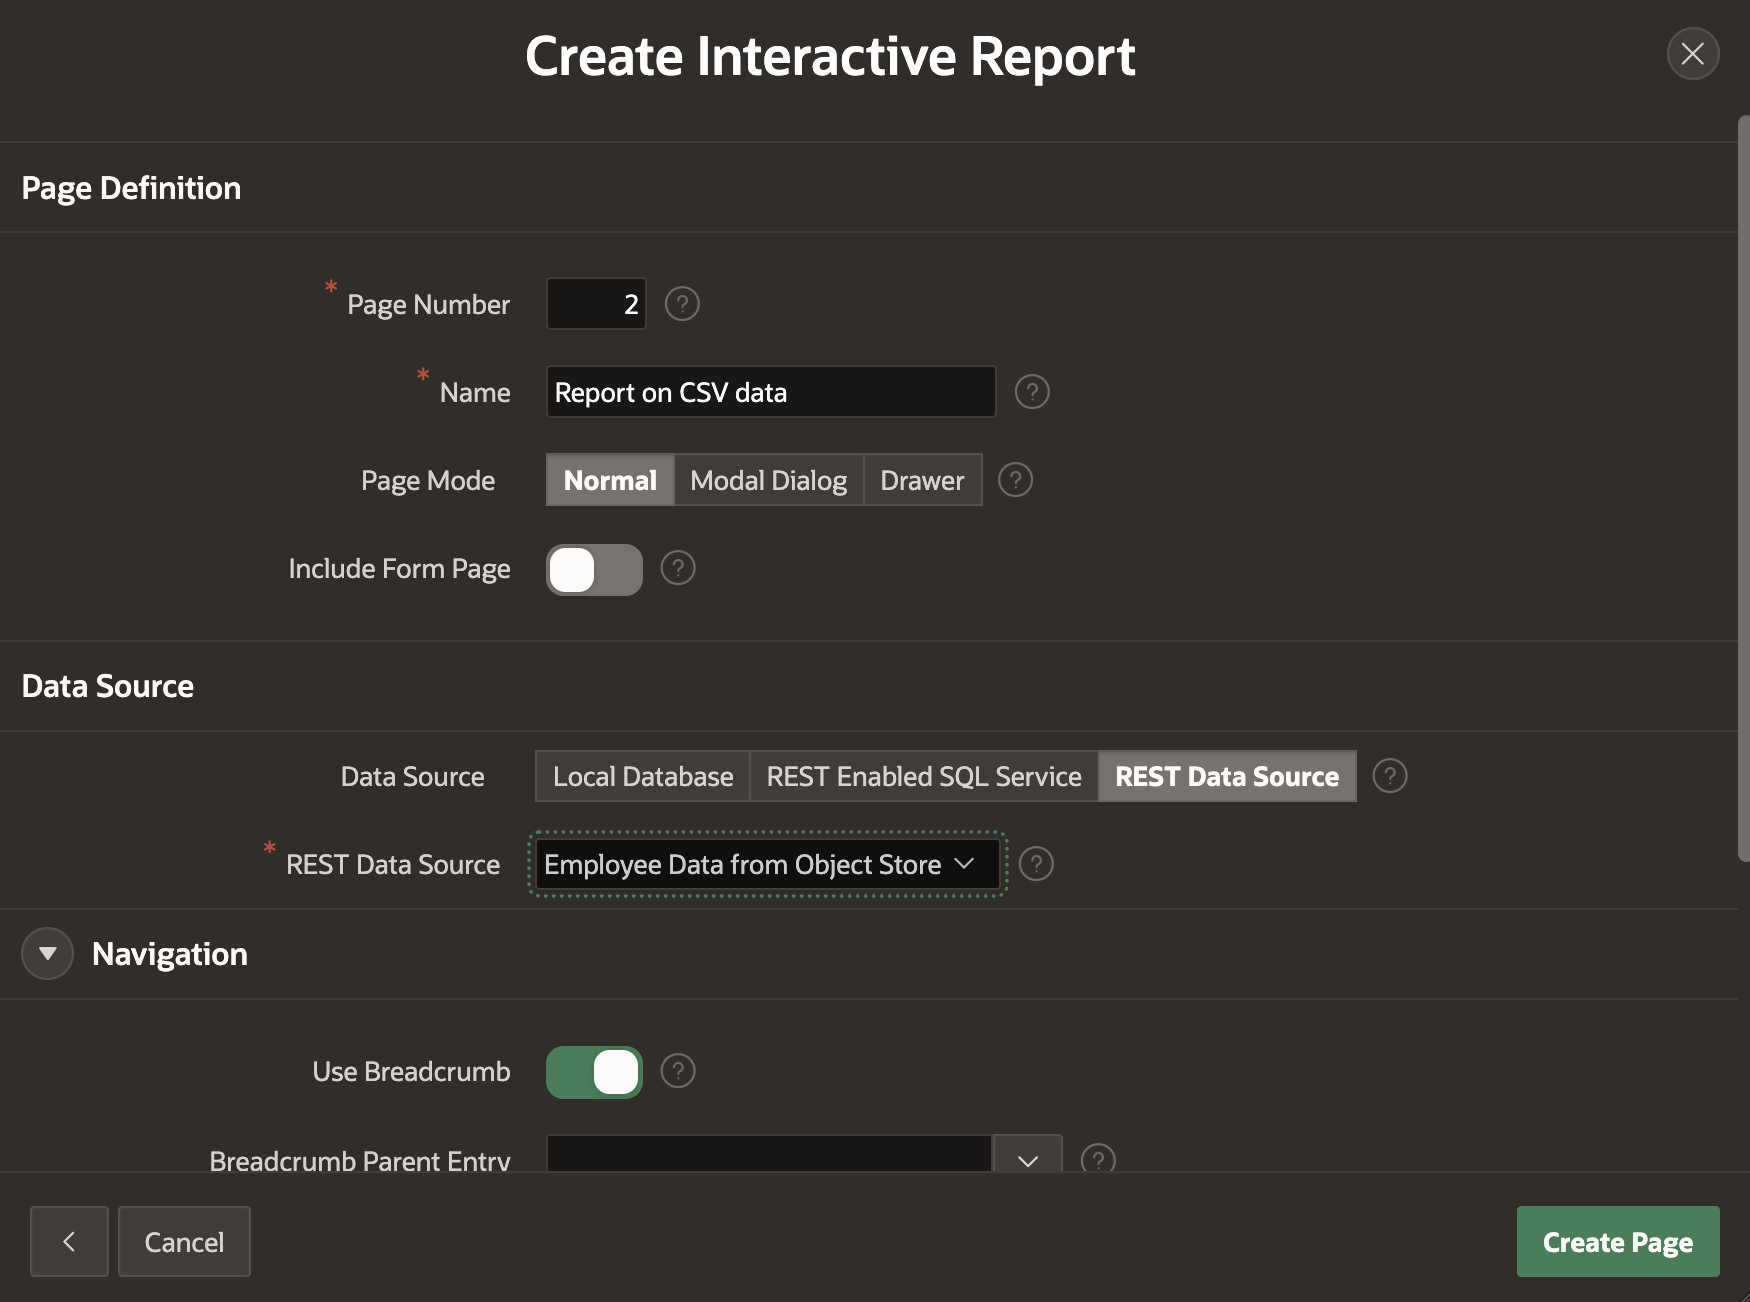
Fig. 15: Choosing the configured REST Data Source as Data Source for Interactive Report.
After the page has been created, APEX redirects to Page Designer; here we could apply all other sorts of changes and additions to the page.
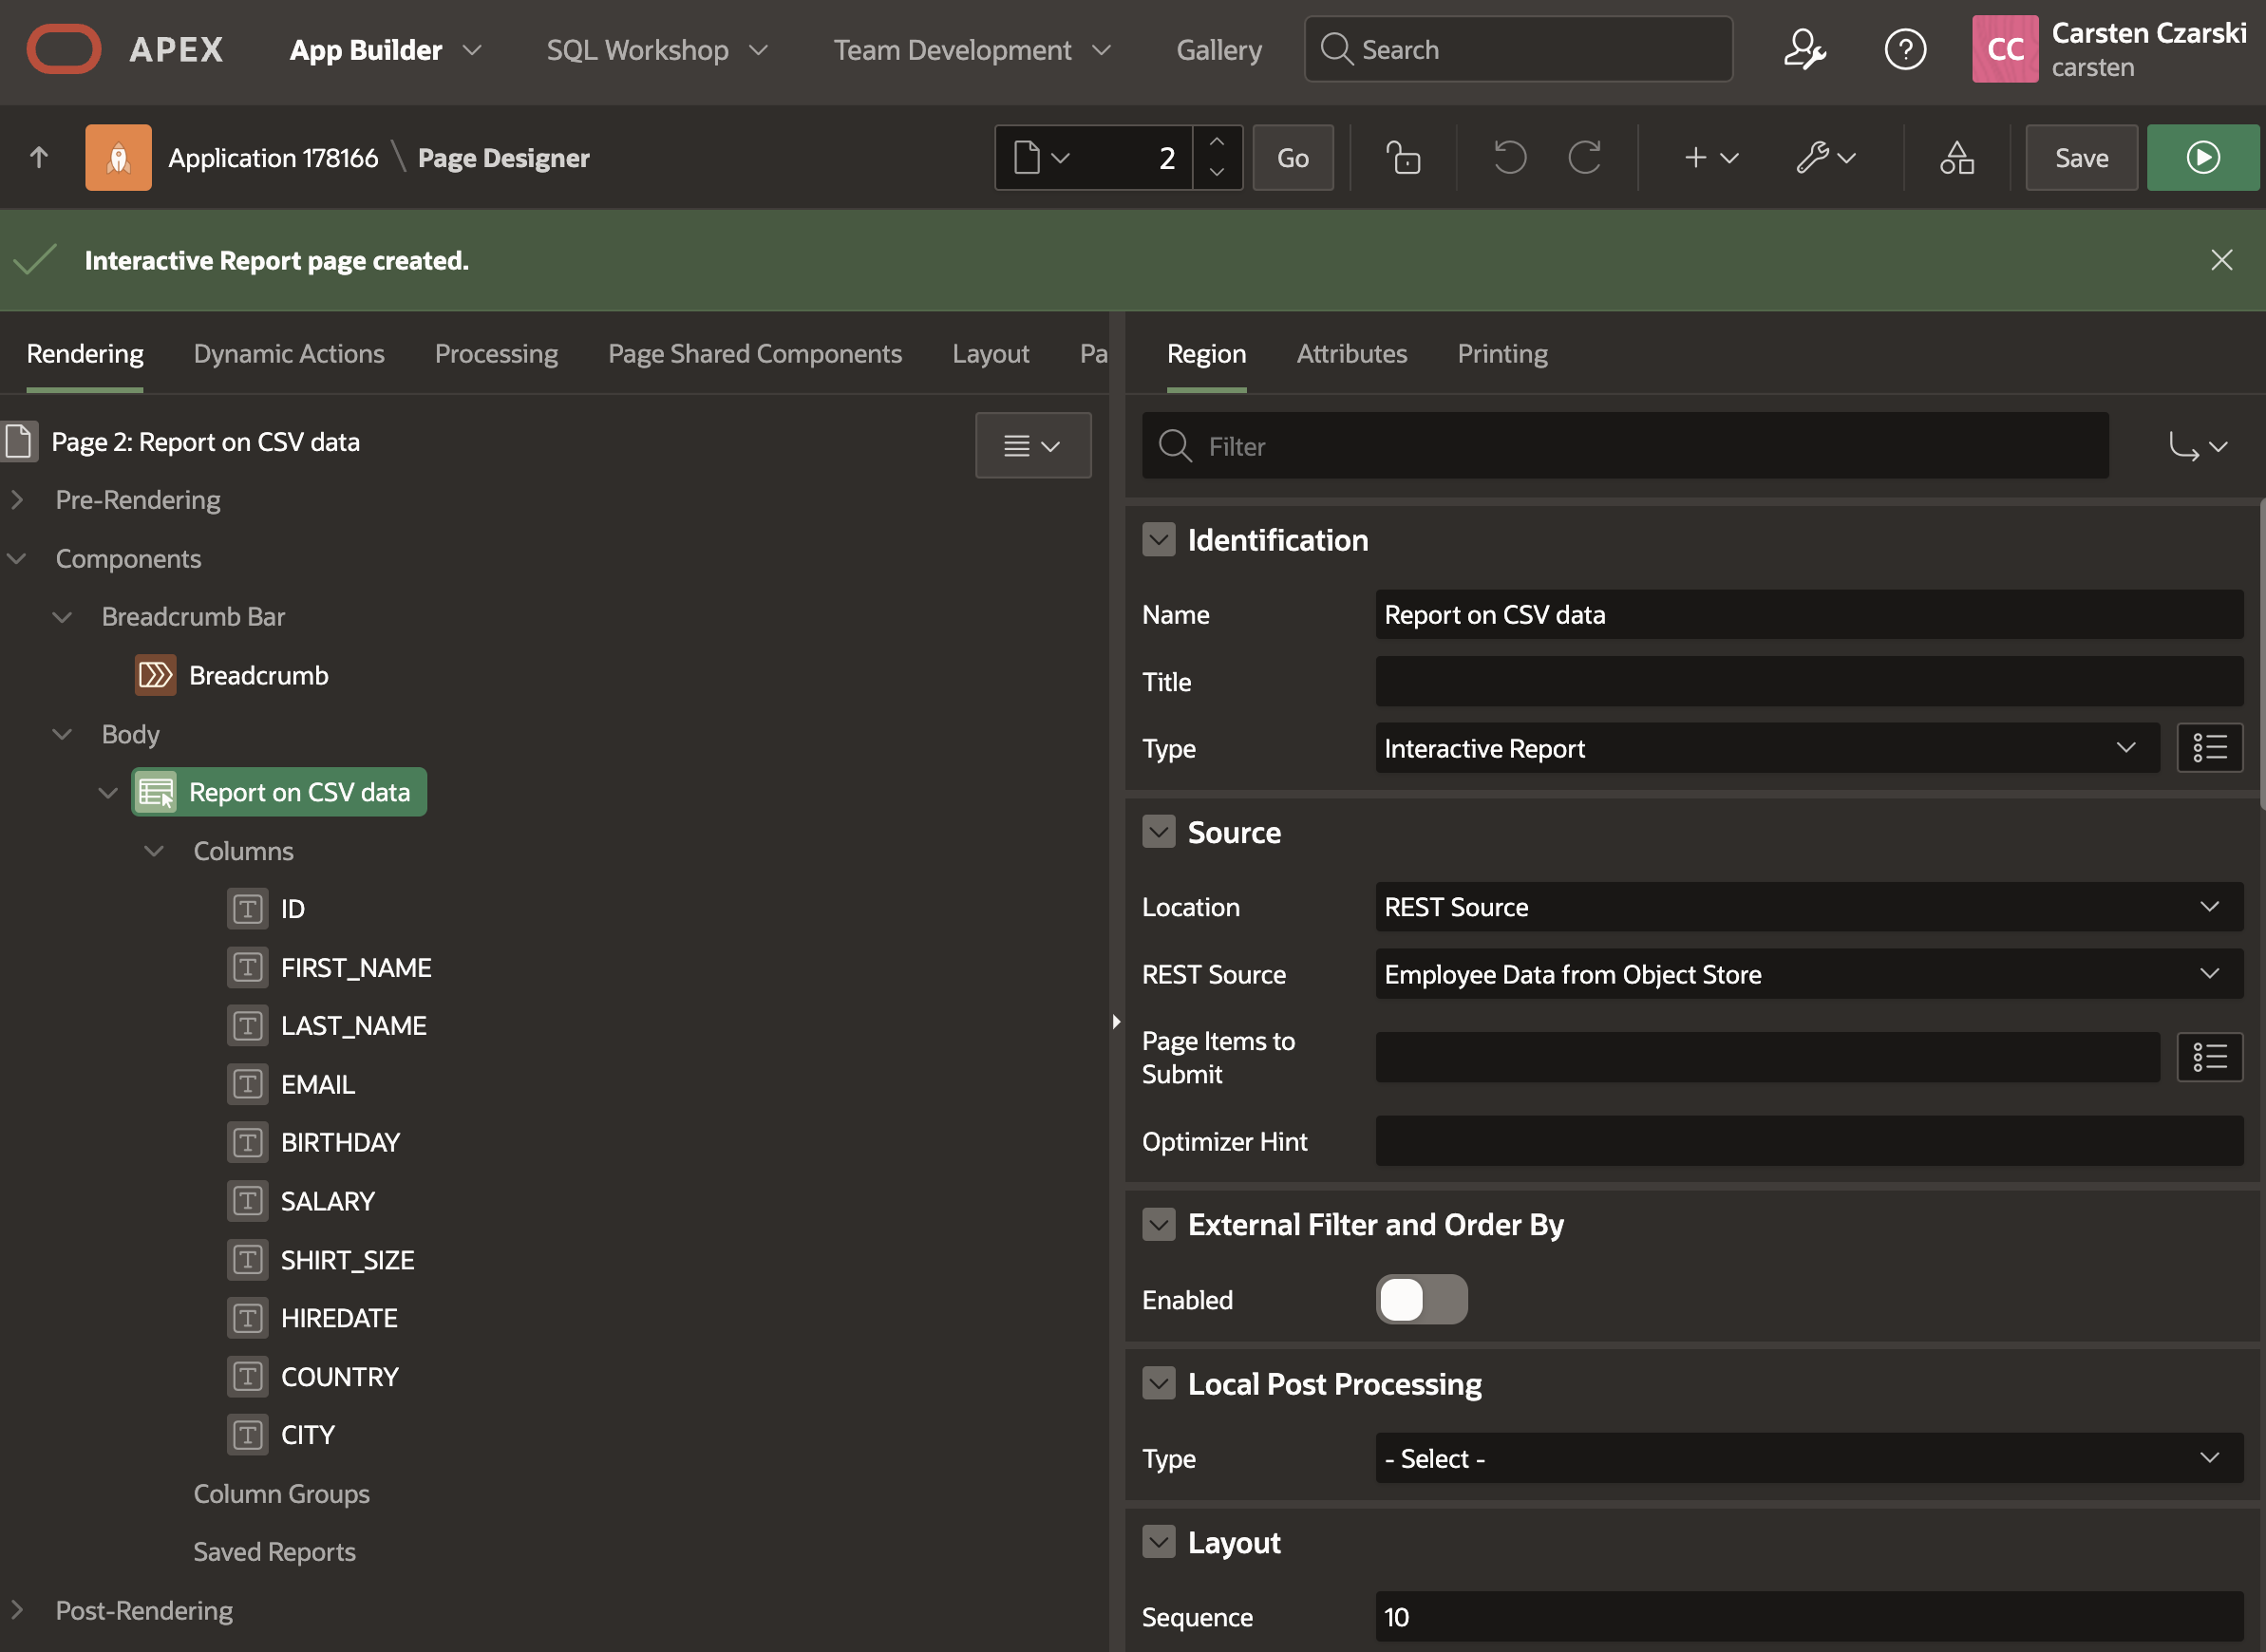
Fig. 16: The newly created page in Page Designer.
Now click the Run button in the upper right corner to run the page with the new Interactive Report. We will see the page as APEX displays it to end users. Using the search field, one can now easily search within the data.
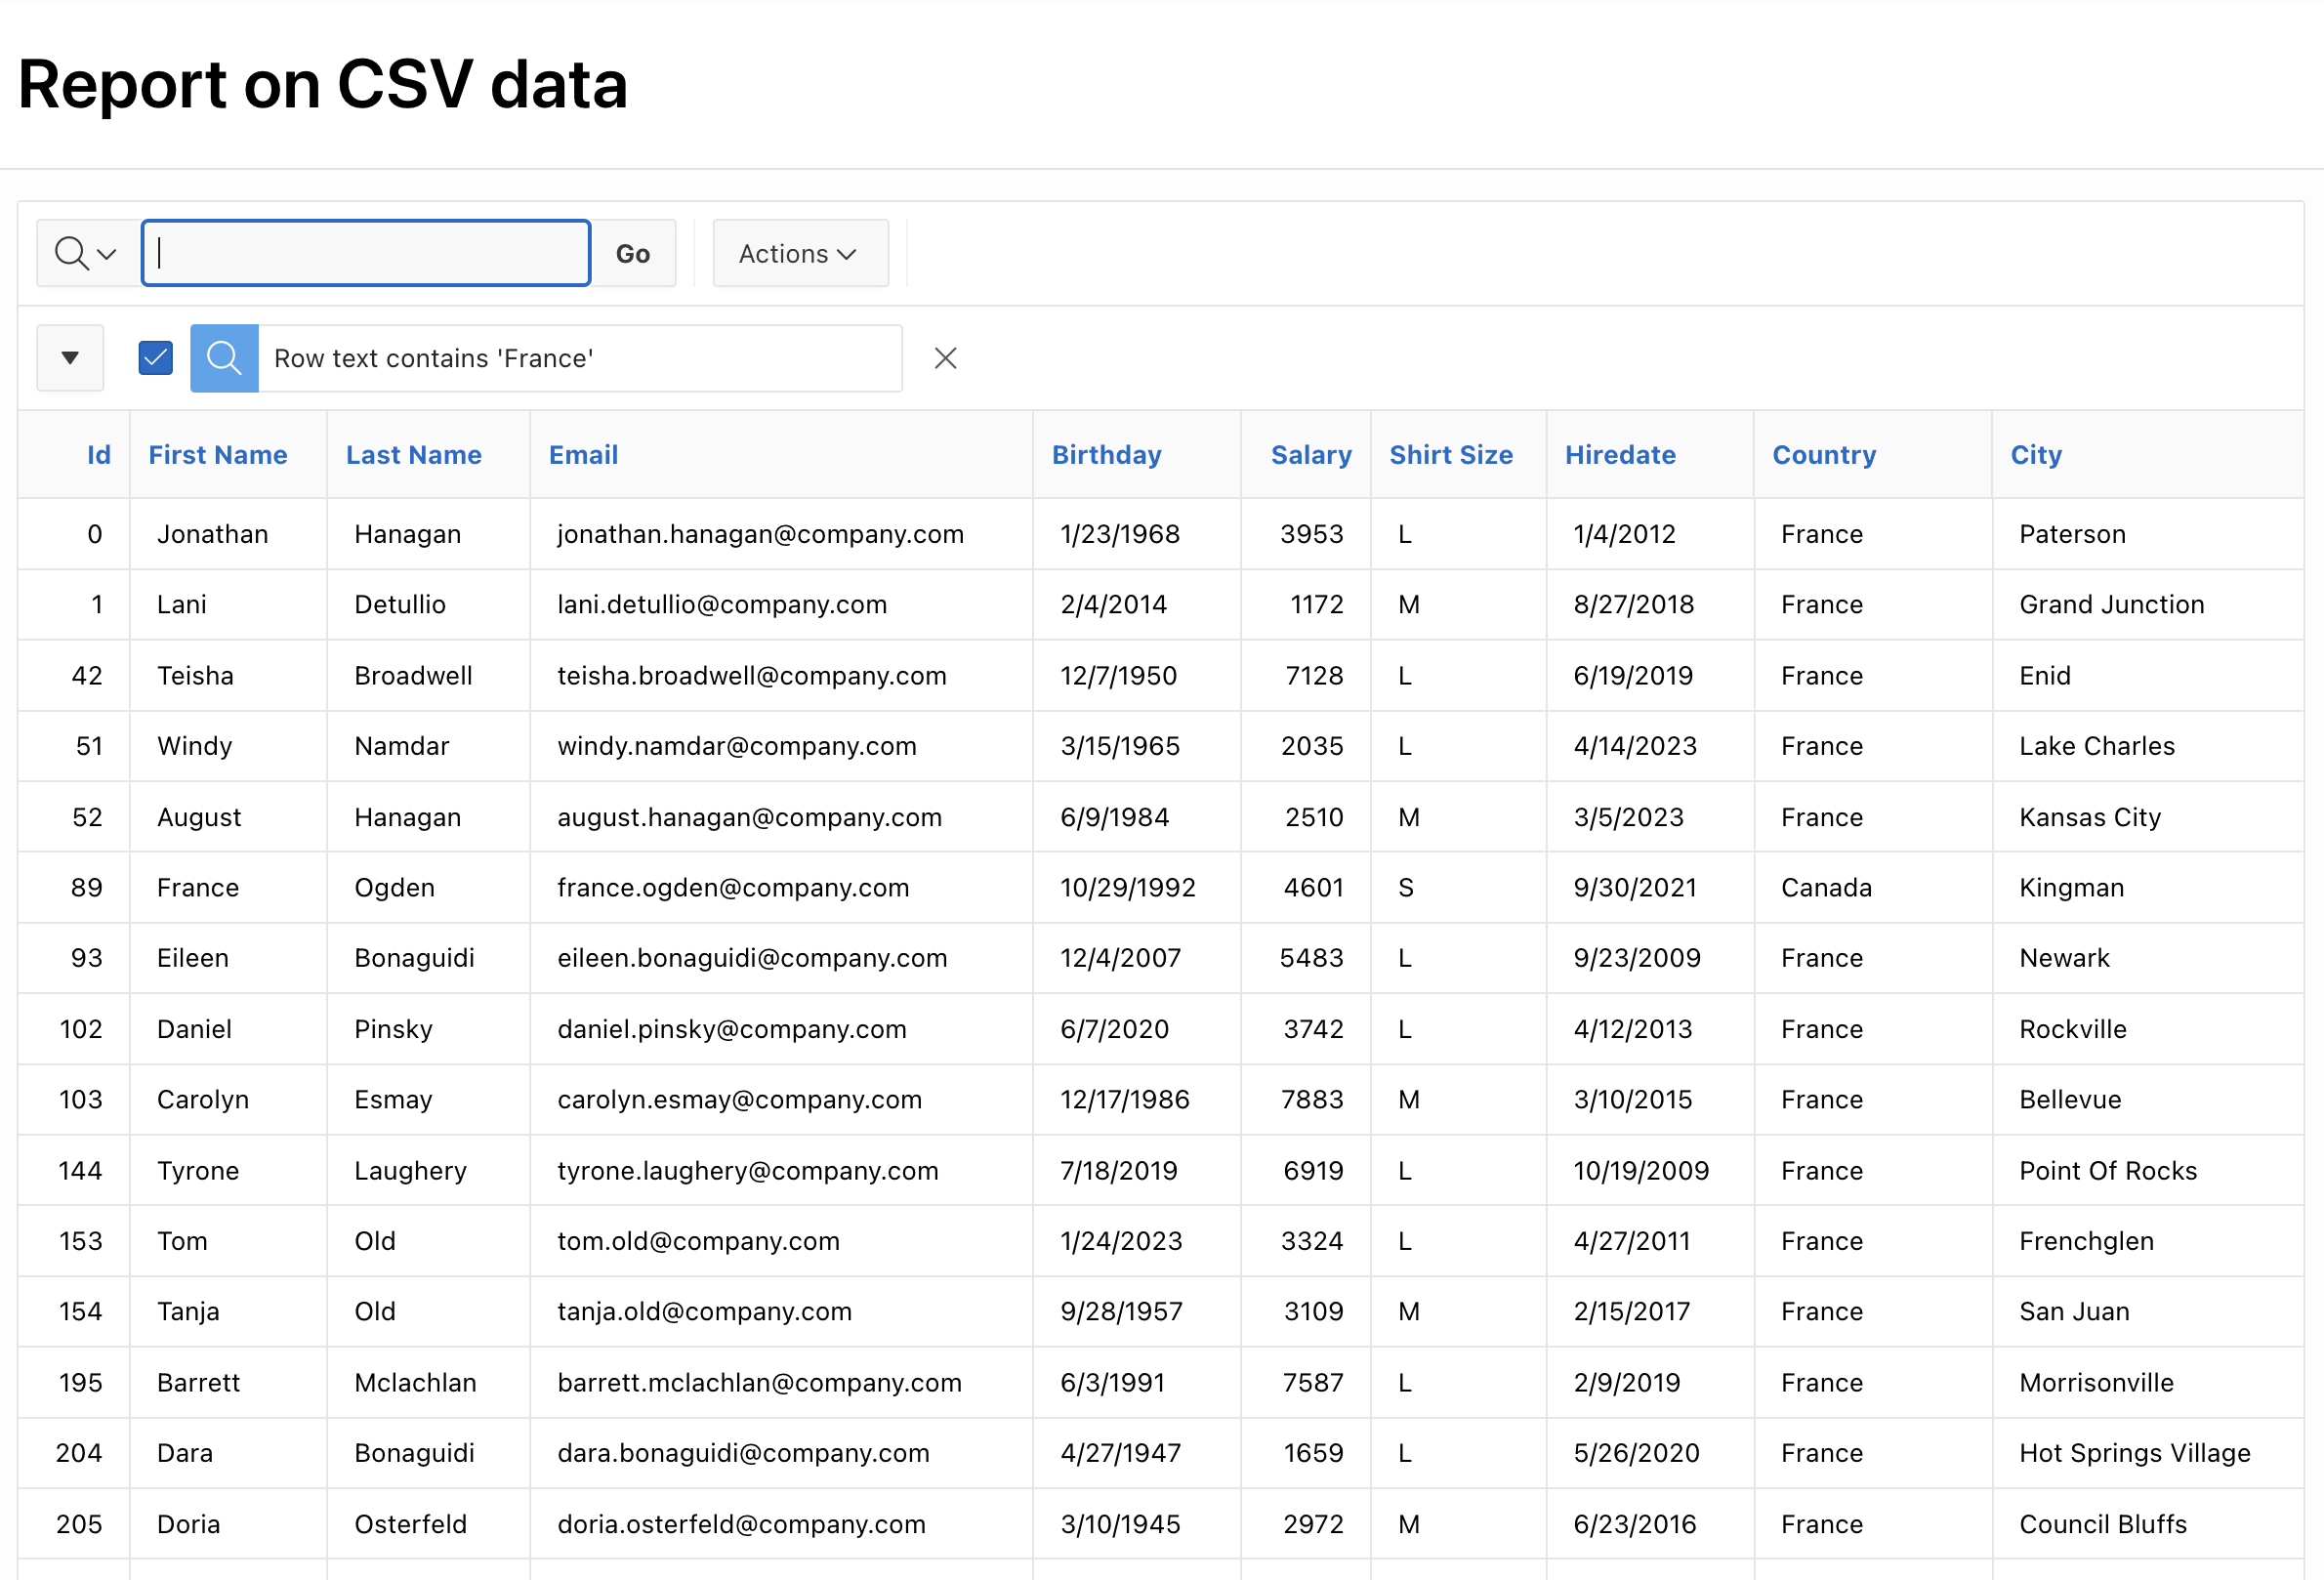
Fig. 17: Run the new Interactive Report and search for “France”.
Interactive Reports even allow to do more analysis. Fig. 18 shows how to aggregate data (count) and to group by the Country column.
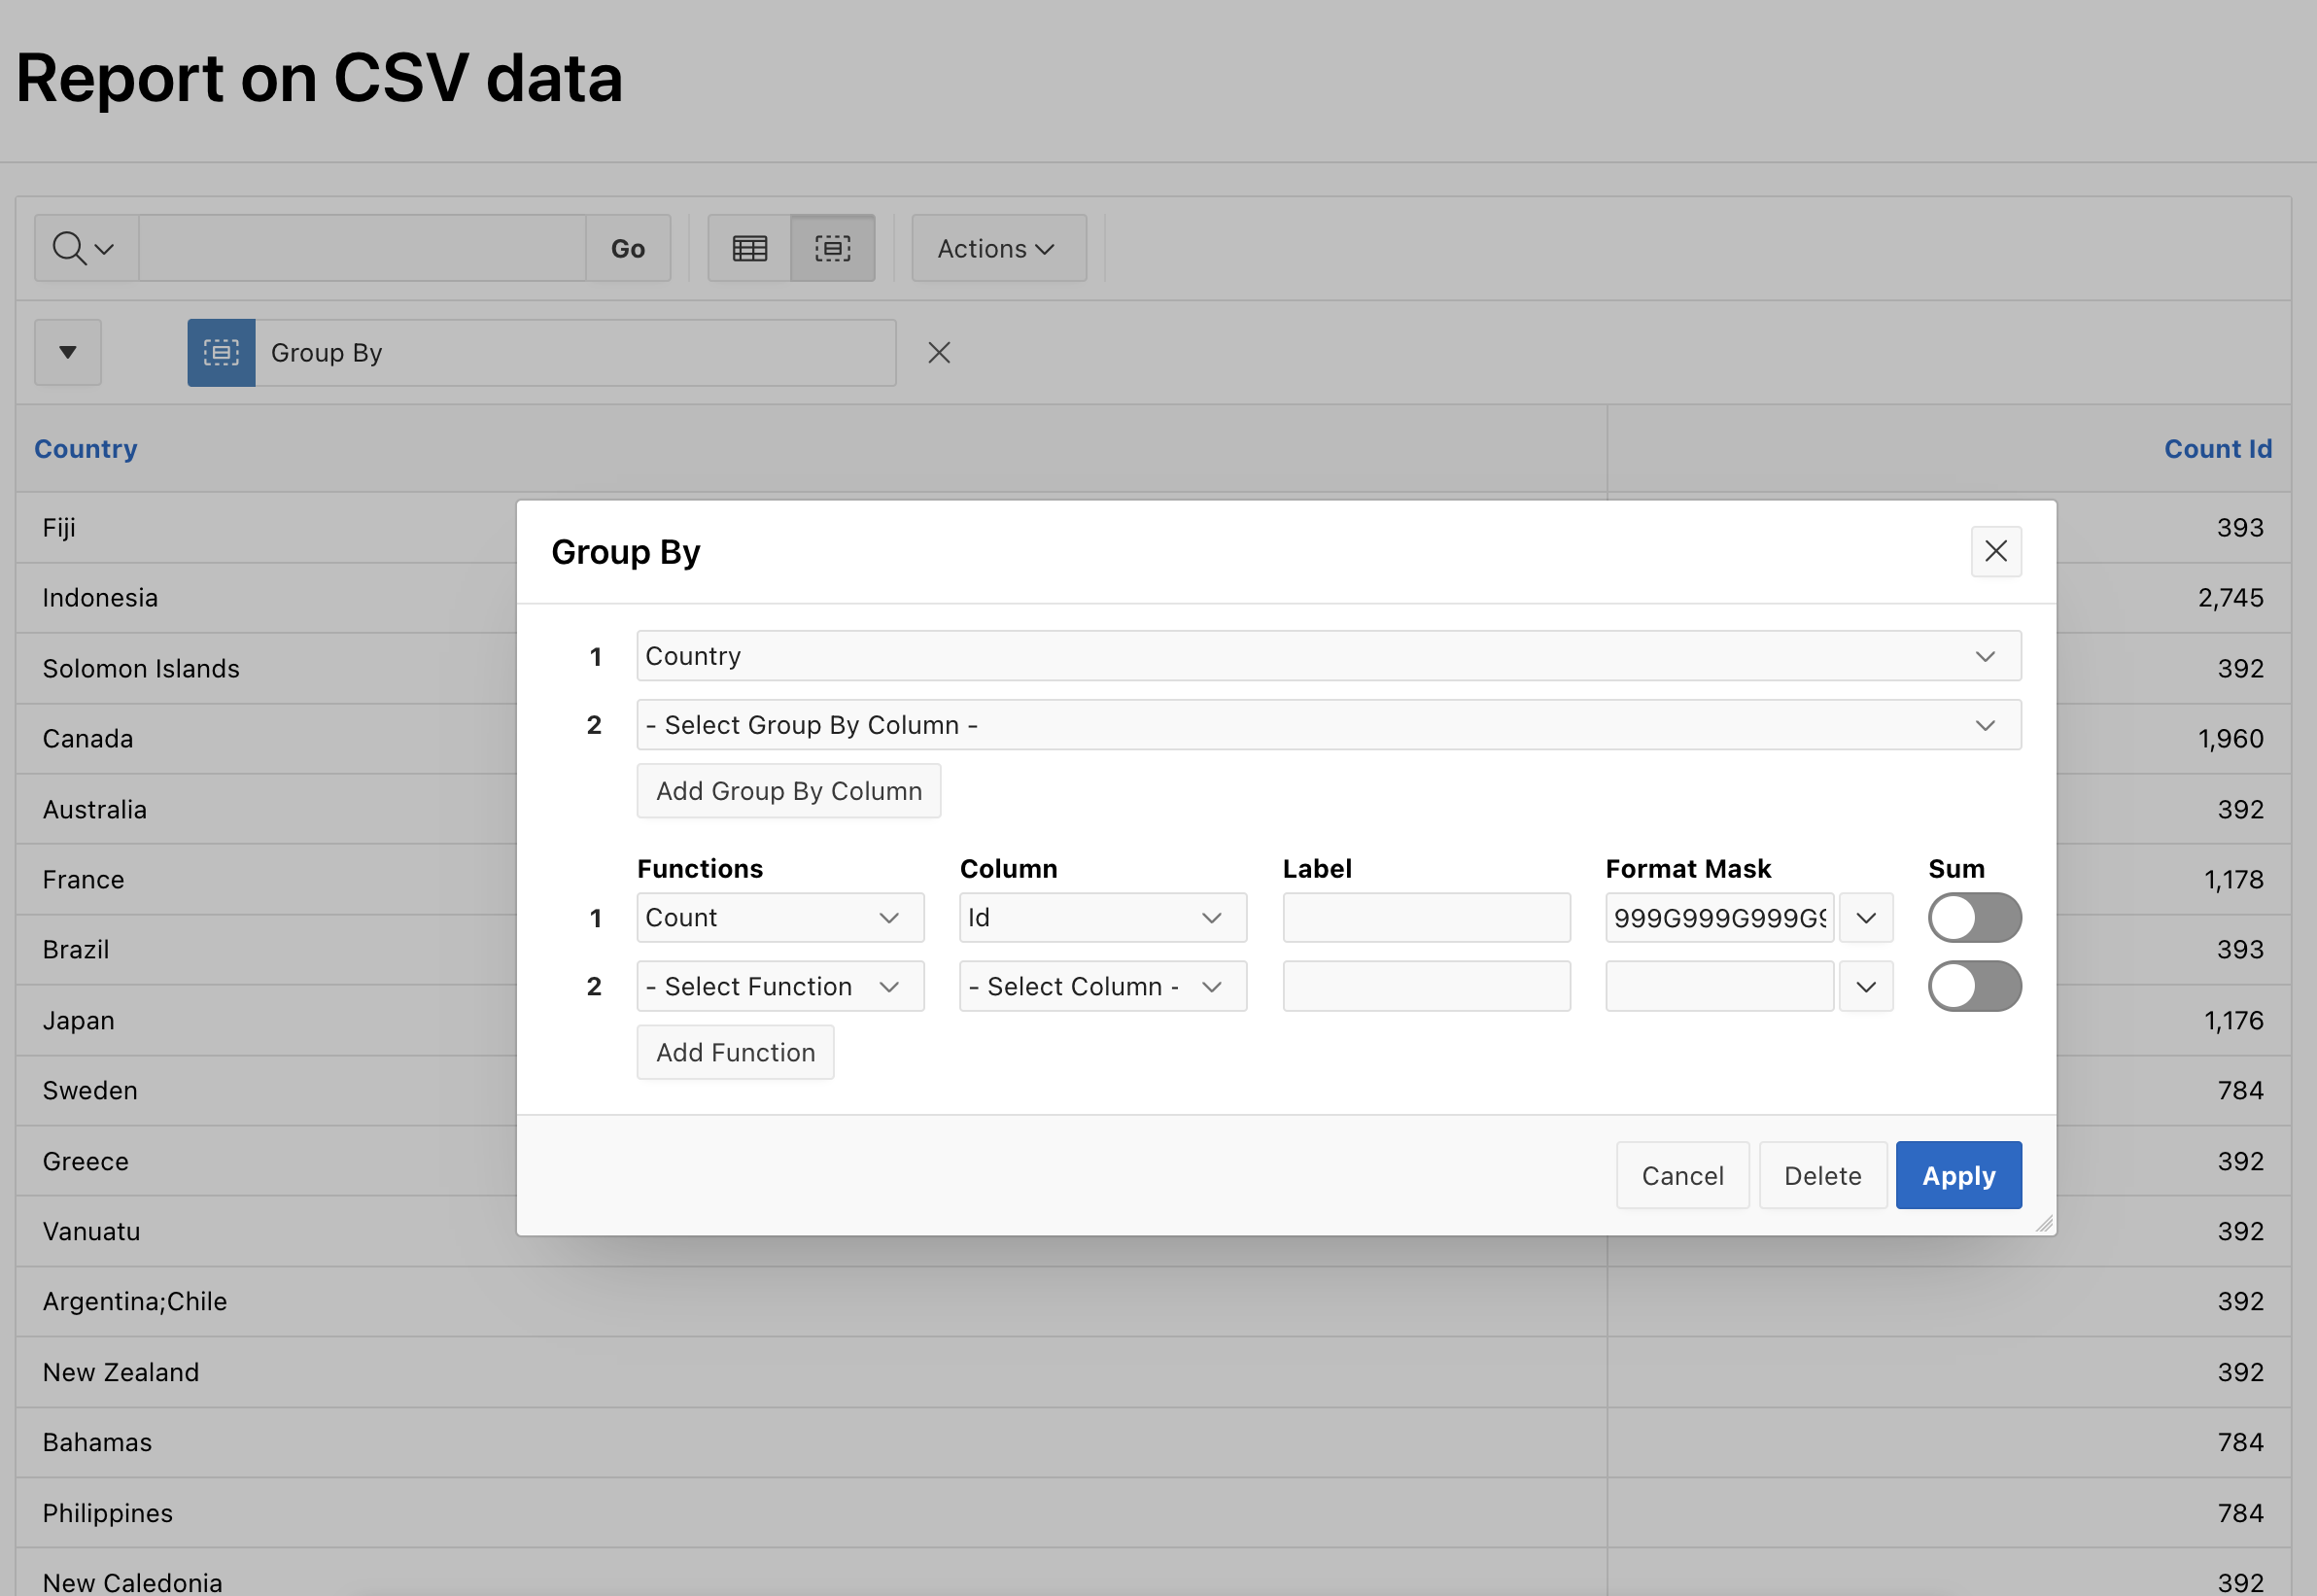
Fig. 18: Grouping Interactive Report data by Country.
Next, we’ll use the Create Page wizard again, now we want to have a chart on the data. However, use the Create Page wizard only to create a new blank page, we will use Page Designer to add the chart to the page. After creating the page, navigate to the tree on the left, and right-click the Body node in the page tree. In the context menu, click Create Region.
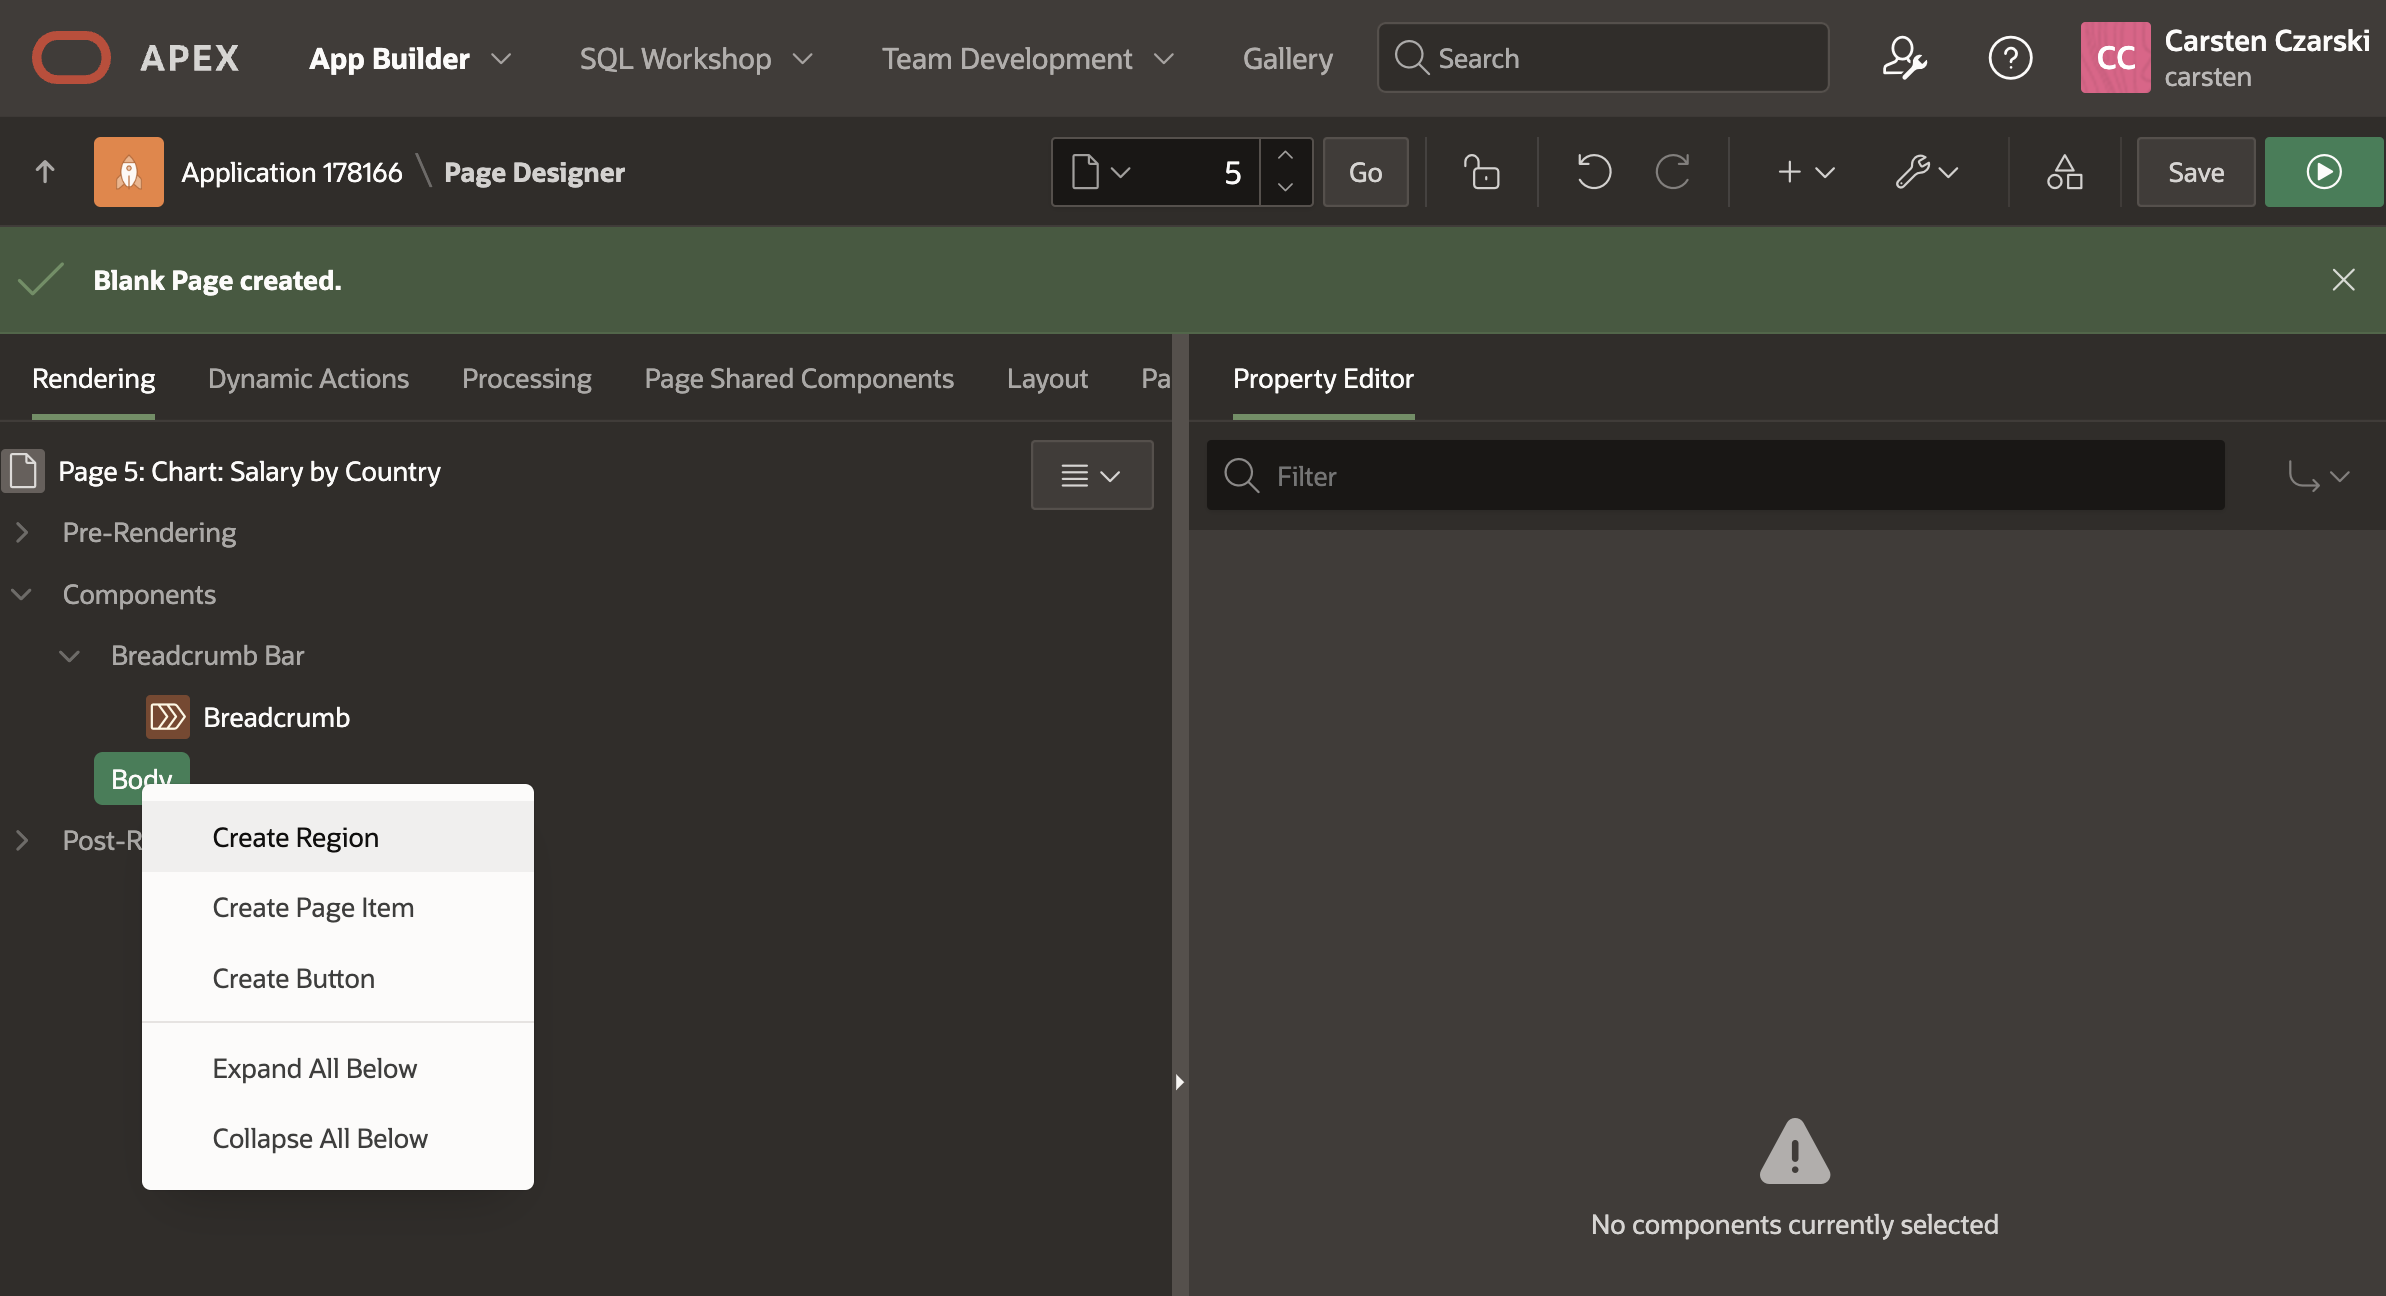
Fig. 19: Add a new region to the page using the context menu.
After the region was added, head over to the right side, where region attributes are configured. First, switch the Type of the region to Chart. In the tree on the left, you should notice that new nodes for Series and Axes are being added. Below Series a new empty chart series is added as well.
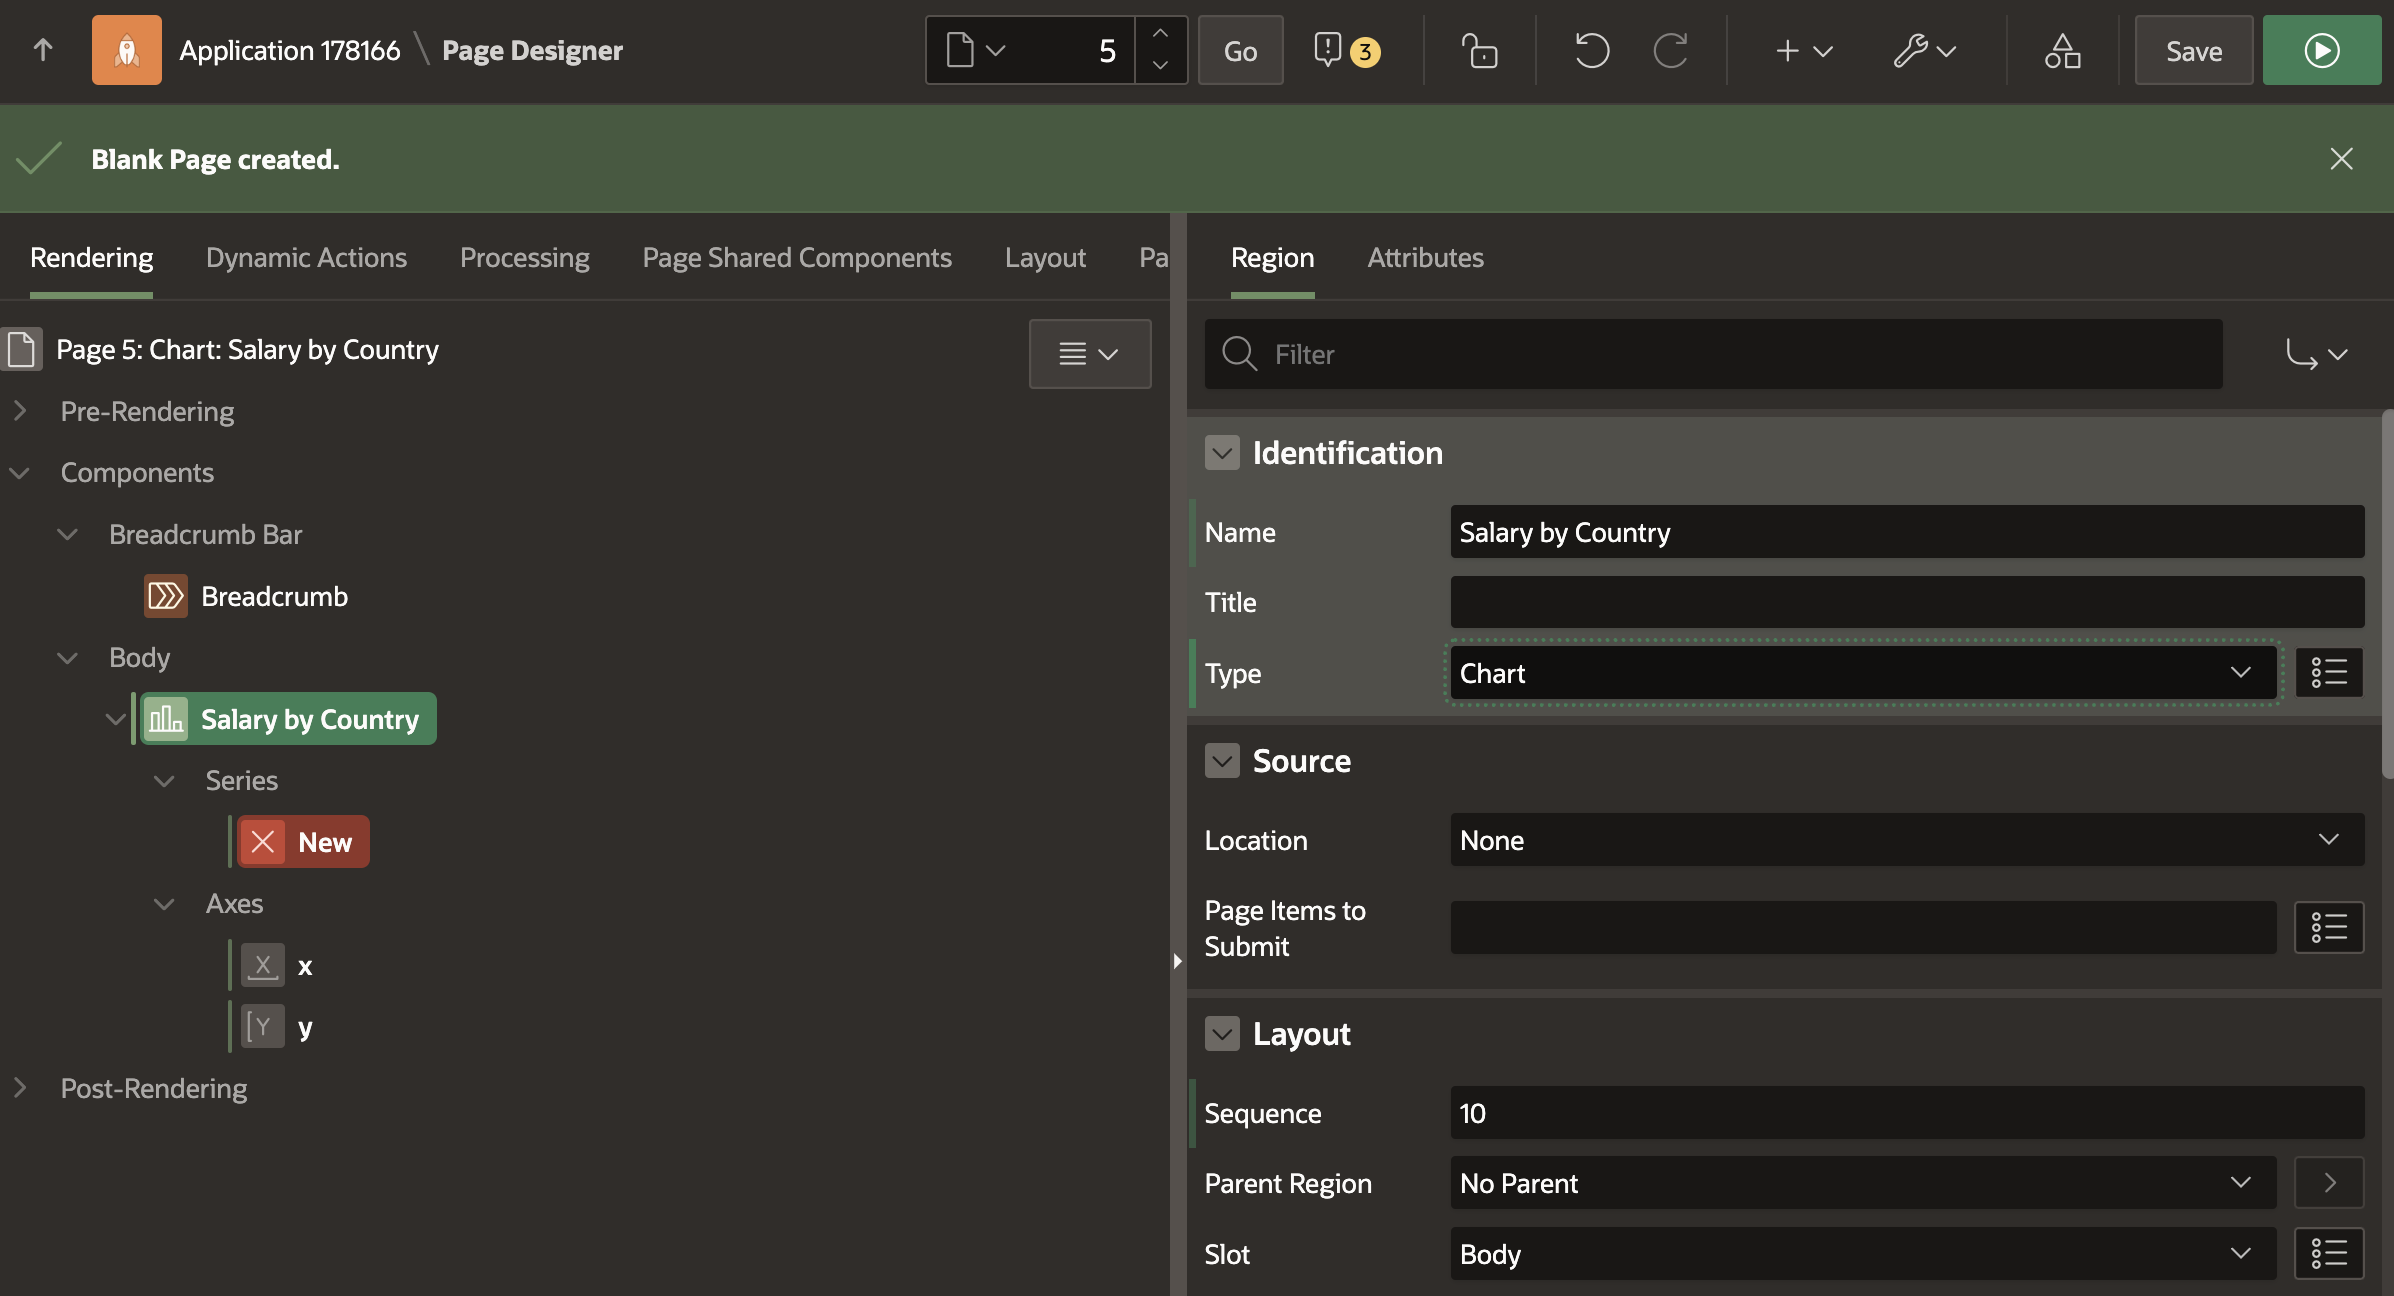
Fig. 20: Updating Region Type to Chart.
Let’s now configure the new chart series. Click the New node under Series, and head back to the attributes area on the right. Under Identification, provide a name for your series, then scroll down to Source. Choose REST Data Source as Location, and then pick the Employee Data from Object Store REST Source. After that, scroll down to the Column Mapping area, and make the following changes:
- Use COUNTRY as the Label attribute.
- Use Sum as the Value Aggregation.
- Use SALARY as the Value attribute.
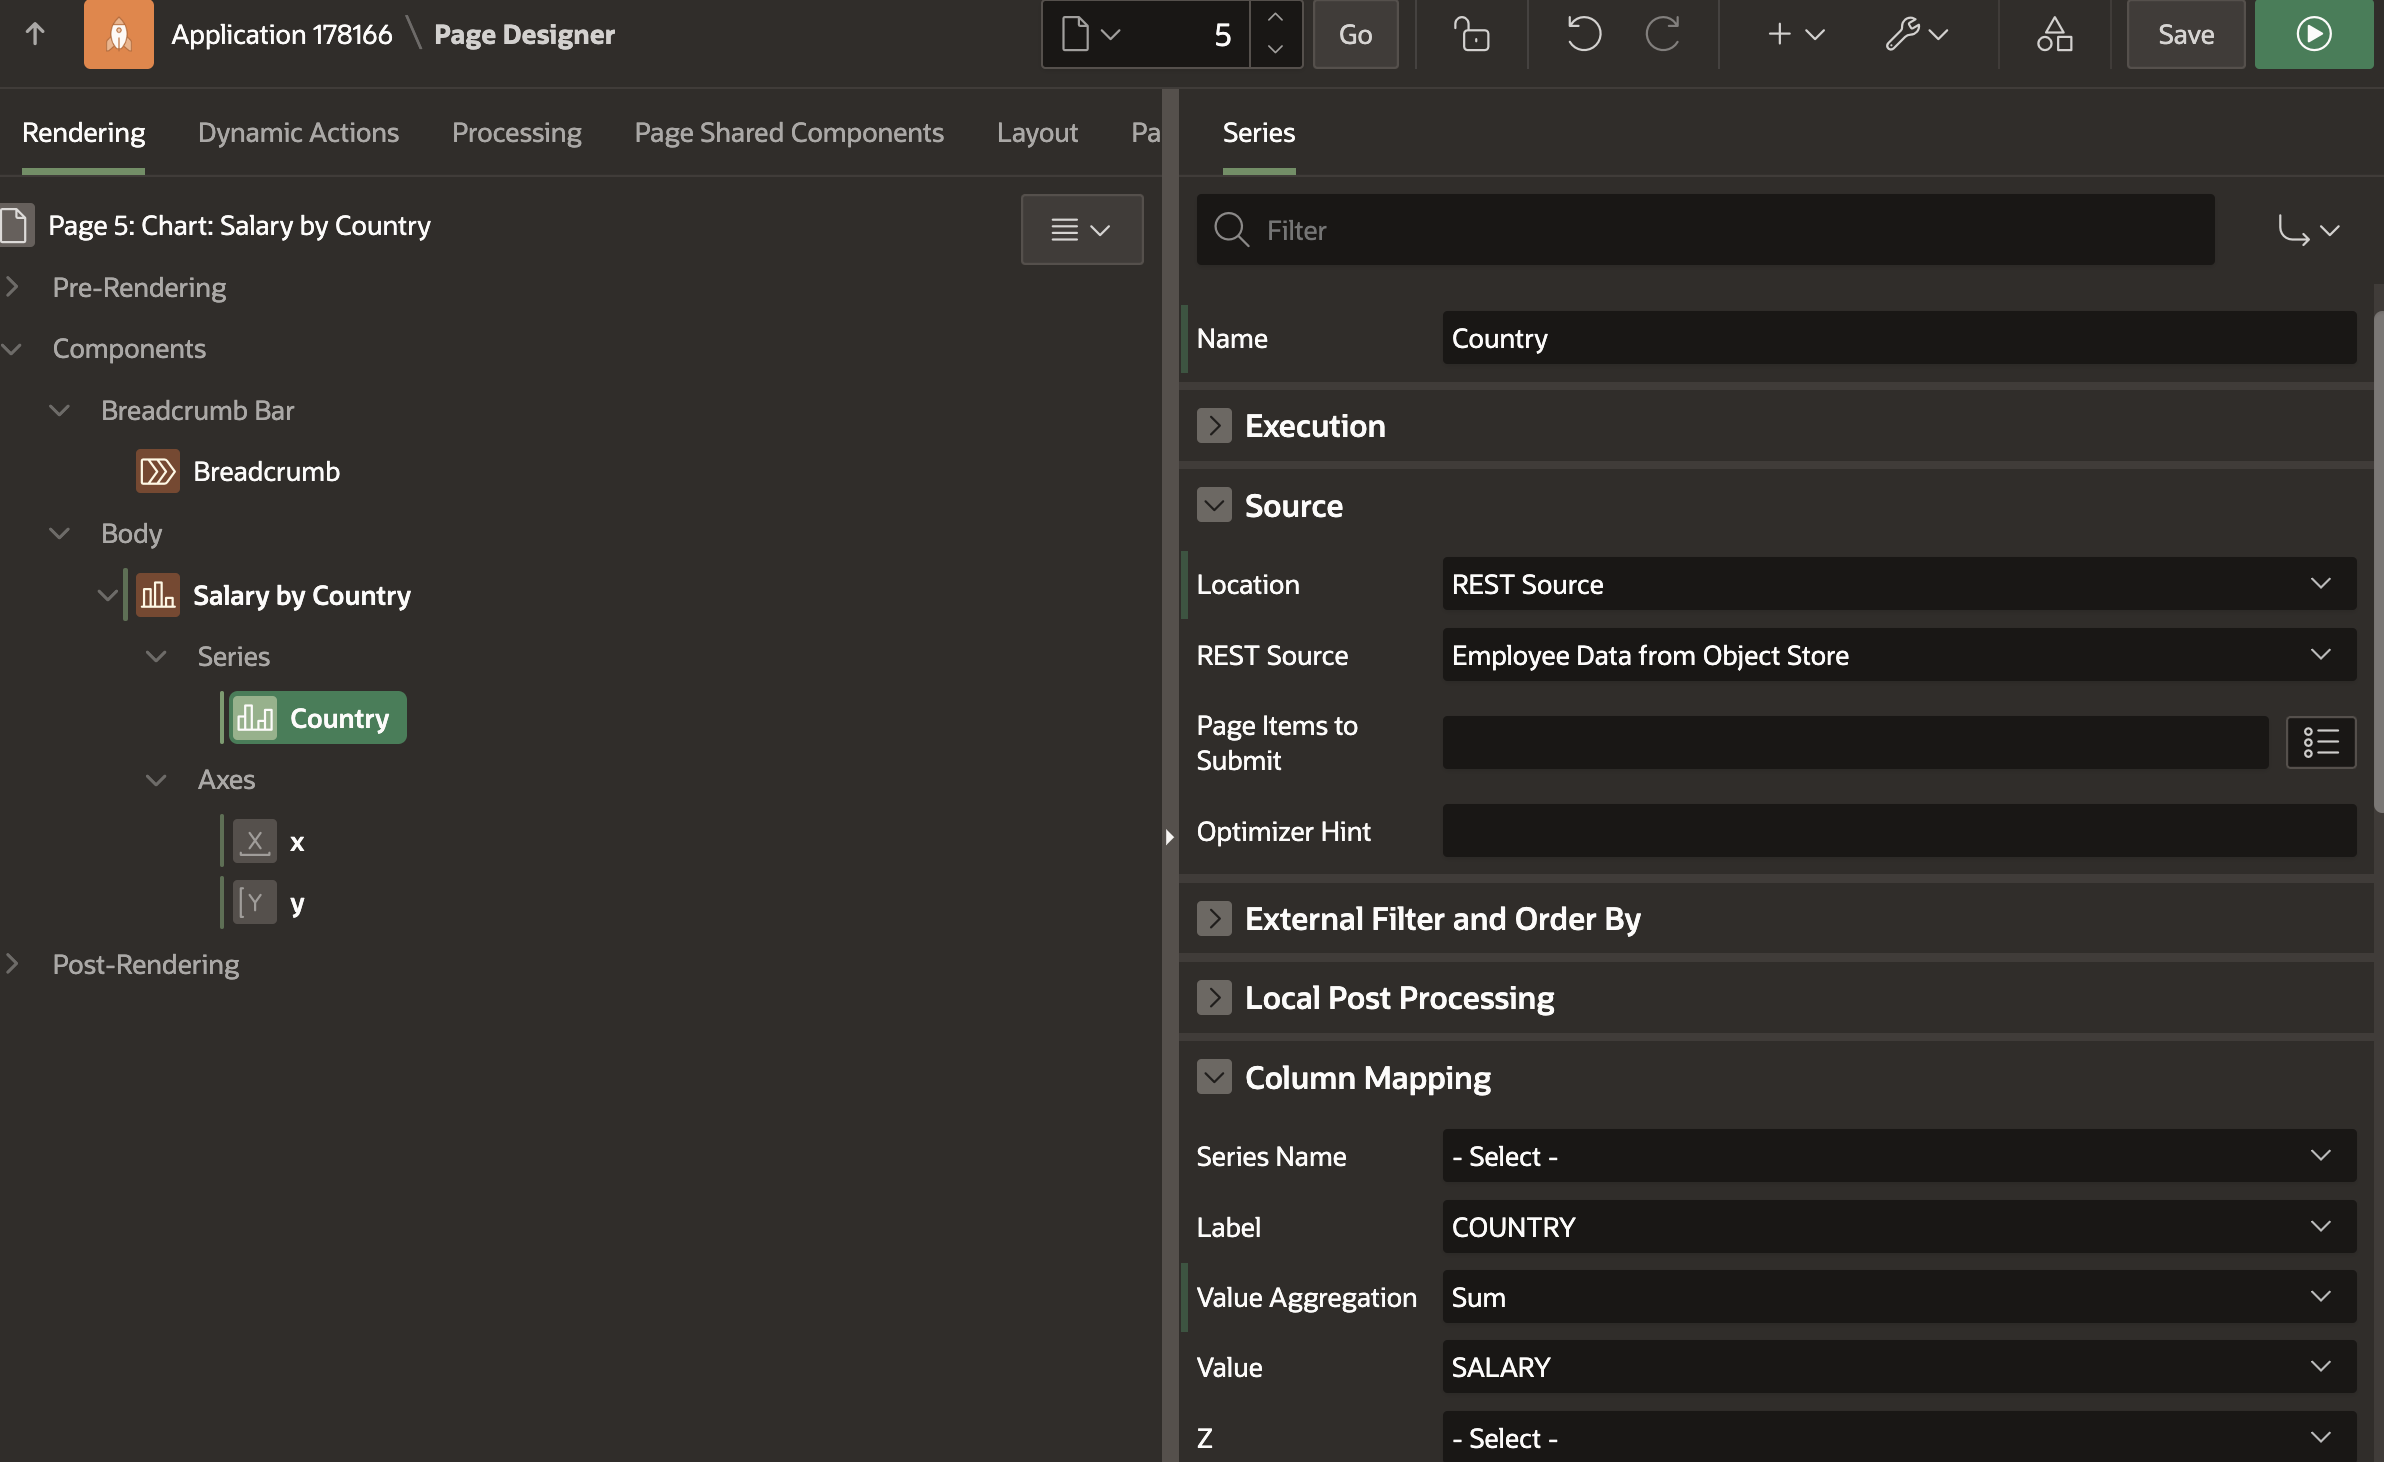
Fig. 21: Configuring REST Source as Chart Source.
After making all the changes, save and run the page. The result should look like in Fig. 22, and shows a chart visualizing the summary of salaries, by country. Other charts can be configured in similar manner.
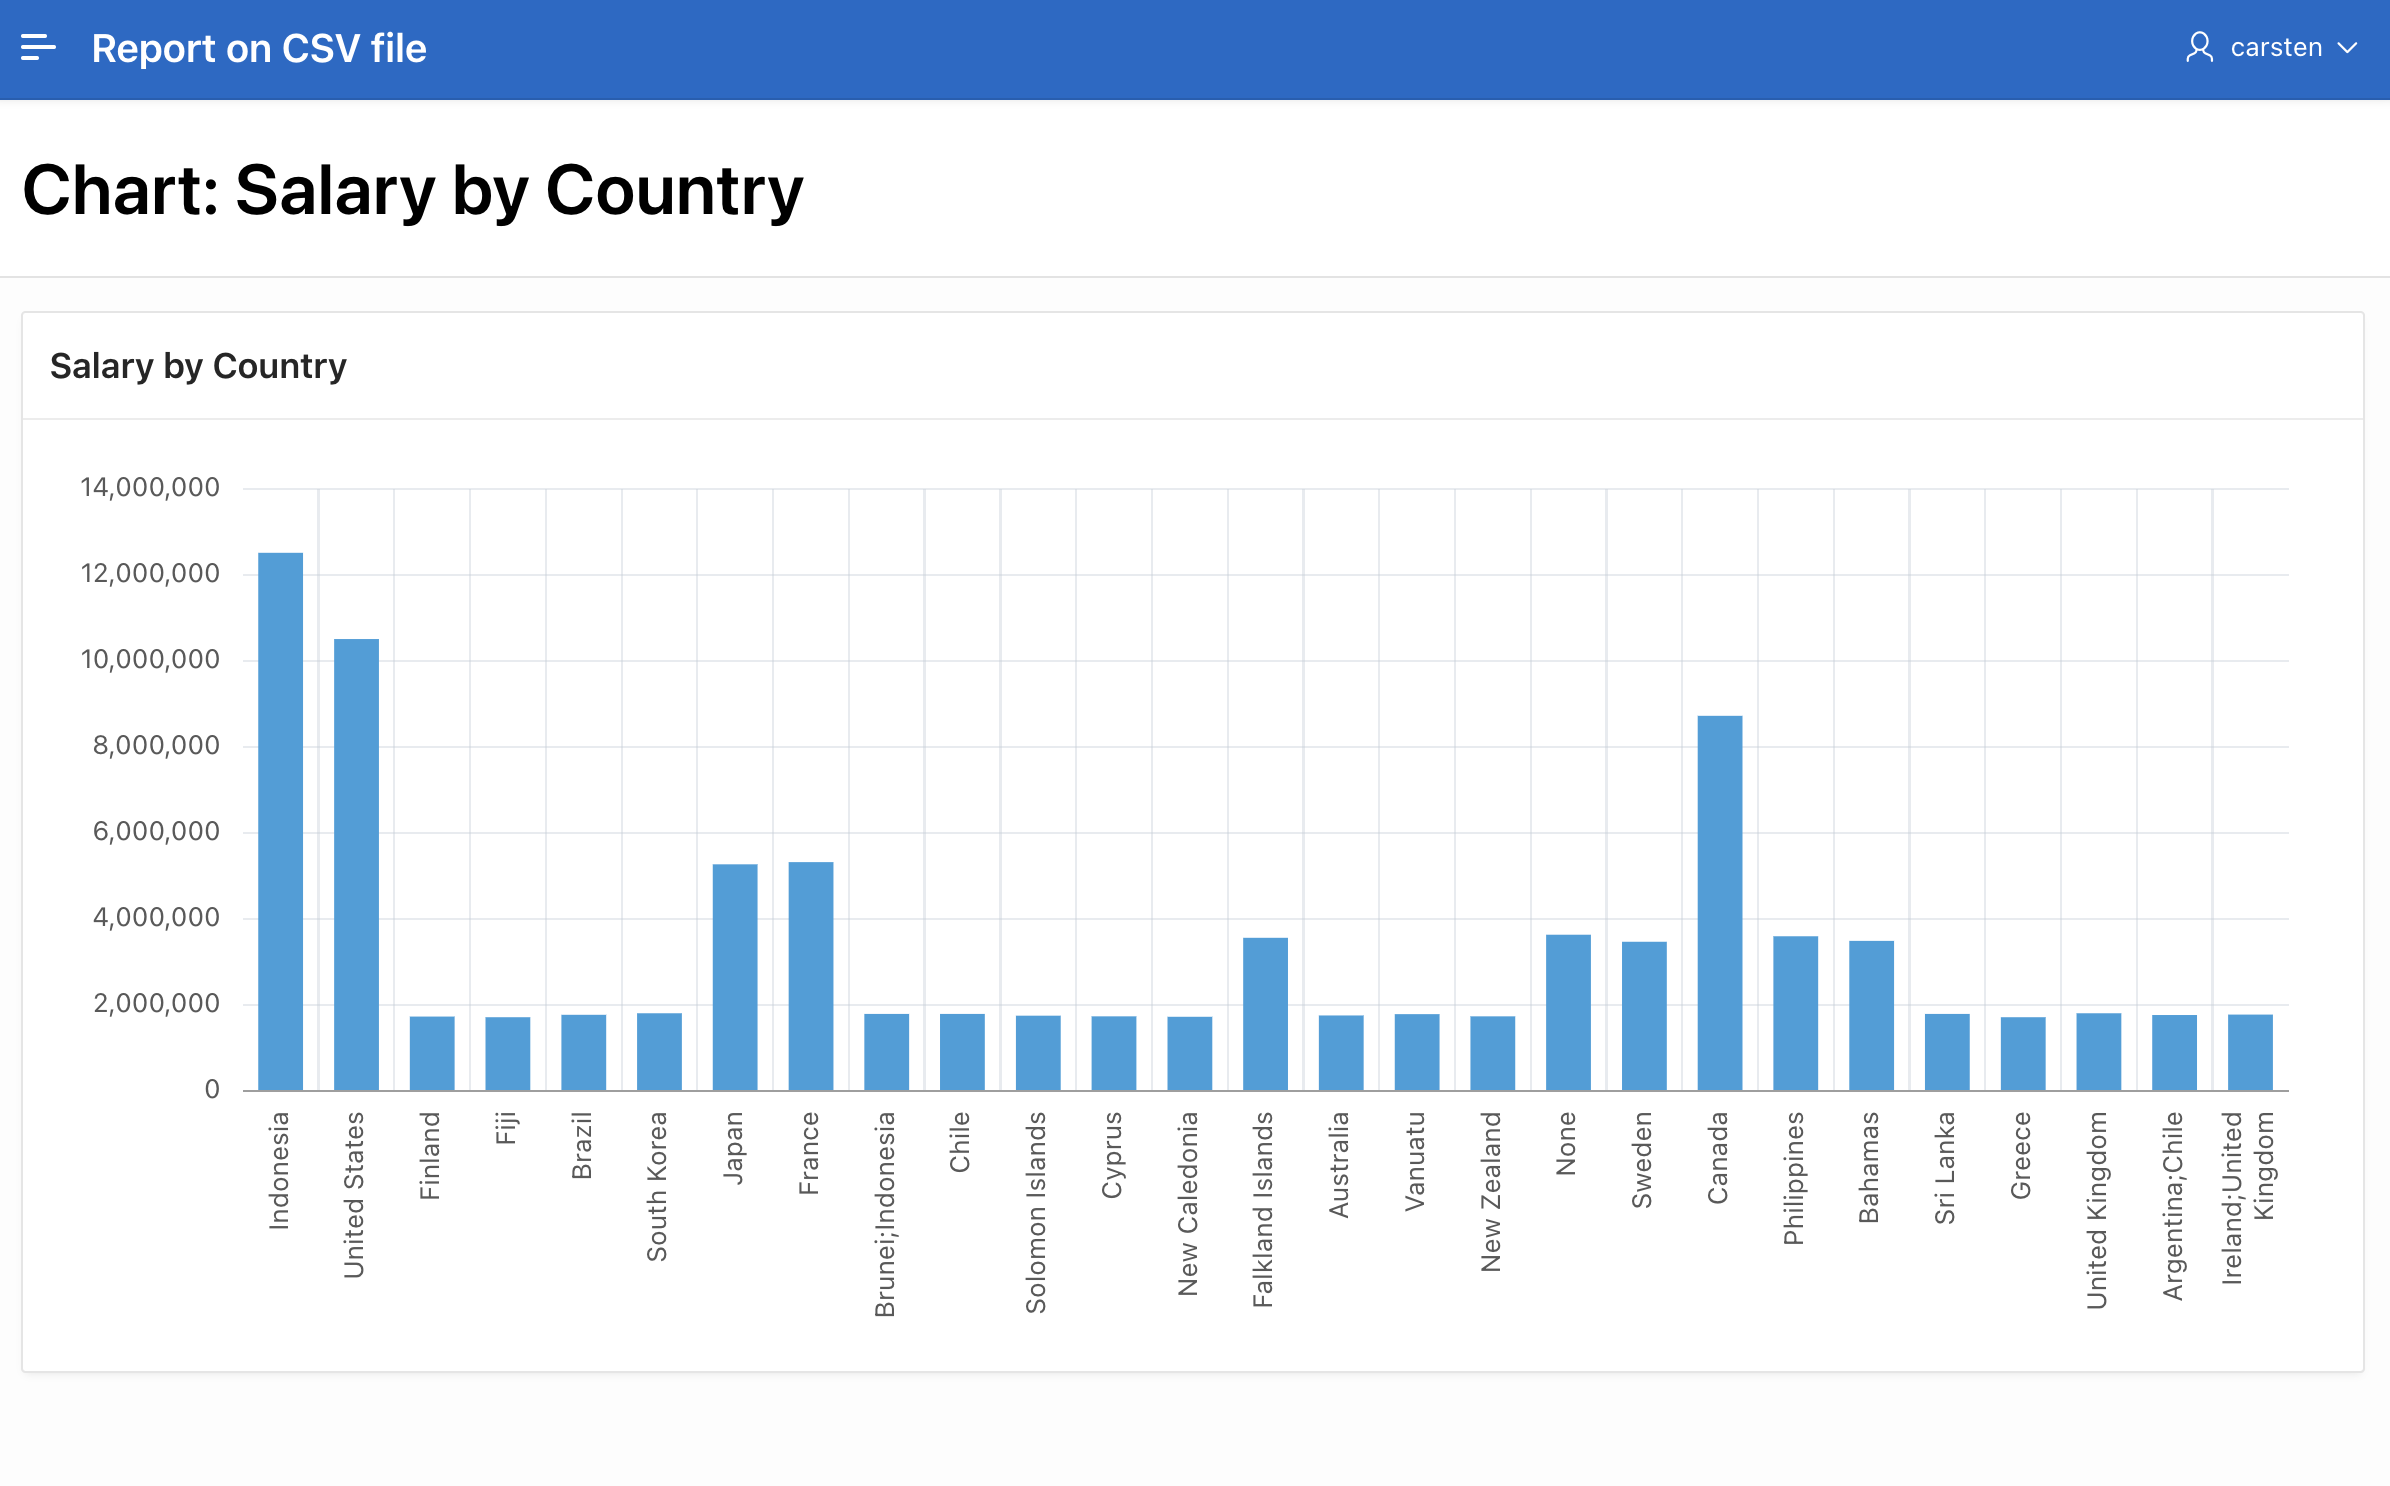
Fig. 22: The new chart in Action.
Speeding things up: Cache CSV Content
You have created a REST Data Source as a reference to a CSV file on Object Store, and two pages to visualize the CSV data as reports or charts. Other chart types, Maps, Faceted Search or Smart Filter pages would work in a similar manner. However, the current way of visualizing the CSV data is not very efficient: Whenever such a page runs, APEX will make a HTTP request to Object Store, download and parse the CSV data in order to render the configured APEX pages.
In most cases, the CSV data does not change every second – new data every hour, day or even month is way more realistic. So we should think about what we could do to avoid downloading and parsing the CSV content all the time. The first thing we’ll have a look at is the REST Data Source Caching capability: REST Sources allow to cache content received from the remote site for some time, e.g. for an hour or a day. To configure that, navigate to Shared Components, REST Data Sources and then drill down to the Employee Data from Object Store REST Source. You should see the edit page, where all details of the REST Data Source can be configured.
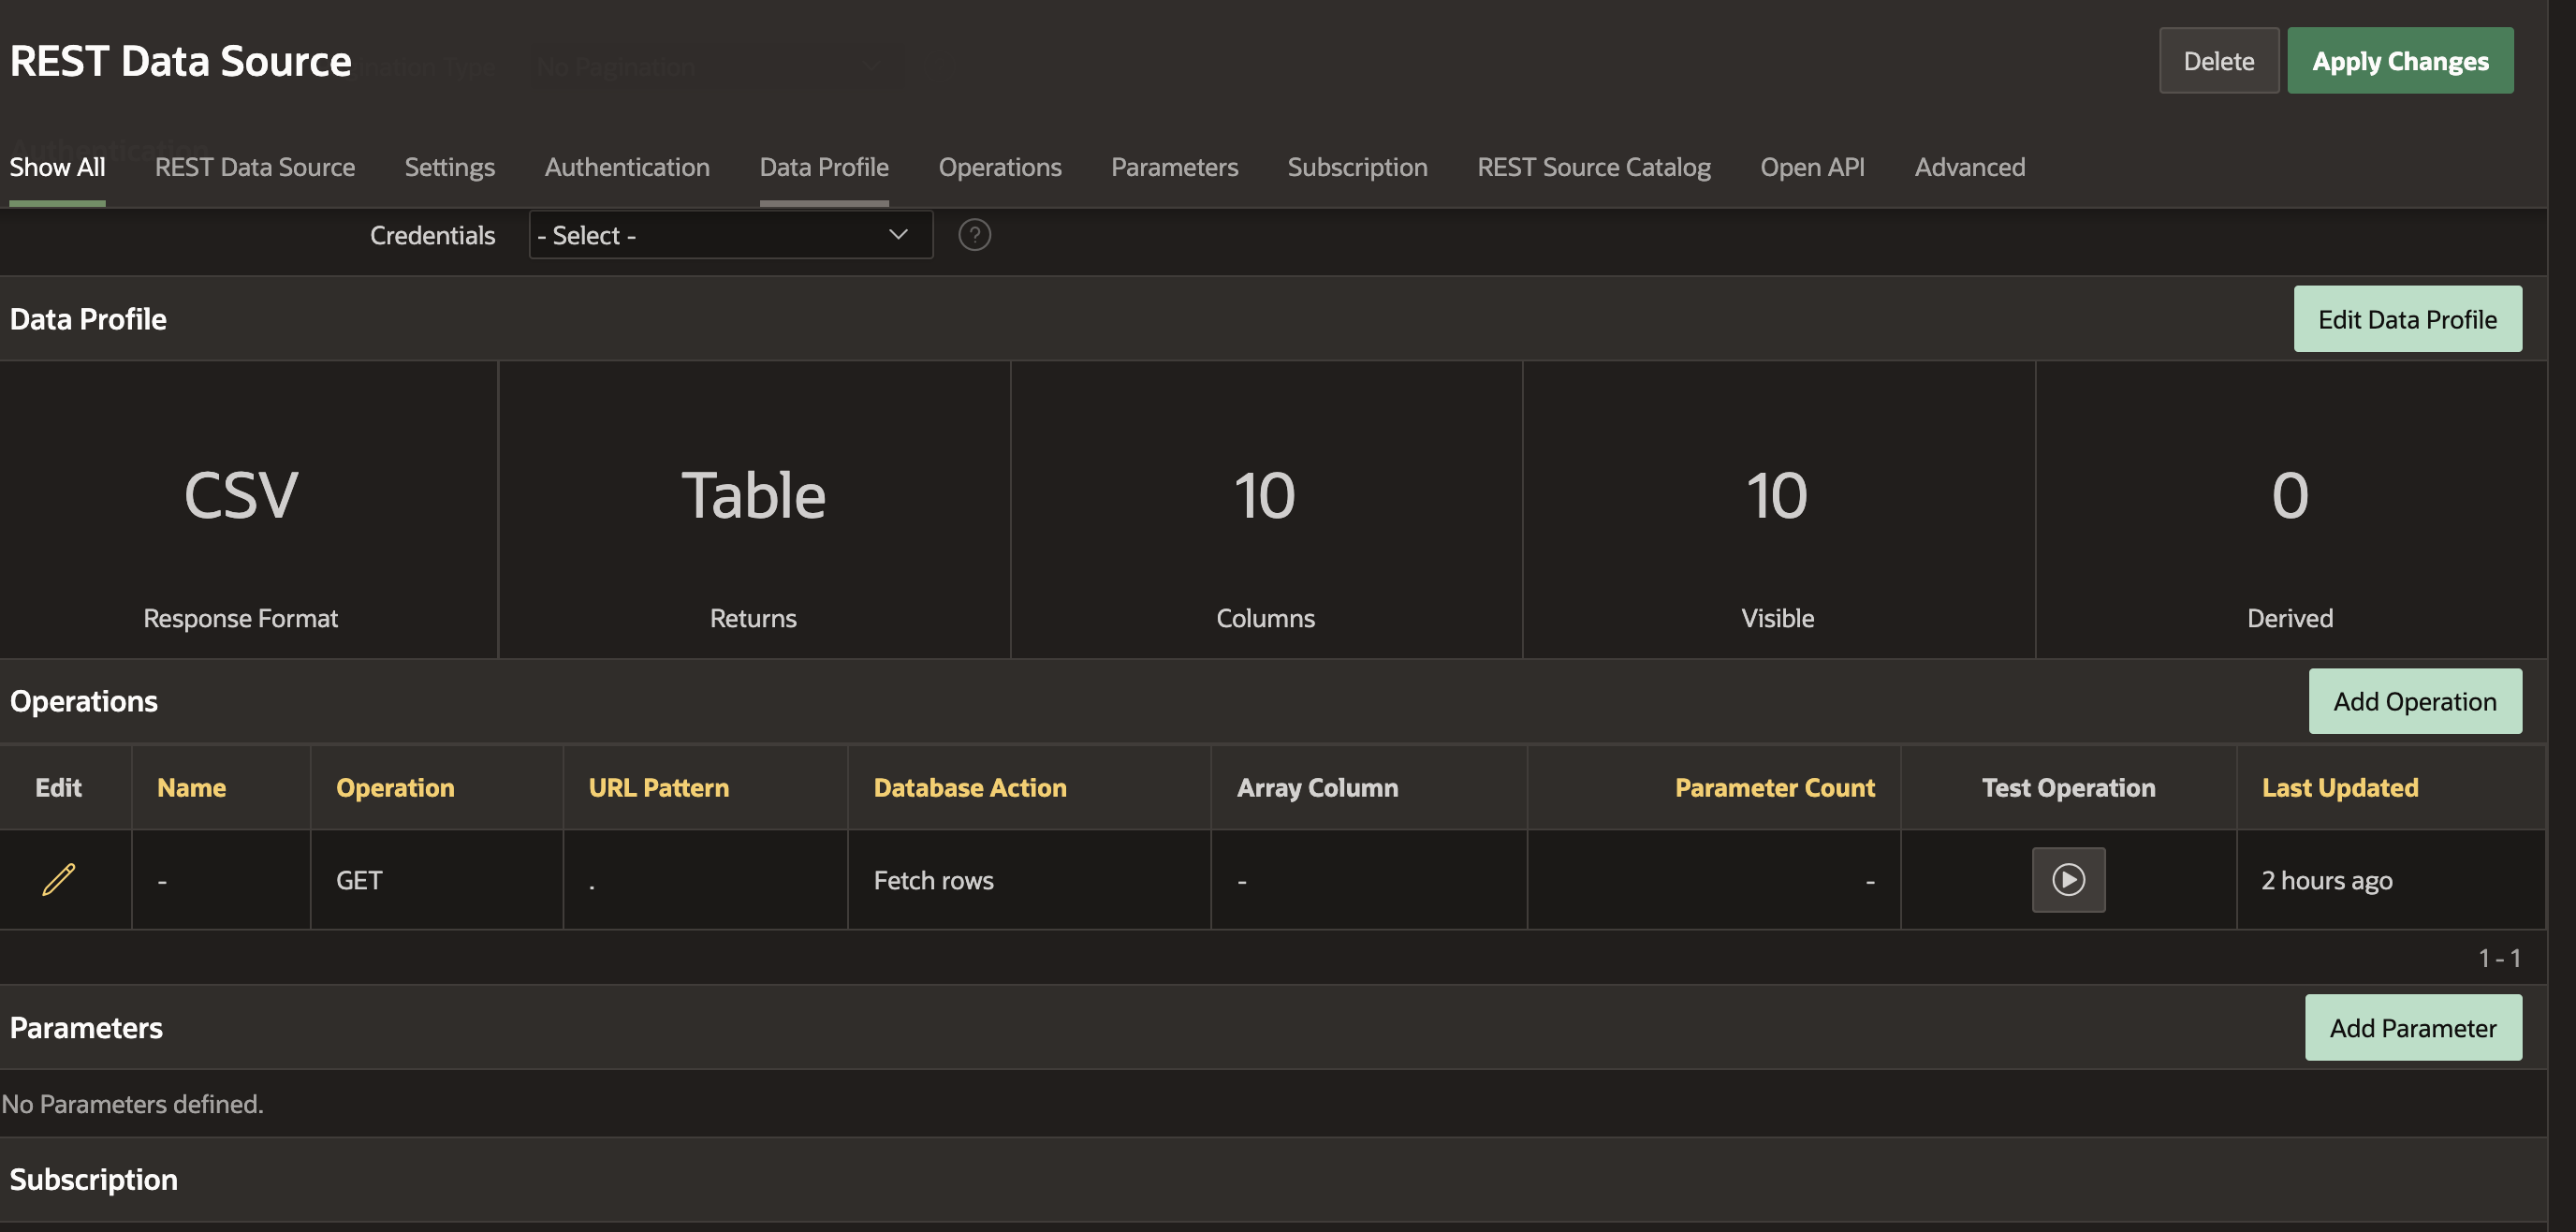
Fig. 23: Edit page to configure details of the REST Data Source.
The Operations section contains information about the HTTP methods which APEX can invoke on the endpoint URL. APEX allows to configure multiple operations, but in our case, only one (the existing) GET operation makes sense. Click the pencil icon to edit details of that operation. Then scroll down to the Caching section, where we can control whether the content is to be cached only within an APEX session, only for an APEX user, or for all users and sessions. We choose the latter and we want APEX to cache content for one hour, thus we enter 60 as the Invalide When attribute. The help text contains more information about what can be entered here. Besides a simple value, which is interpreted as minutes, APEX also accepts Oracle Database scheduler expressions. These allow to invalidate, for instance, at midnight, at the beginning of the week, at the top of the hour and so on.
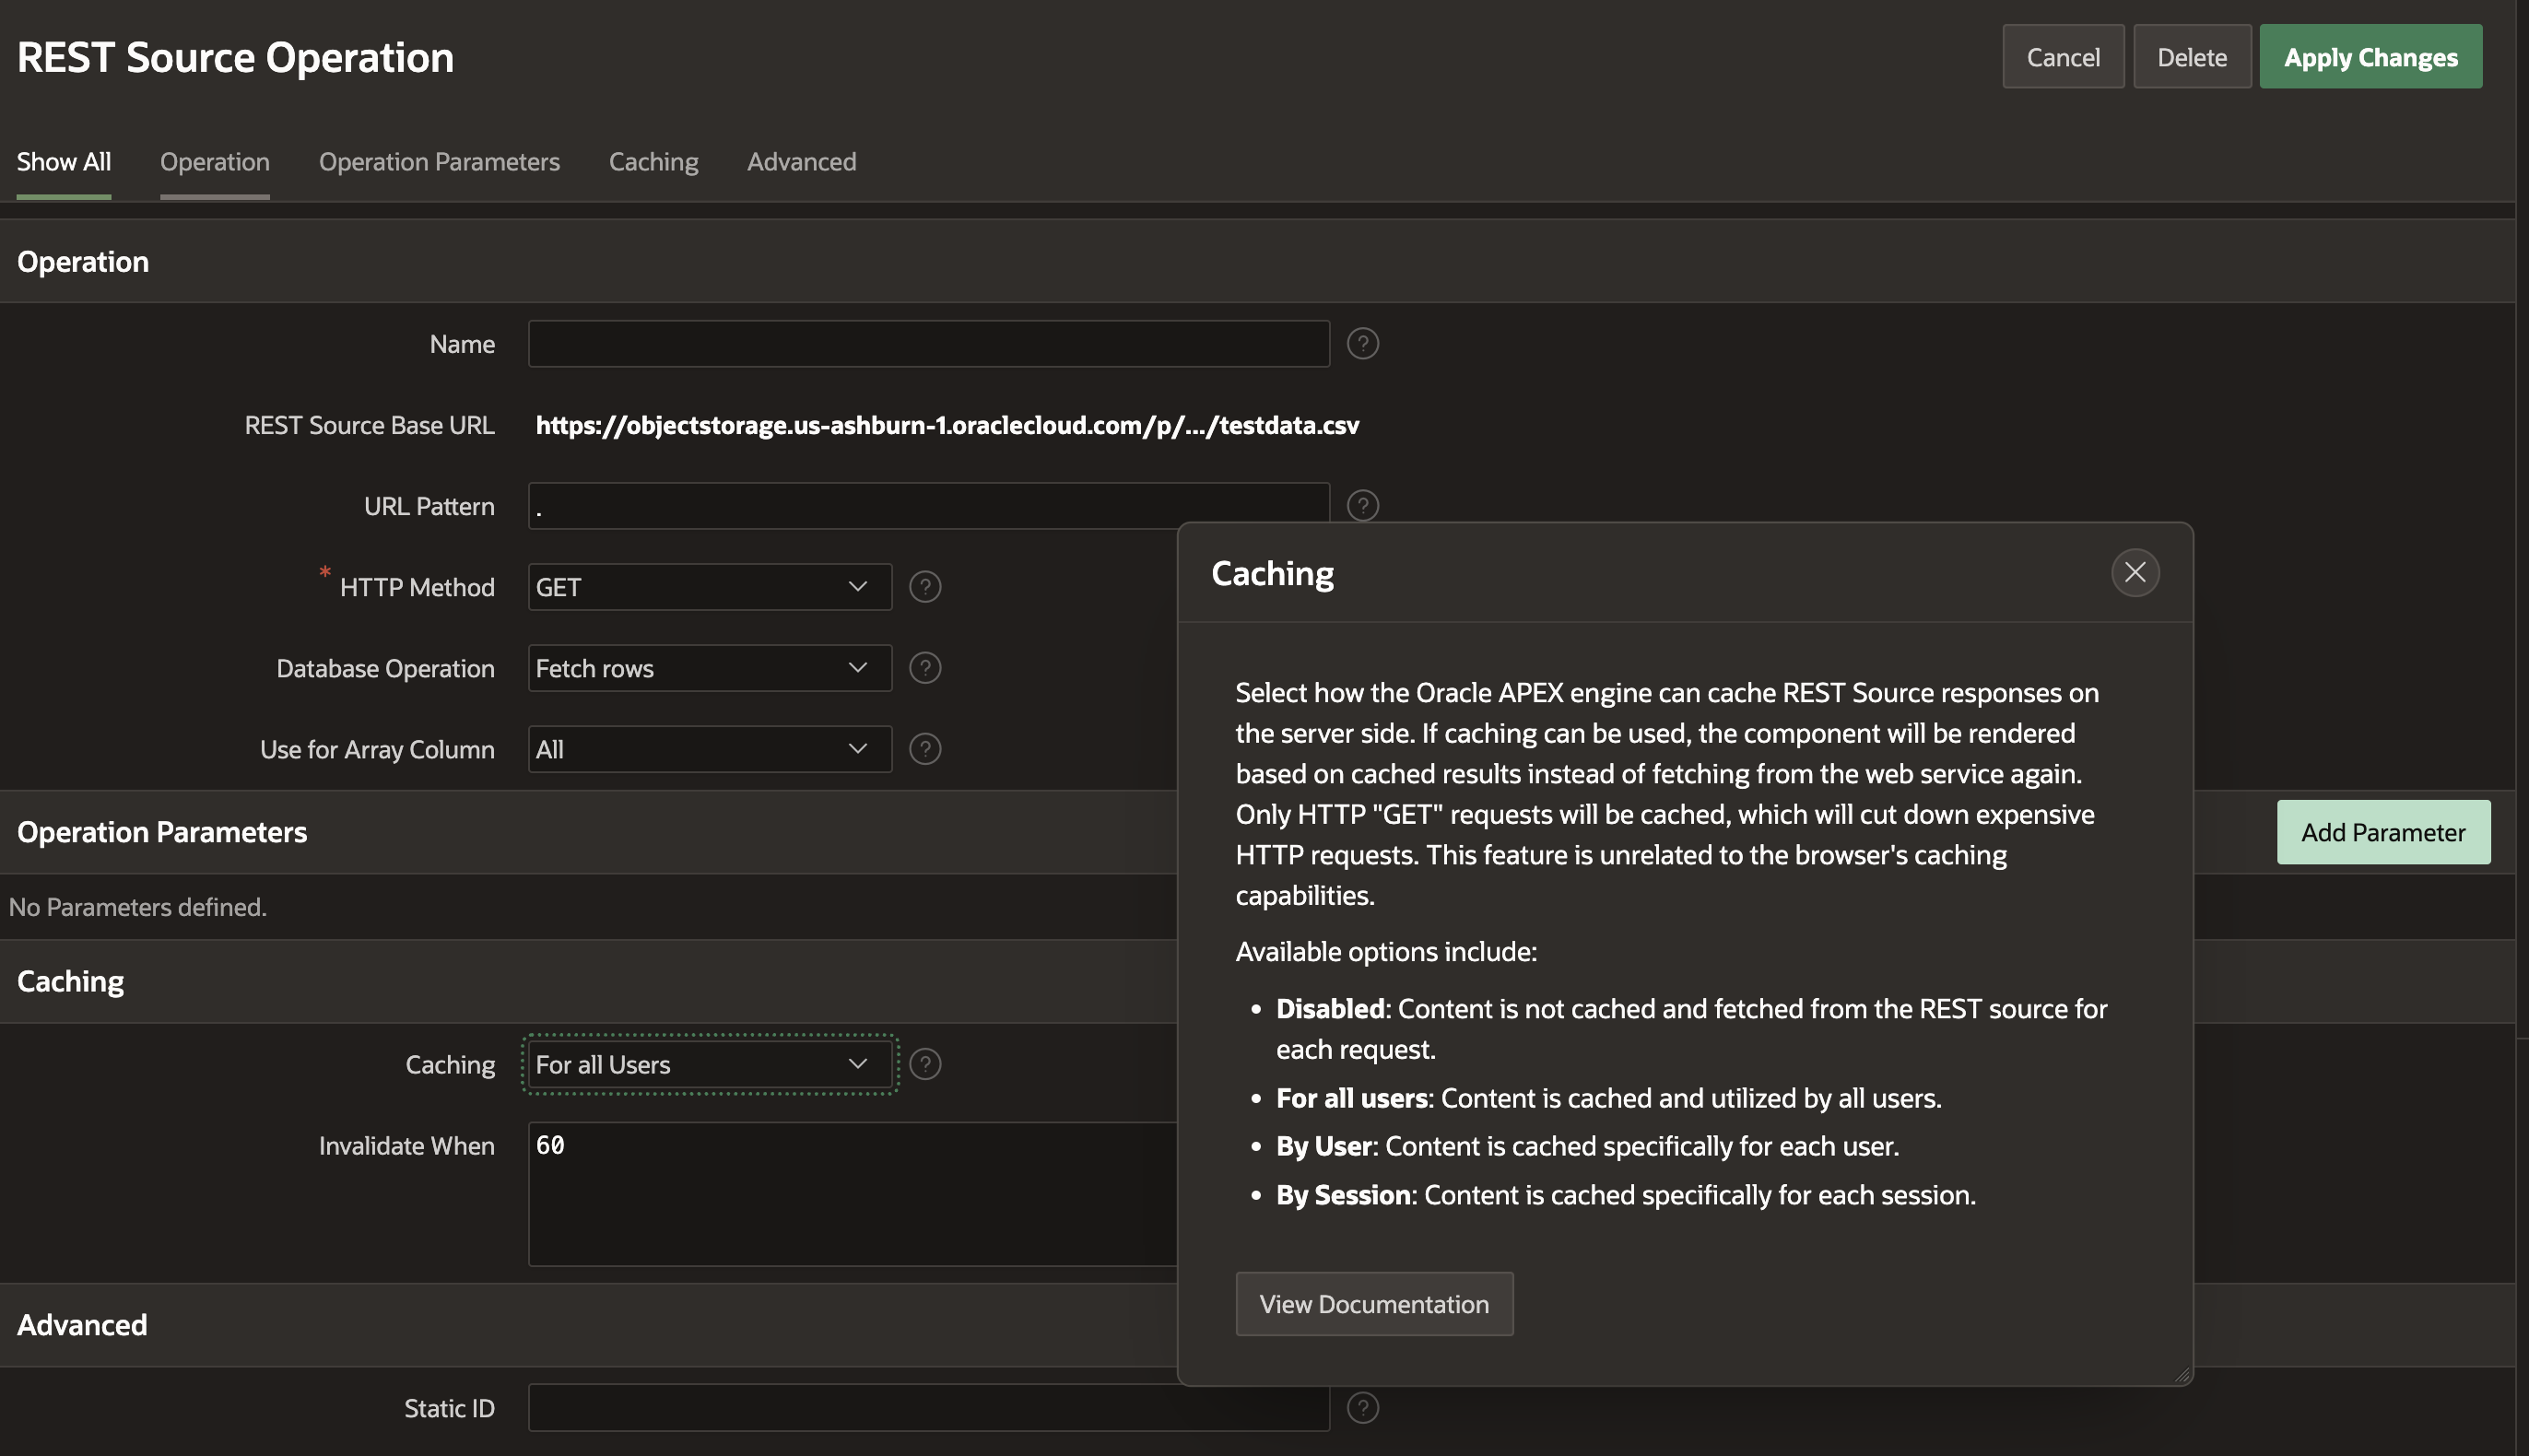
Fig. 24: Configure REST Data Source to cache data for one hour.
Save your changes and navigate back to the report and chart pages. You should notice that the pages now load quicker. However, note that APEX imposes a limit on the content size to be cached – if your CSV files are very large, you might see no effect. In these cases, REST Synchronization is probably more appropriate to cache data.
Speeding things up: Use Synchronization
Even with the cache in place, we can still optimize further. Although we’re now avoiding the HTTP requests to fetch the latest version of the CSV file, we’re still parsing the CSV content for every page (report, chart, other) view. That is a lot of overhead: APEX runs in the database – reports and charts are most efficient when relational tables are the data source. So, how could we further improve performance? By using REST Synchronization.
REST Synchronization allows to declaratively configure a scheduled download of the CSV data into a local table. When data is downloaded, we can decide whether we want to append to existing content, merge new data with existing rows or whether we want to completely replace existing data. This blog posting will not provide a detailed description of the REST Synchronization functionality, as that is available in the Synchronize Data from REST Services to Local Table. With no code at all! and Synchronize Parent-Child REST Sources blog postings.
To configure REST Synchronization, navigate to the edit page of the REST Data Source again. On the right side of the screen, click the Manage Synchronization link to configure a synchronization.
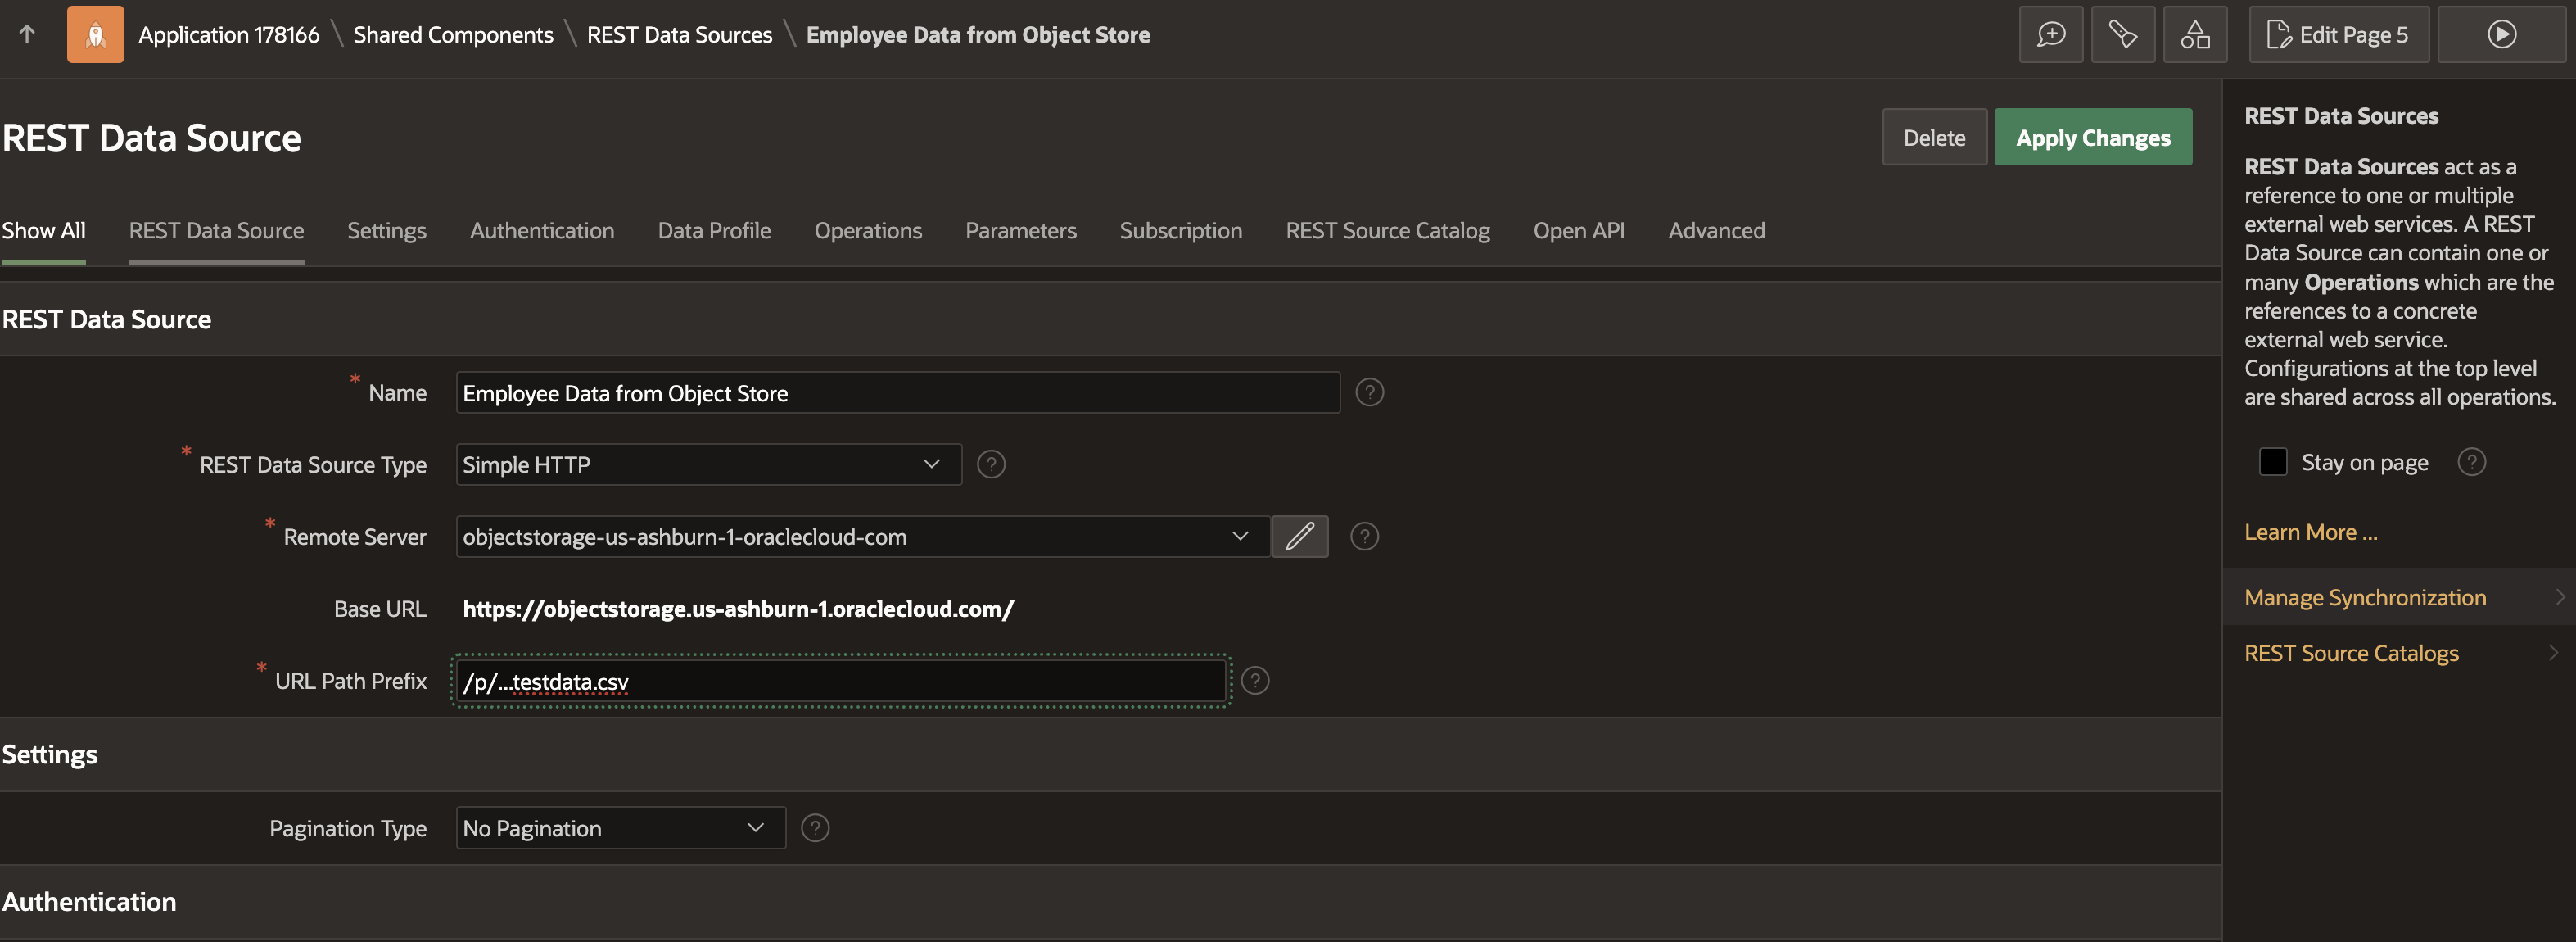
Fig. 25: REST Data Source details, with Manage Synchronization link.
On the REST Synchronization page, you’ll see that there is currently no synchronization configured. We are about to change that. We want to synchronize to a New Table, so enter the name of the new table to use (e.g. EMPLOYEE_LOCAL_FROM_CSV), and click Save.
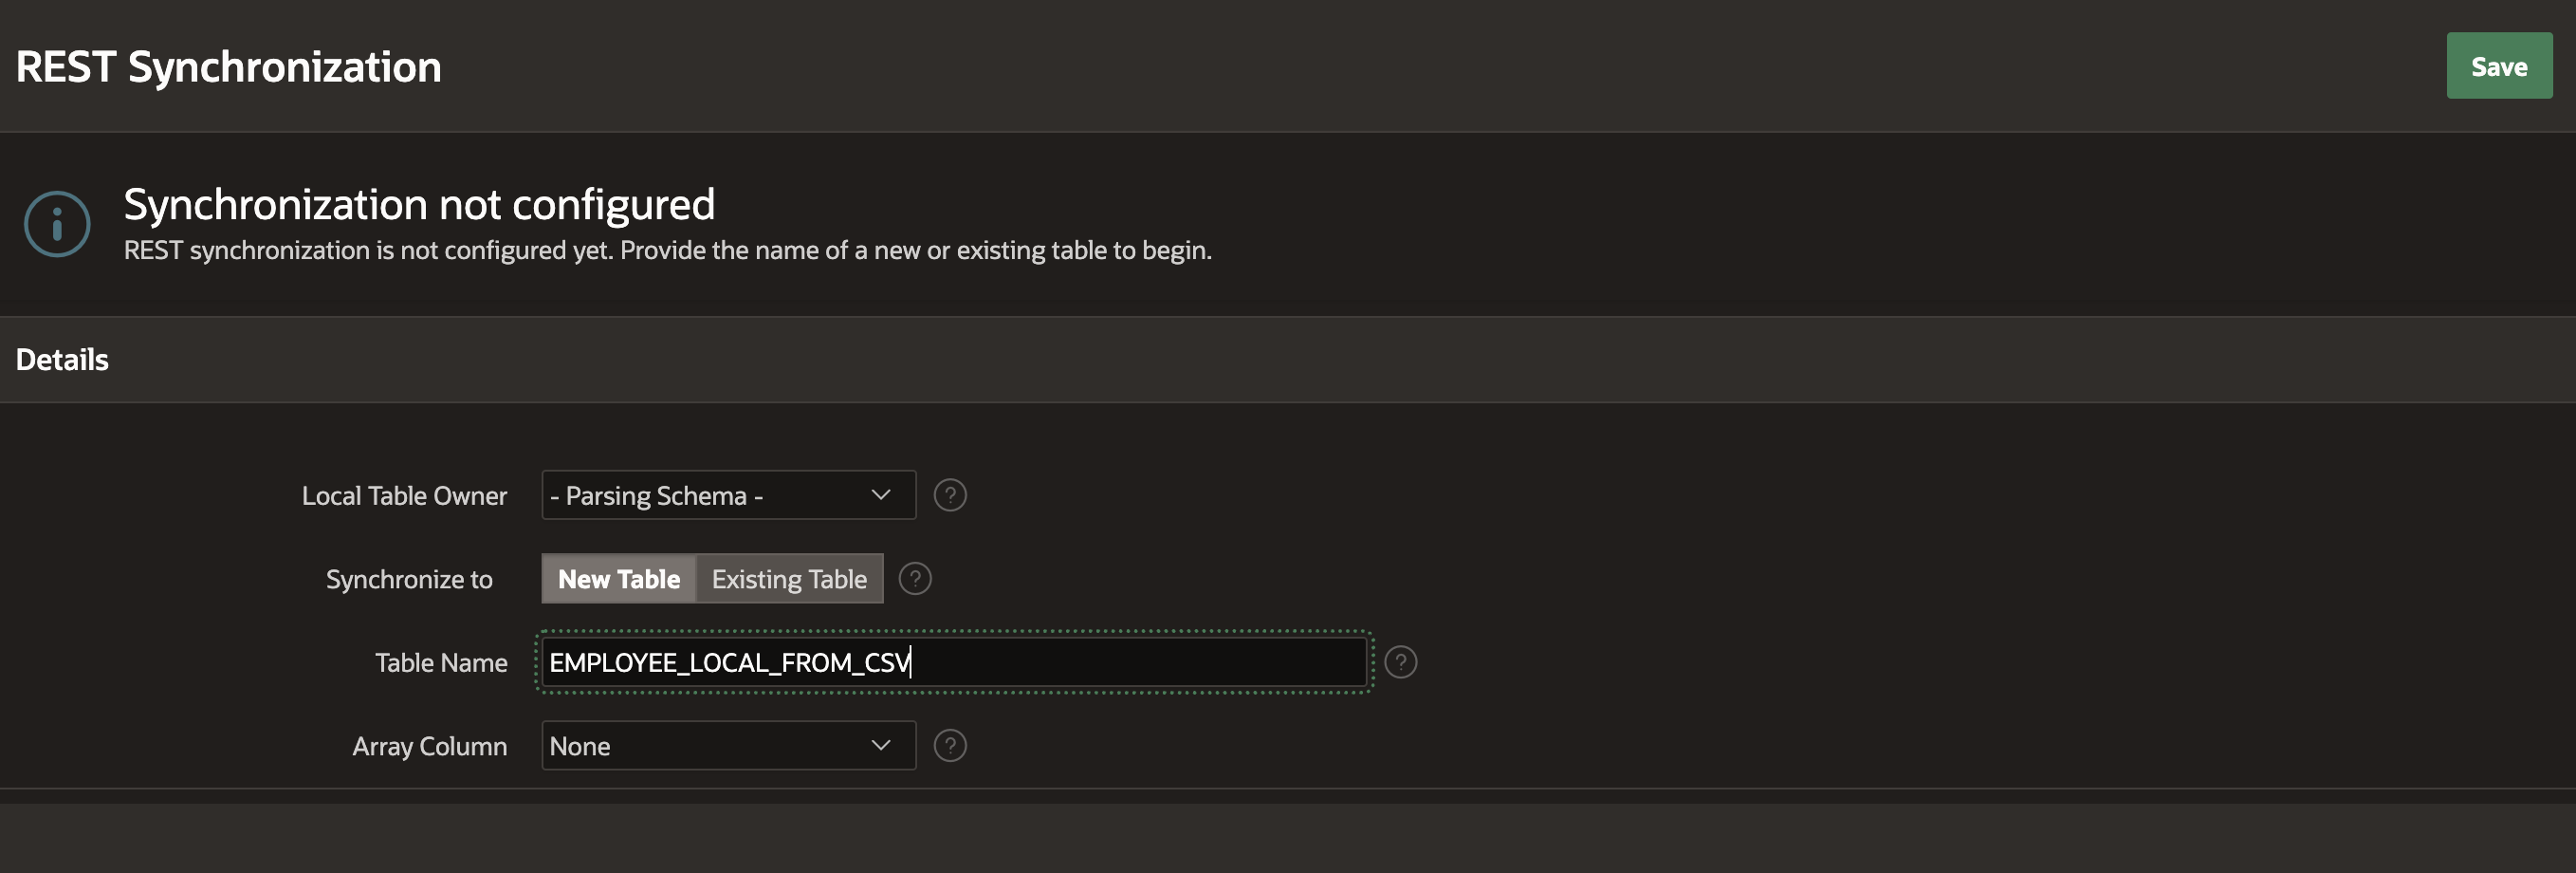
Fig. 26: Enable Synchrionization to a New Table.
On the Edit Synchronization page, you’ll first see a warning message which tells us, that the synchronization table does not yet exist. With the Create Table button, you can have APEX creating it. As an alternative, click the Show SQL button to review the CREATE TABLE SQL Statement, edit it and run it manually in SQL Workshop, SQL Commands. For now, let’s take the simple approach and have APEX creating the table for us: click Create Table.
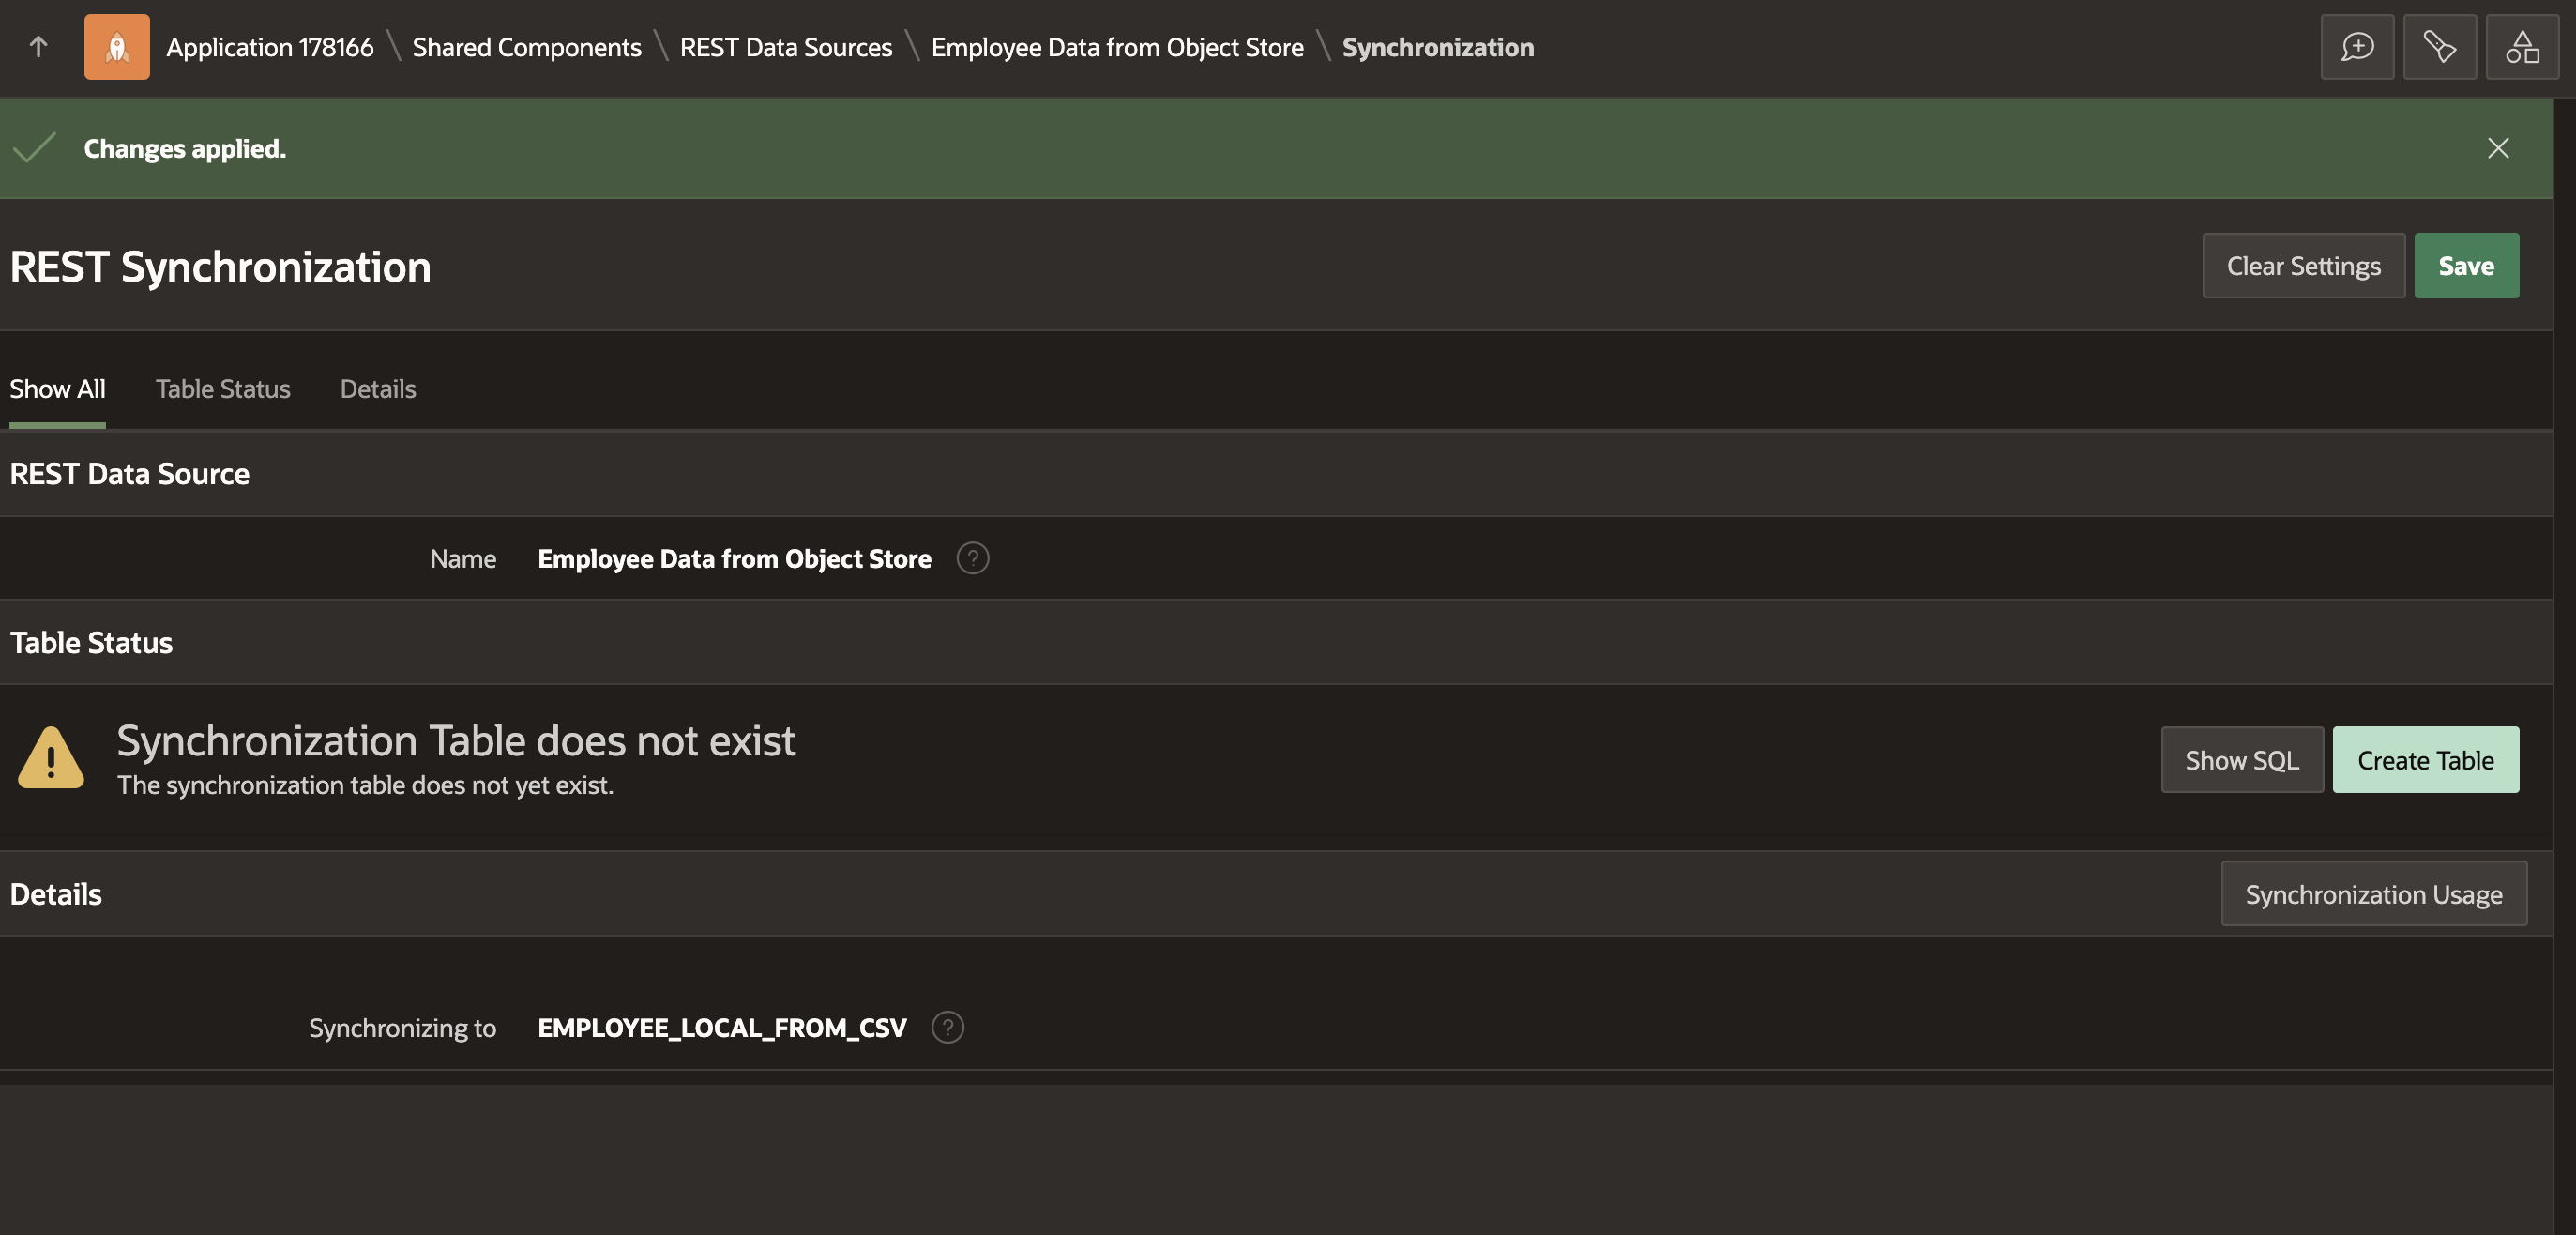
Fig. 27: REST Synchronization: The local table does not yet exist.
Now we see an information message that the local table exists and that it “is ready for synchronization“. If we created the table manually and its columns would differ from the information in the REST Data Source, we’d see a different message. In the Details section, click Replace as the Synchronization Type, so that the table is always cleared before new data is loaded. Finally you can define a Synchronization Schedule – the example in Fig. 28 (FREQ=HOURLY;INTERVAL=1;BYMINUTE=0;BYSECOND=0) will run at the top of the hour. The “clock with wrench” icon brings up a tiny wizard which helps setting up such simple schedules.
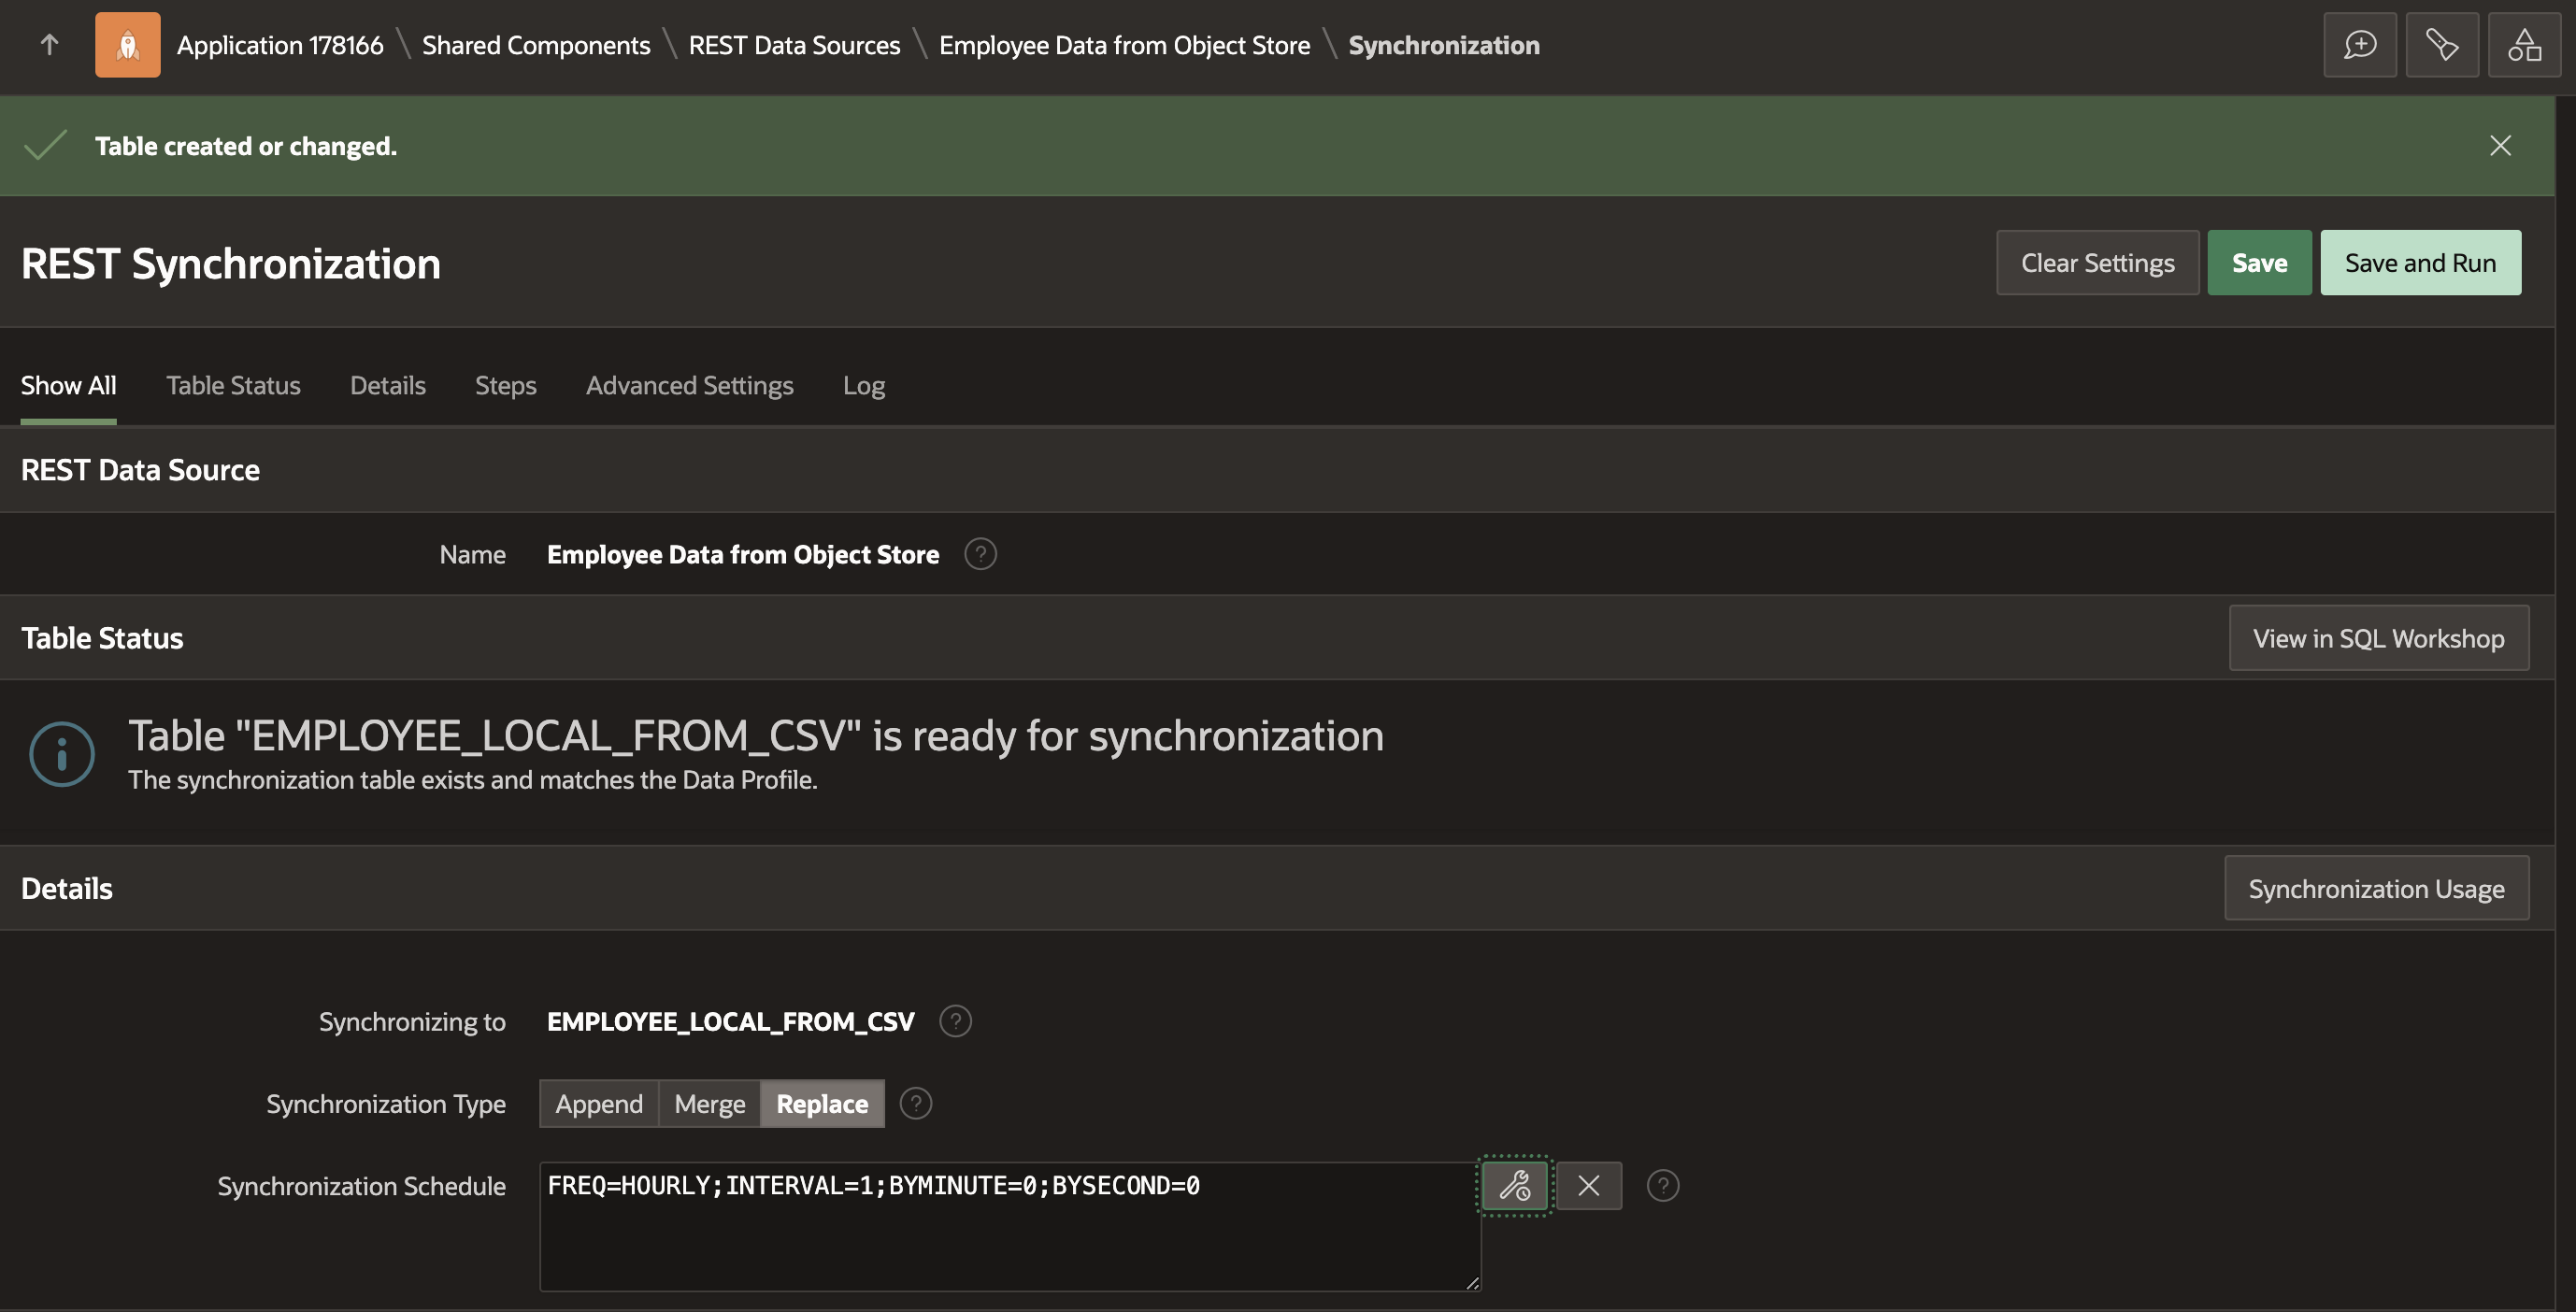
Fig. 28: Configure the synchronization to run at the top of the hour.
The Save and Run button saves your changes and directly kicks off a synchronization run. You will see a Running indicator as long as APEX is still fetching data (Fig. 29). Once the synchronization is complete, the Log section will contain a new entry with information on how many data rows have been downloaded, how long it took and whether it was successful or not (Fig. 30).
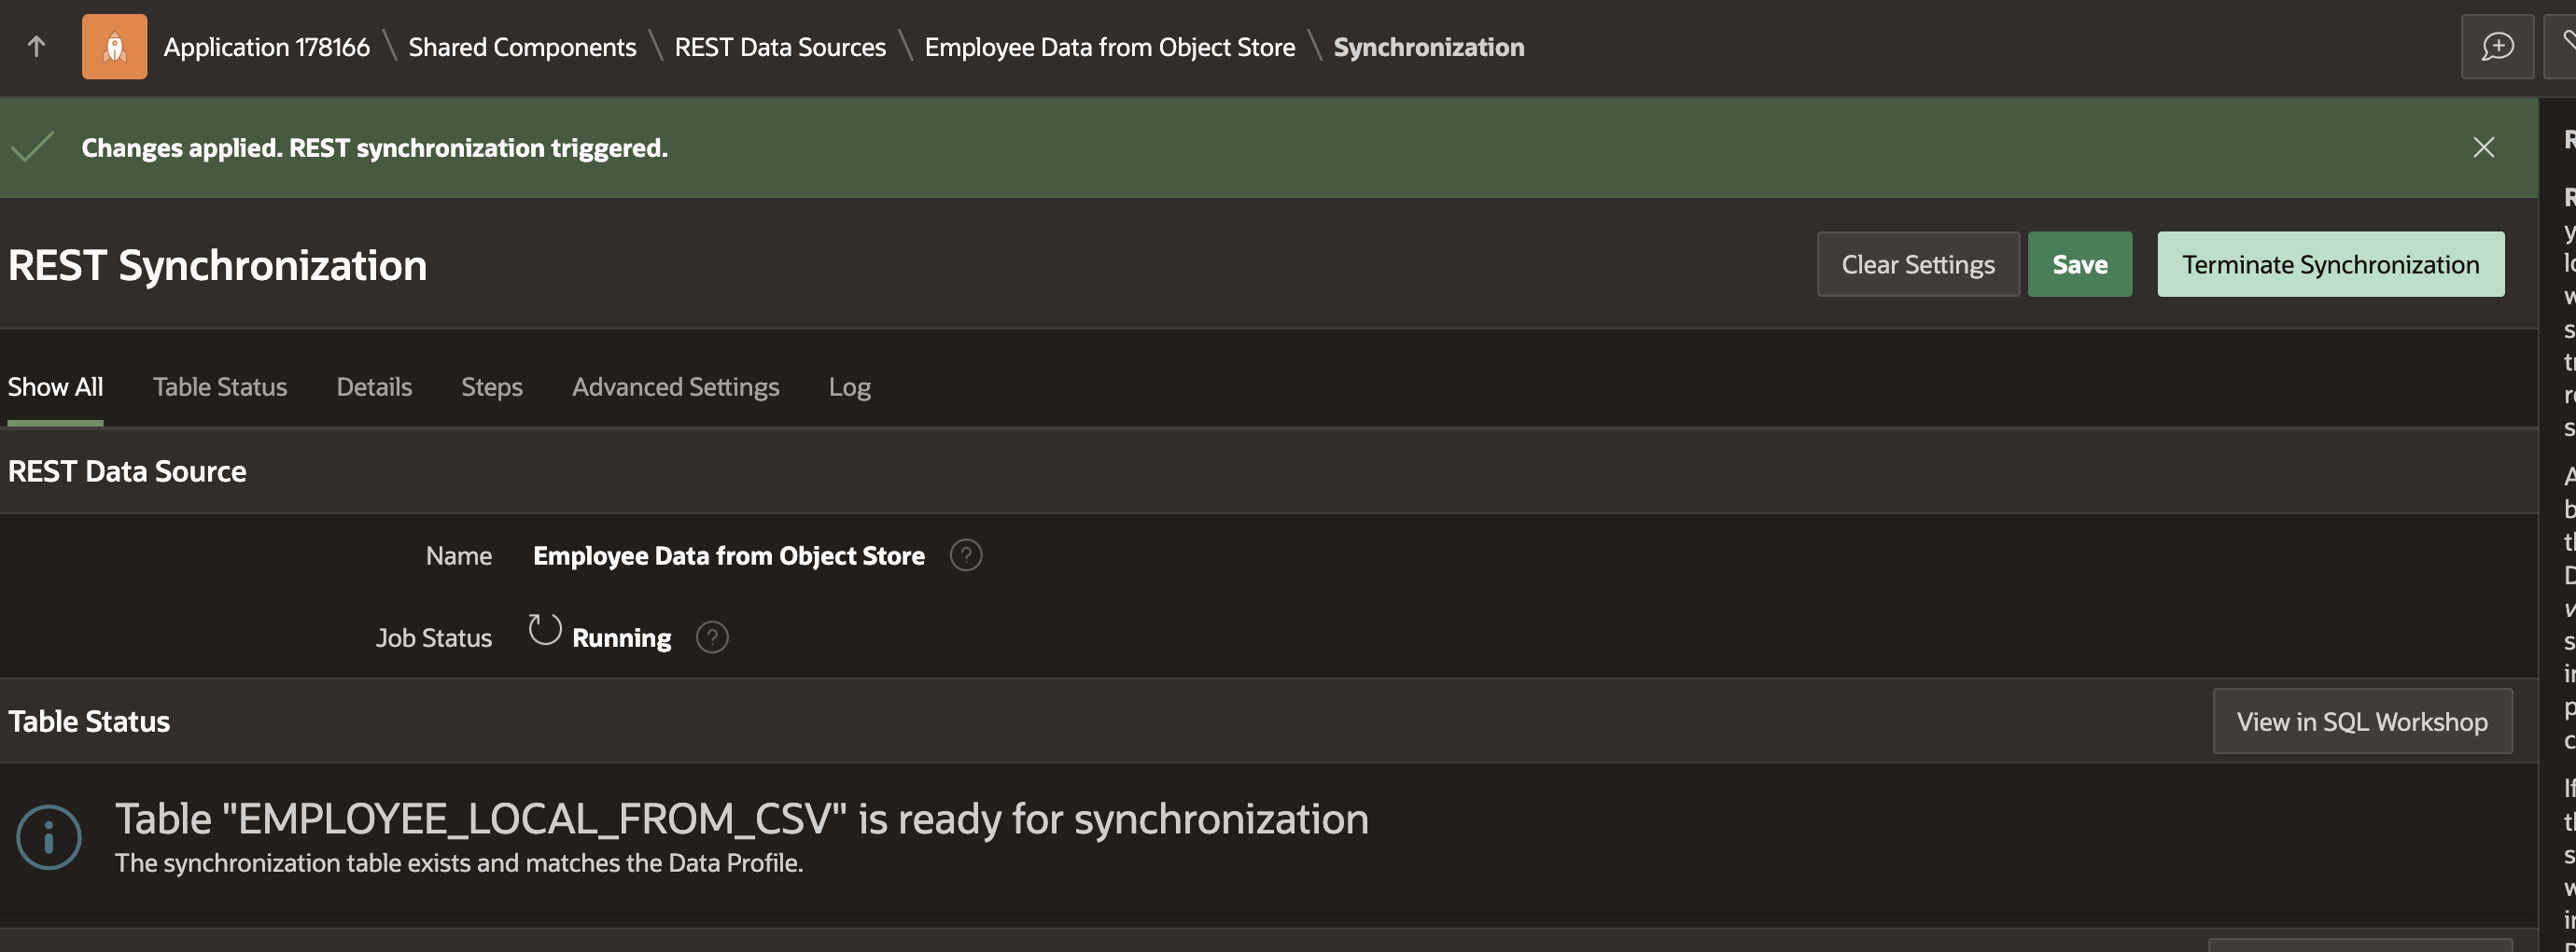
Fig. 29: Synchronization Configured successfully.
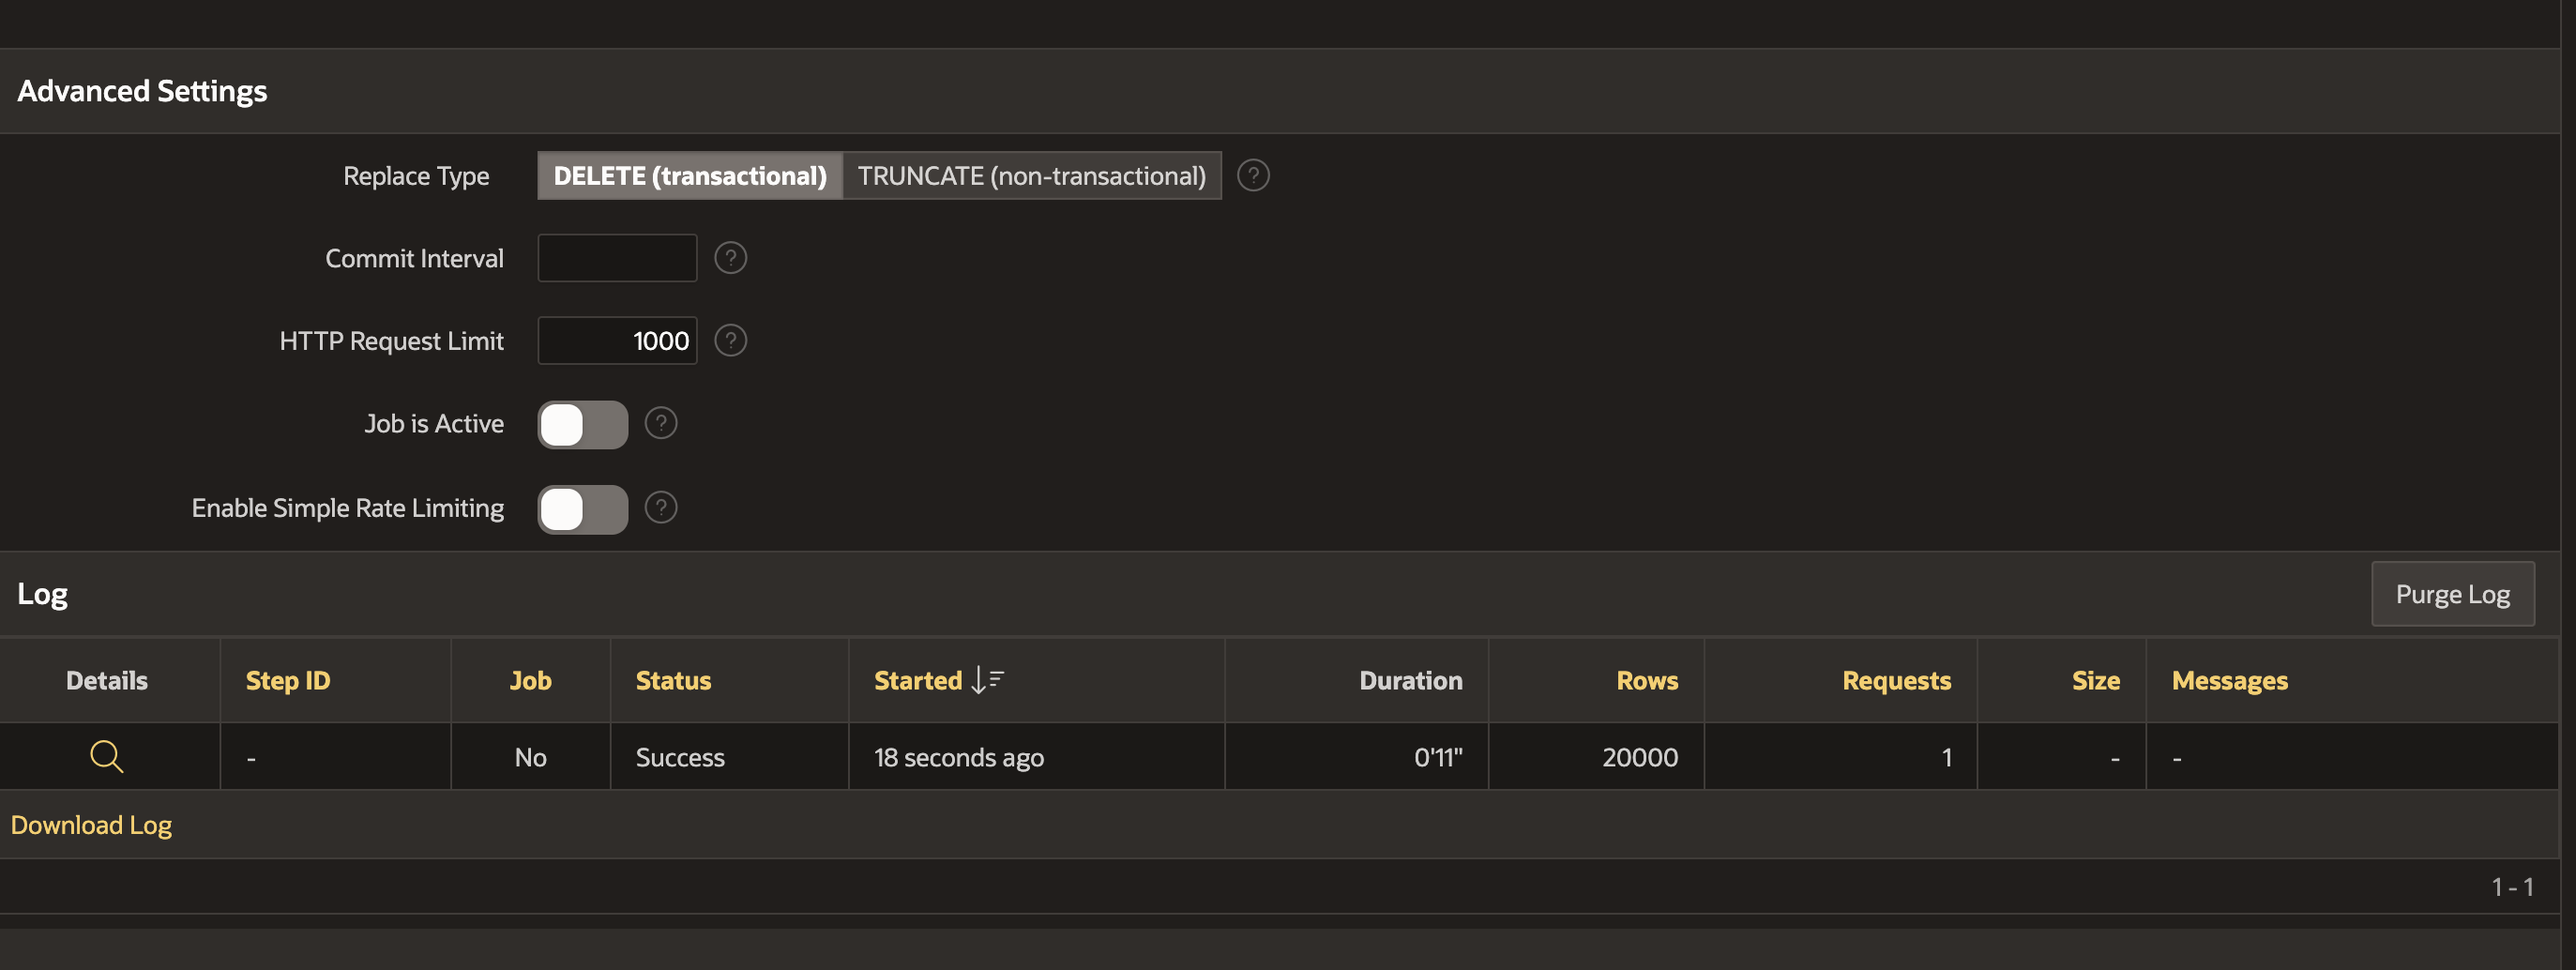
Fig. 30: Synchronization Log.
The View in SQL Workshop button takes you to SQL Workshop, where the local table and its data can be reviewed (Fig. 31).
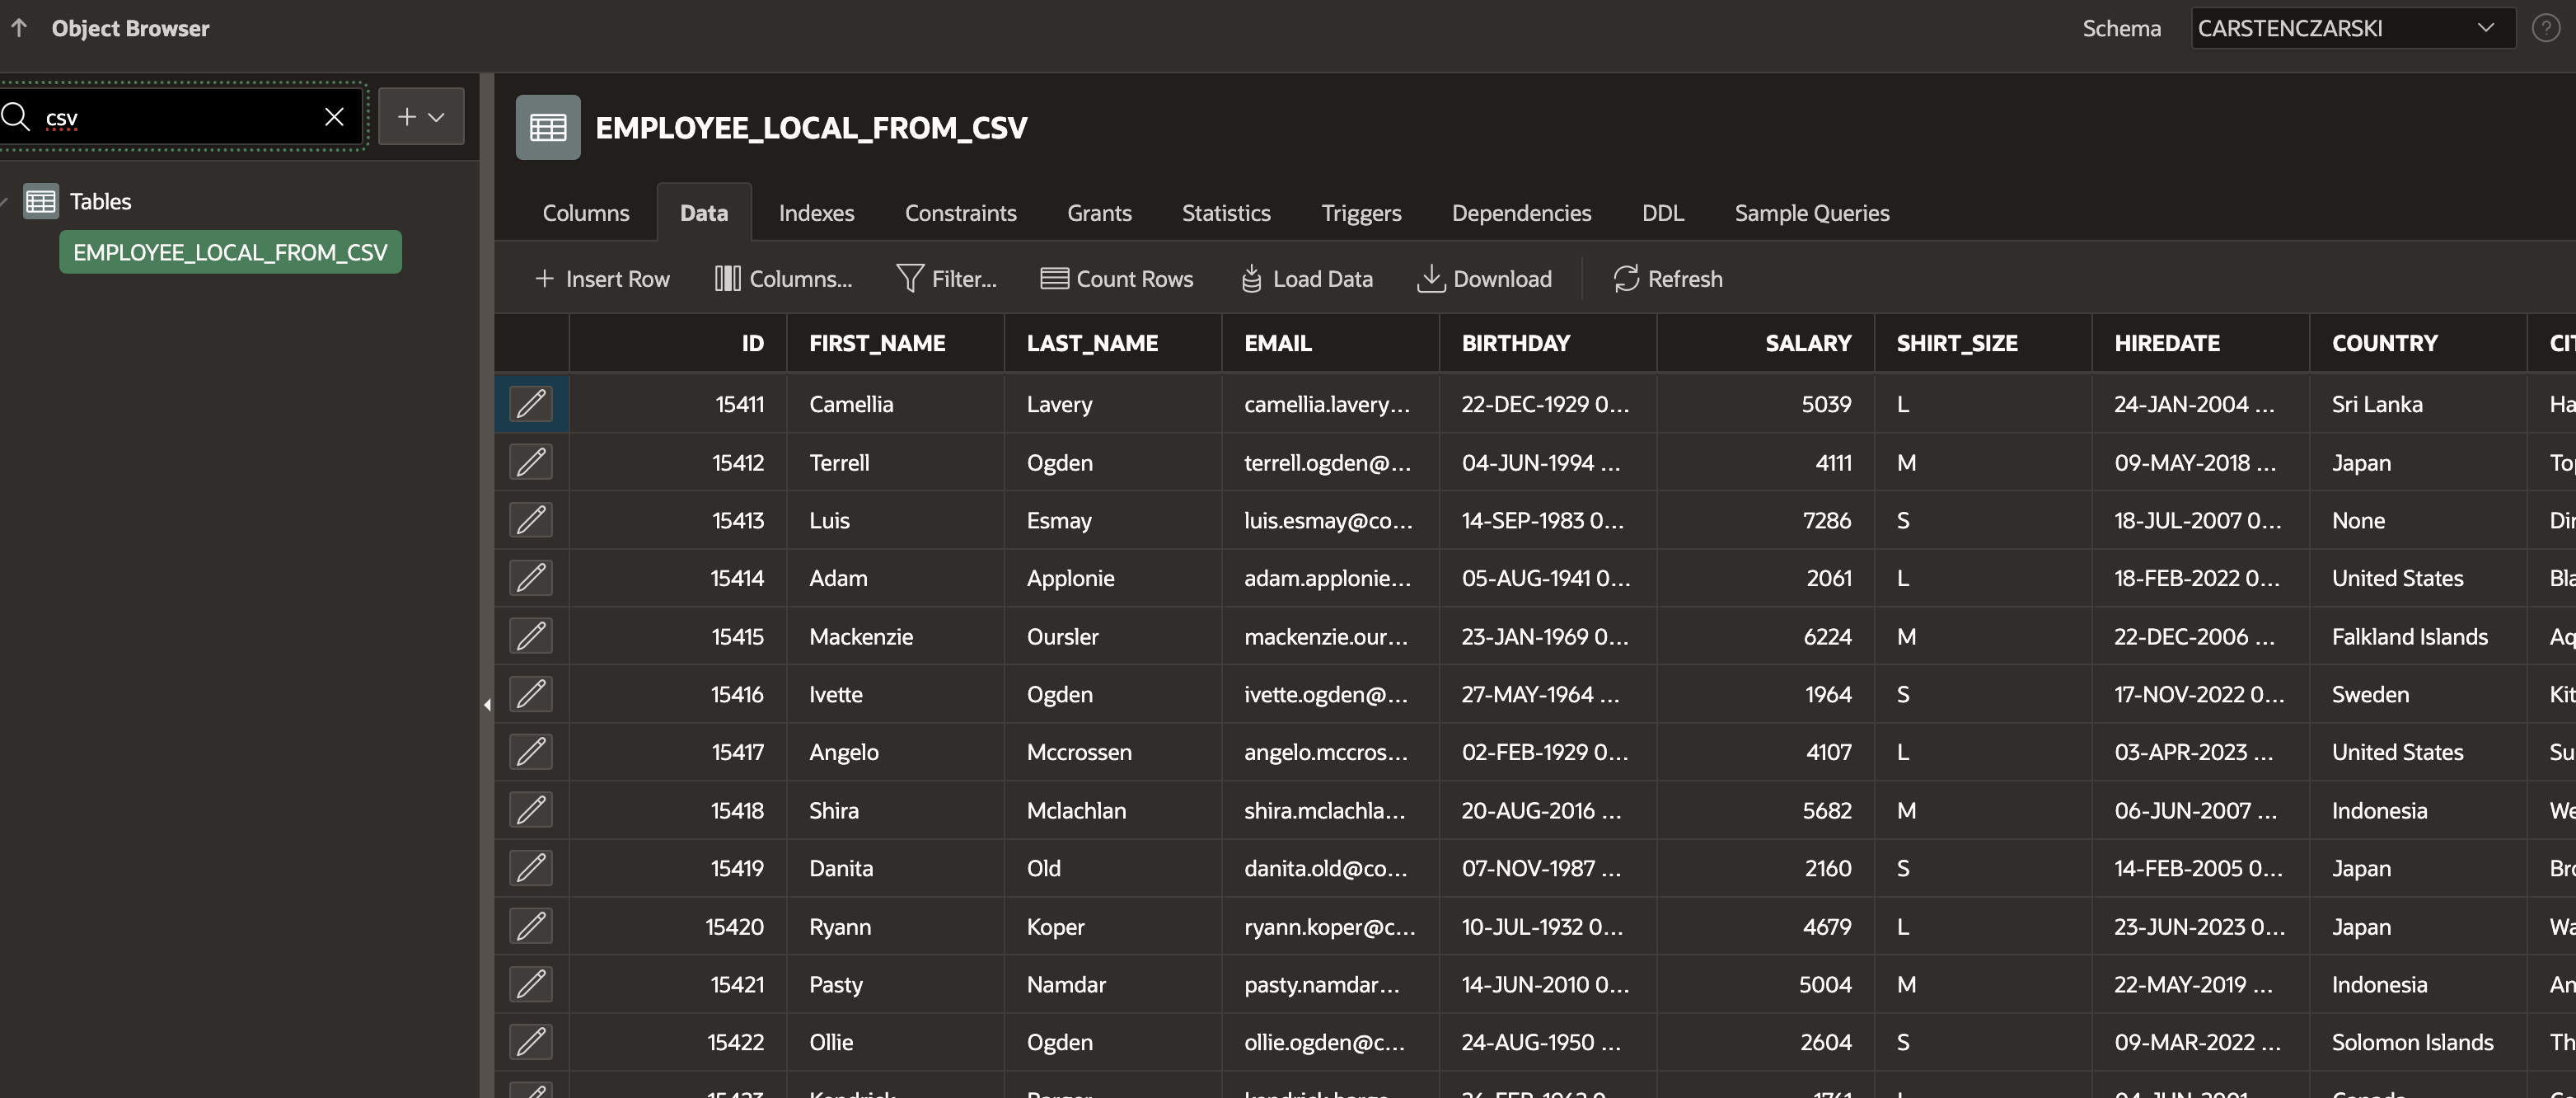
Fig. 31: Review data synchronized to local table.
As the synchronization has now been successfully configured, and as it works, we want the reports and charts in our APEX page to use it. For that, navigate back to Page Designer, for both the report and chart pages. Look up the report region or chart series, and head to the attributes area on the right. Below Source, there is now a new REST Synchronization section, with a switch to control whether the current region or chart series should use the local synchronization table. Enable that switch for the interactive report as well as for the chart.

Fig. 32: Enable the Interactive Report to use the local synchronization table.
Finally run your pages again. Now, all visualizations are super-fast and snappy. However, as they’re now working with local tables, instead of the remote CSV file, they might become outdated until the next synchronization run kicks in. Ideally, the synchronization schedule is being aligned with the refresh cadence of the CSV file on the remote Object Store bucket. For instance, if some process refreshes that CSV file every night at 1am, the synchronization is best to kick in only shortly after that, e.g. 1:10 am.
Summary
In this blog posting you’ve learned how to visualize data from remote CSV files using APEX, REST Data Sources and page components like reports or charts. To speed up processing and to avoid APEX making HTTP requests all the time, we can enable Caching or REST Source Synchronization. All these capabilities are available declaratively, without the need to author a single line of code.
