Native row selection, smarter output rendering, column-level CSS classes, a row display limit, and a Trigger Action to invoke IR dialogs directly — here’s everything that shipped in APEX 26.1.
Interactive Reports are central to how many APEX applications present and explore data. Oracle APEX 26.1 introduces natural language support for Interactive Reports, giving users a new way to refine reports conversationally. This post focuses on the additional enhancements in this release that make Interactive Reports more flexible for developers, more useful for end users, and better suited for richer report output.
These enhancements include declarative row selection, column-level CSS classes, a better way to limit displayed rows, direct access to Interactive Report dialogs from custom controls, and improved rendering for larger and more complex reports.
1. Declarative Row Selection
Oracle APEX 26.1 introduces built-in declarative row selection for Interactive Reports. Users can now select rows using checkboxes, and developers can configure the entire interaction directly in Page Designer without writing custom code.
This makes it much easier to support use cases such as bulk approvals, batch updates, exports, and other multi-row operations. Selected row values are immediately available to Dynamic Actions and page processes, which makes downstream processing straightforward.
Three new attributes in Page Designer
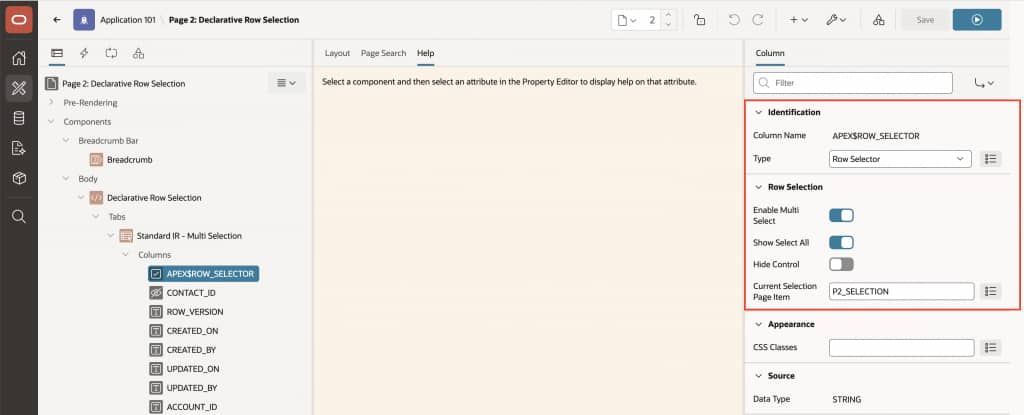
To support row selection, Oracle APEX 26.1 adds three new attributes under the Row Selector column in Page Designer:
- Enable Multi Select: Enables row selection and displays a checkbox for each row. This setting must be turned on before any other row selection behavior becomes available.
- Show Select All: Adds a checkbox to the column header so users can select or deselect all currently visible rows with a single click. This setting applies only when Enable Multi Select is set to Yes.
- Hide Control: Hides the row selector column from the user interface while keeping row selection active behind the scenes. This is useful when selection is managed programmatically through the JavaScript API rather than through visible checkboxes.
Alongside these three attributes, there is one additional configuration worth knowing about:
- Current Selection Page Item: Binds a page item, such as P1_SELECTED_IDS, to the report selection. APEX automatically populates the item with a colon-delimited list of the primary key values for the currently selected rows. This allows page processes and Dynamic Actions to reference the selected values directly.
How to set it up
- Open your page in Page Designer and select the Interactive Report region.
- Right-click on Columns under your Interactive Report region and select Create Row Selector. This is the quickest way to add the Row Selector column — it activates the three new attributes in the properties panel instantly.
- Set Enable Multi Select to
Yesto allow users to check multiple rows at once. - Set Show Select All to
Yesif you want the header-level checkbox that selects every visible row in one click. - Leave Hide Control as
Nofor standard use. Set it toYesonly if you plan to manage selection entirely through the JavaScript API and don’t want checkboxes visible to users. - Set Current Selection Page Item to a page item – for example
P1_SELECTED_IDS. APEX will automatically populate this with selected primary key values as the user interacts with the report. - Create a Trigger Action on the Selection Change [Region] event to react to user selections – trigger a process, refresh a region, update a form, whatever your workflow needs.
- Save and run. Checkboxes appear in the report, and selected values are immediately available to any downstream page process via the bound page item.
Note: If you’re using Hide Control with the JS API, the key methods on the region interface are getSelectedValues() to read the current selection, setSelectedValues() to select rows by value, and selectAll() to select everything at once. These are fully documented in the APEX JS API docs.
2. More Efficient Report Rendering
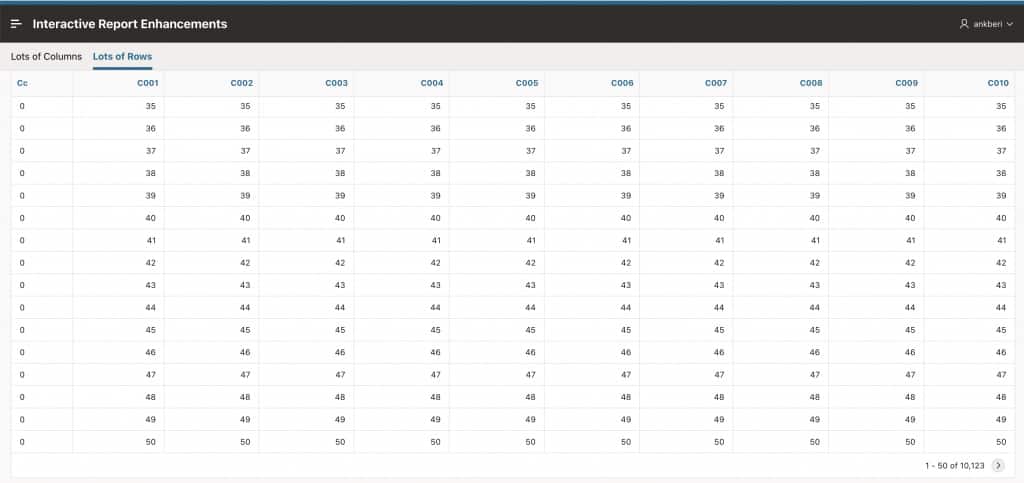
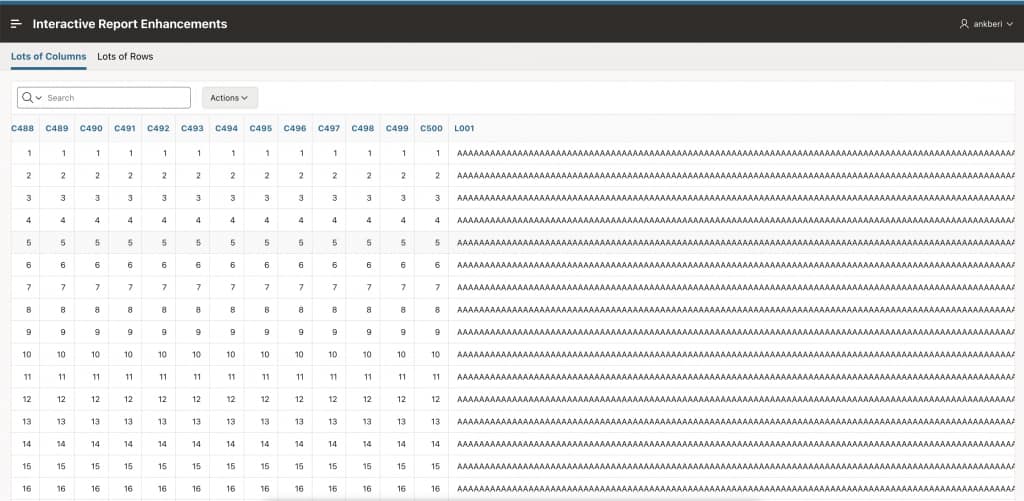
Interactive Reports now use a more efficient rendering approach for larger and more complex output. This lifts the previous 32K row output limit, giving reports more room for many columns, longer text values, and richer templates.
There is nothing to configure and no migration required. Existing Interactive Reports automatically benefit from this improvement.
3. A Better Way to Limit Displayed Rows
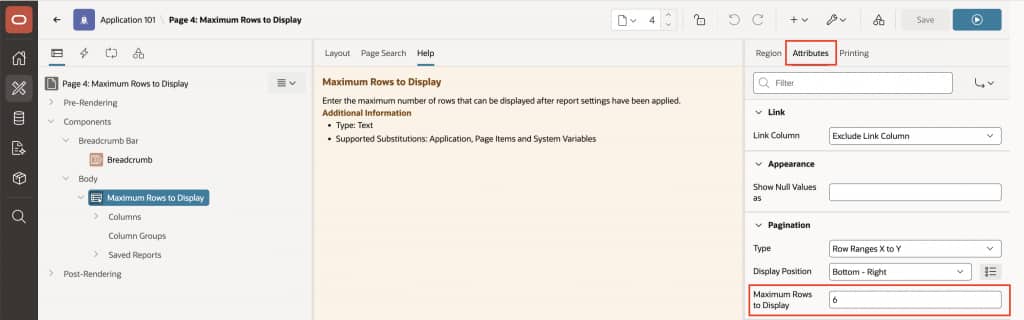
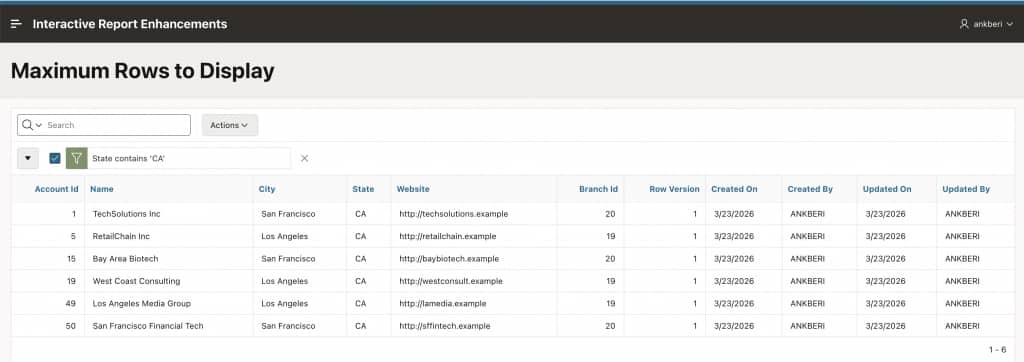
Interactive Reports now have a new property: Maximum Rows to Display. This controls the maximum number of rows shown to the user after all filters, sorting, and report logic have been applied.
The two properties : Maximum Rows to Process and Maximum Rows to Display are mutually exclusive. You can only set one of them at a time. We encourage you to use the new Maximum Rows to Display property, as it always reflects the fully processed and correctly filtered data, making it the better choice when working with large datasets.
- Maximum Rows to Process limits rows before filters and sorting run
- Maximum Rows to Display limits rows shown after all report logic completes
The new property is the preferred approach for capping displayed results, since it always reflects the fully processed, correctly filtered data. Both properties are supported and existing configurations continue to work without any changes.
How to set it up
- In Page Designer, select your Interactive Report region.
- In the Attributes panel, scroll to the Pagination section.
- Set Maximum Rows to Display to the number of rows you want to cap the output at. Since the two properties are mutually exclusive, setting this will clear any value previously set in Maximum Rows to Process.
- Save and run. Users will now see at most the number of rows you specified, reflecting the fully filtered and sorted data.
Note: A simple way to think about the difference is this: Maximum Rows to Process is an upstream limit on raw data, while Maximum Rows to Display is a downstream limit on what the user actually sees.
4. Column-Level CSS Classes
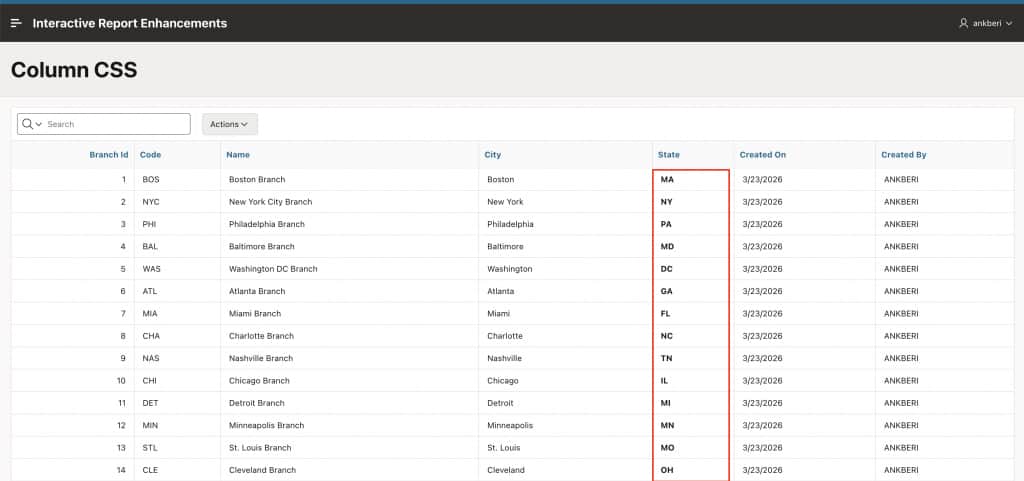
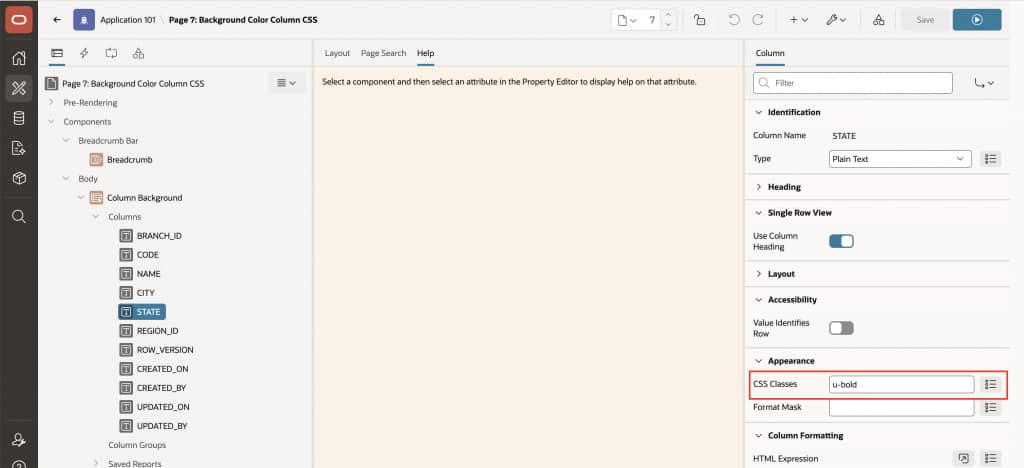
Interactive Reports now support assigning CSS classes directly to columns in Page Designer. The specified class is rendered on the <td> element at runtime, which gives developers a clean way to apply column-level styling.
The attribute also supports substitutions, allowing the CSS class to be determined dynamically using values such as application items, page items, column values, or system variables.
This opens the door to patterns such as:
- Highlighting values conditionally
- Driving presentation from page state
- Applying context-aware styling
- Aligning Interactive Reports with shared design systems
This enhancement also brings Interactive Reports in line with Interactive Grid and Classic Reports, where column-level CSS classes have already been available.
How to set it up
- In Page Designer, expand your Interactive Report region and click the specific column you want to style.
- In the column’s Appearance section, find the new CSS Classes attribute.
- Enter a utility class directly , for example
u-color-18oru-bold. APEX ships with a set of built-in utility classes you can use out of the box. You can also enter multiple classes separated by a space. - The class is applied directly to each
<td>cell in that column at runtime , no Inline CSS or custom stylesheet required. APEX handles the rendering automatically. - For dynamic classes, use substitution strings , for example
&STATUS_CLASS.referencing a column value or page item. The substitution is resolved at runtime per row, so each cell can carry a different class based on its data.
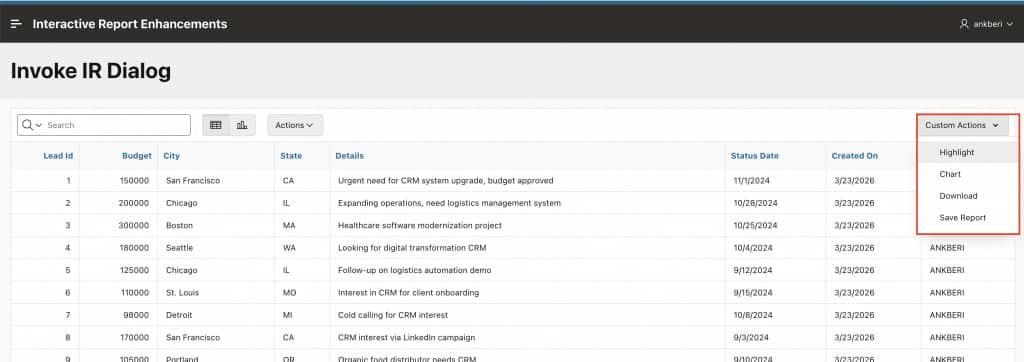
5. Open Interactive Report Dialogs from Custom Controls
A Trigger Action called Invoke Interactive Report Dialog lets you open any IR dialog directly from a button, icon, or other page control, without going through the standard Actions menu.
This puts real flexibility in your hands as a developer. Place a “Select Columns” button exactly where your layout needs it. Add a download icon that opens the IR download dialog with a single click. Any IR dialog, surfaced wherever makes sense for your users.
A few practical examples:
A custom toolbar button that opens the “Select Columns” dialog. A standalone download icon that triggers the Download dialog directly. A shortcut into the Filters dialog from anywhere on the page. All declarative, no custom JavaScript needed.
This is especially useful for custom page layouts and guided reporting workflows, where direct access to specific report controls makes a real difference in user experience.
How to set it up
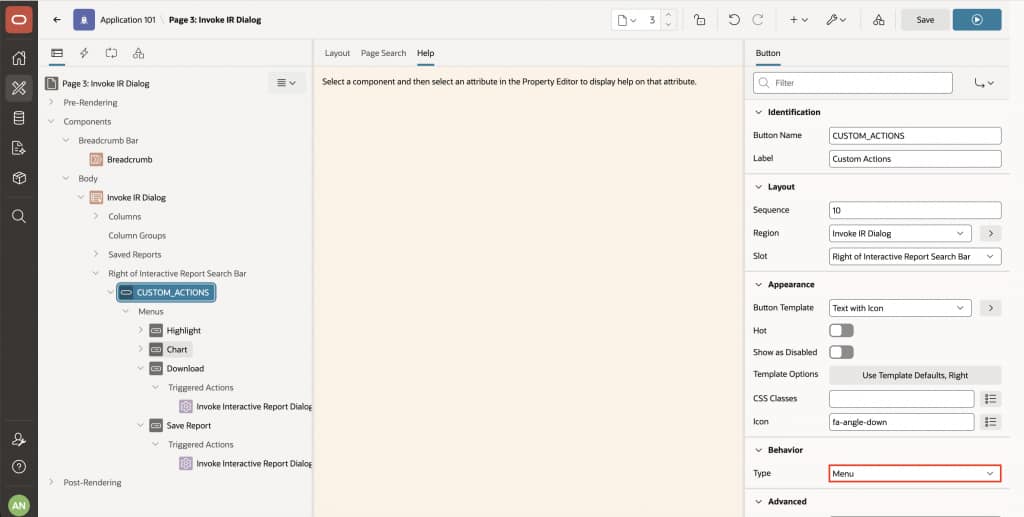
Step 1 : Create the menu button
- In Page Designer, open your page and locate the Interactive Report region.
- Right-click the region and add a new Button. Set the Slot to Right of Interactive Report Search Bar so it appears inline with the search controls.
- Give it a meaningful label , for example Custom Actions. Set the Button Template to Text with Icon and add an icon like
fa-angle-downfor a clean dropdown feel. - Under Behavior, set the button Type to
Menu. This is what turns the button into a dropdown container for your menu entries.
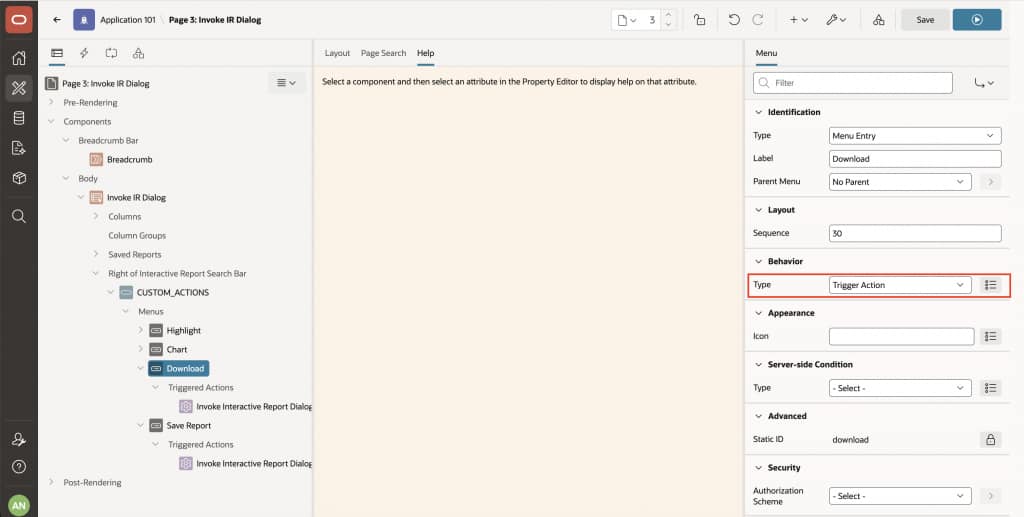
Step 2 : Add menu entries
- Under the button, add Menu Entries for each IR dialog you want to expose — for example: Highlight, Chart, Download, Save Report.
- For each menu entry, set the Label (e.g.
Download) and under Behavior, set the Type toTrigger Action. Trigger Action is a new capability in APEX 26.1 that allows buttons, menu entries, and template component actions to have Dynamic Action steps defined directly beneath them in the Page Designer tree – we have covered it in depth in a separate post.
Trigger Action is a new Behavior Type in APEX 26.1 that lets you define Dynamic Action steps directly beneath a button, menu entry, or template component action in the Page Designer tree. We’ll be covering it in depth in a separate post.
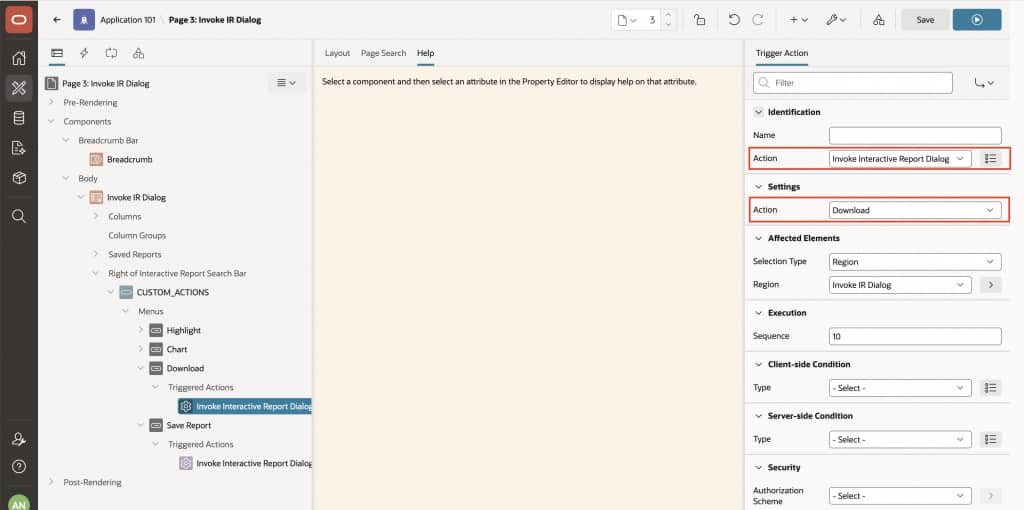
Step 3 : Wire up the Invoke IR Dialog action
- Under each menu entry, a Triggered Actions node appears. Add a Triggered Action and set the Action to Invoke Interactive Report Dialog.
- Under Settings, set the Action dropdown to the specific IR dialog this entry should open( for example,
Download). - Under Affected Elements, set Selection Type to
Regionand point Region to your Interactive Report region. - Repeat steps 5–9 for each dialog entry you want in the menu.
- Save and run. Your custom menu button appears on the IR search bar, and each entry opens its respective IR dialog directly, no Actions menu required.
You can add as many menu entries as you need – Highlight, Chart, Download, Save Report, and more. Each entry is independently wired to its own dialog, so you have full control over exactly which IR controls you surface and in what order.
A More Flexible Interactive Report
Oracle APEX 26.1 brings a broad set of improvements to one of the most used components in the platform. The rendering improvements are automatic and require nothing from you. The new developer features (row selection, CSS classes, the new row limit property, and the Dynamic Action) are ready to adopt at your own pace, and all work seamlessly with your existing applications.
We hope you enjoy building with them. As always, we’d love to hear what you create.