This blog was originally published on 28 December, 2017.
In the first blog posting about REST Services in Application Express 5.2 Early Adopter you learned, how an external REST Service is being registered as a Web Source Module in Shared Components and then being used as the data source for a Classic Report. In this posting, another REST Service is being registered, we’ll add another report to the application page and finally link both reports.
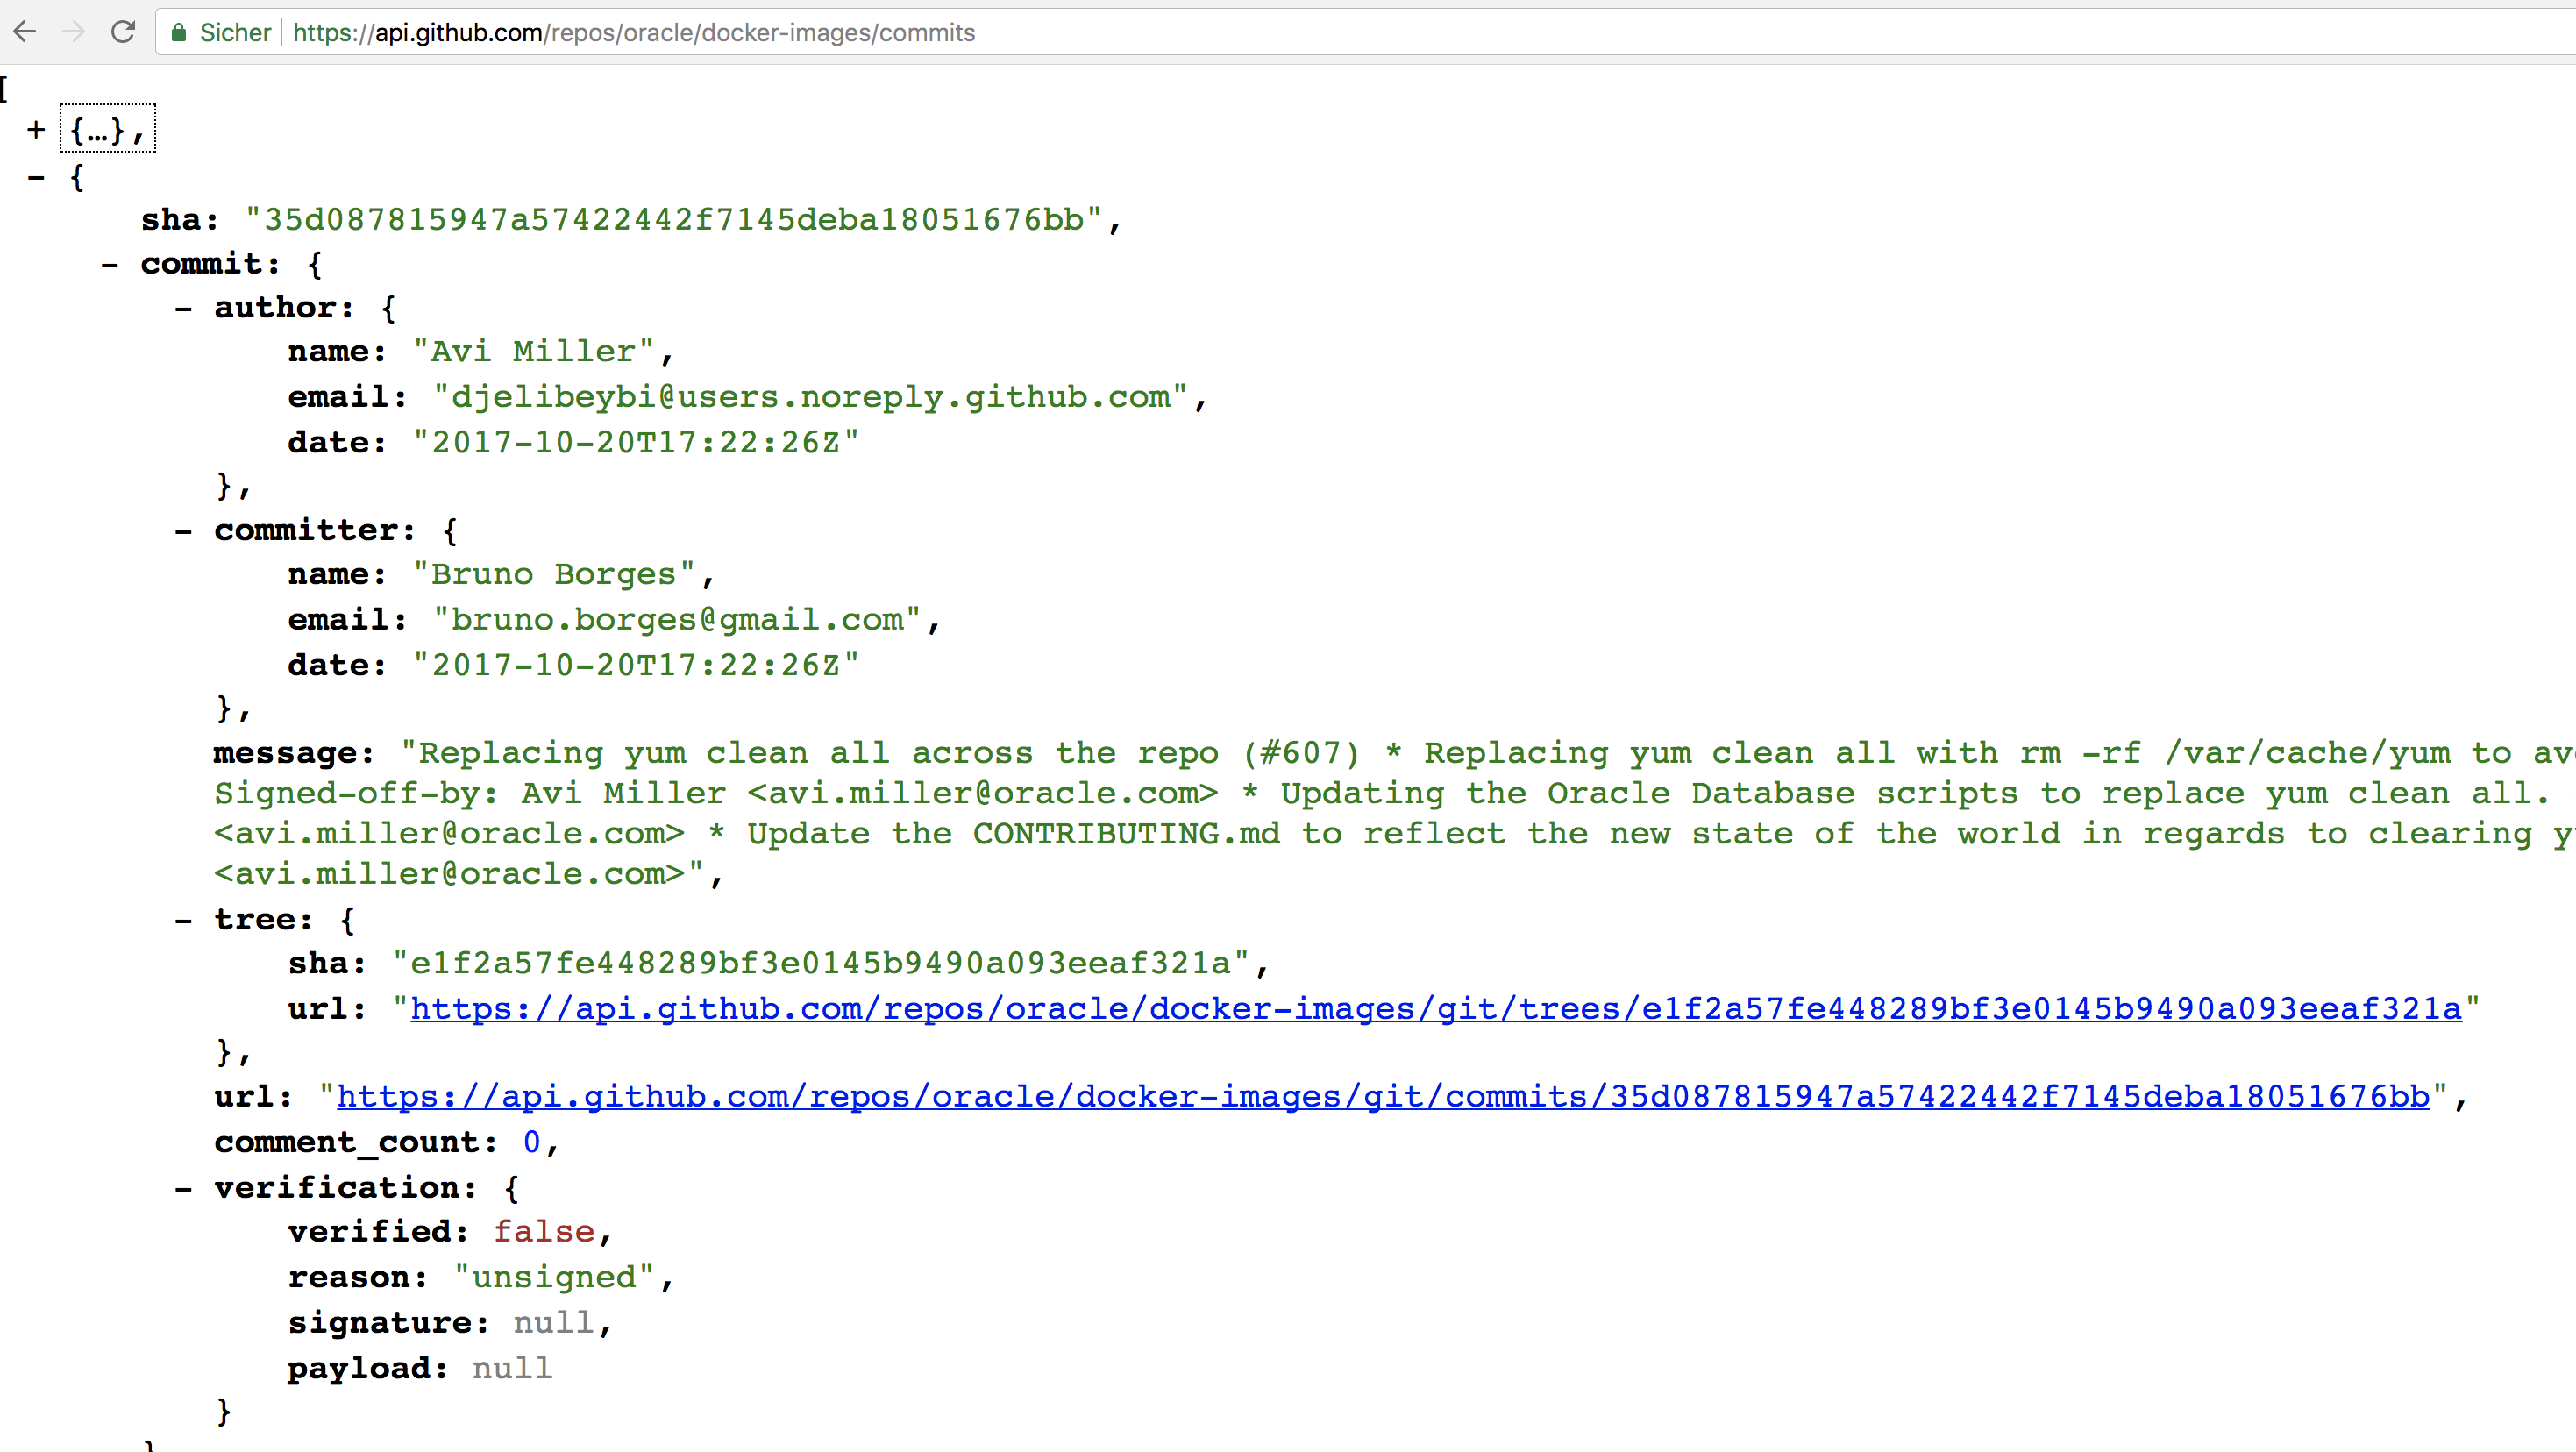
The second REST Service will also be an Github API endpoint: https://api.github.com/repos/oracle/docker-images/commits lists the commits which have been done to the specified repository.
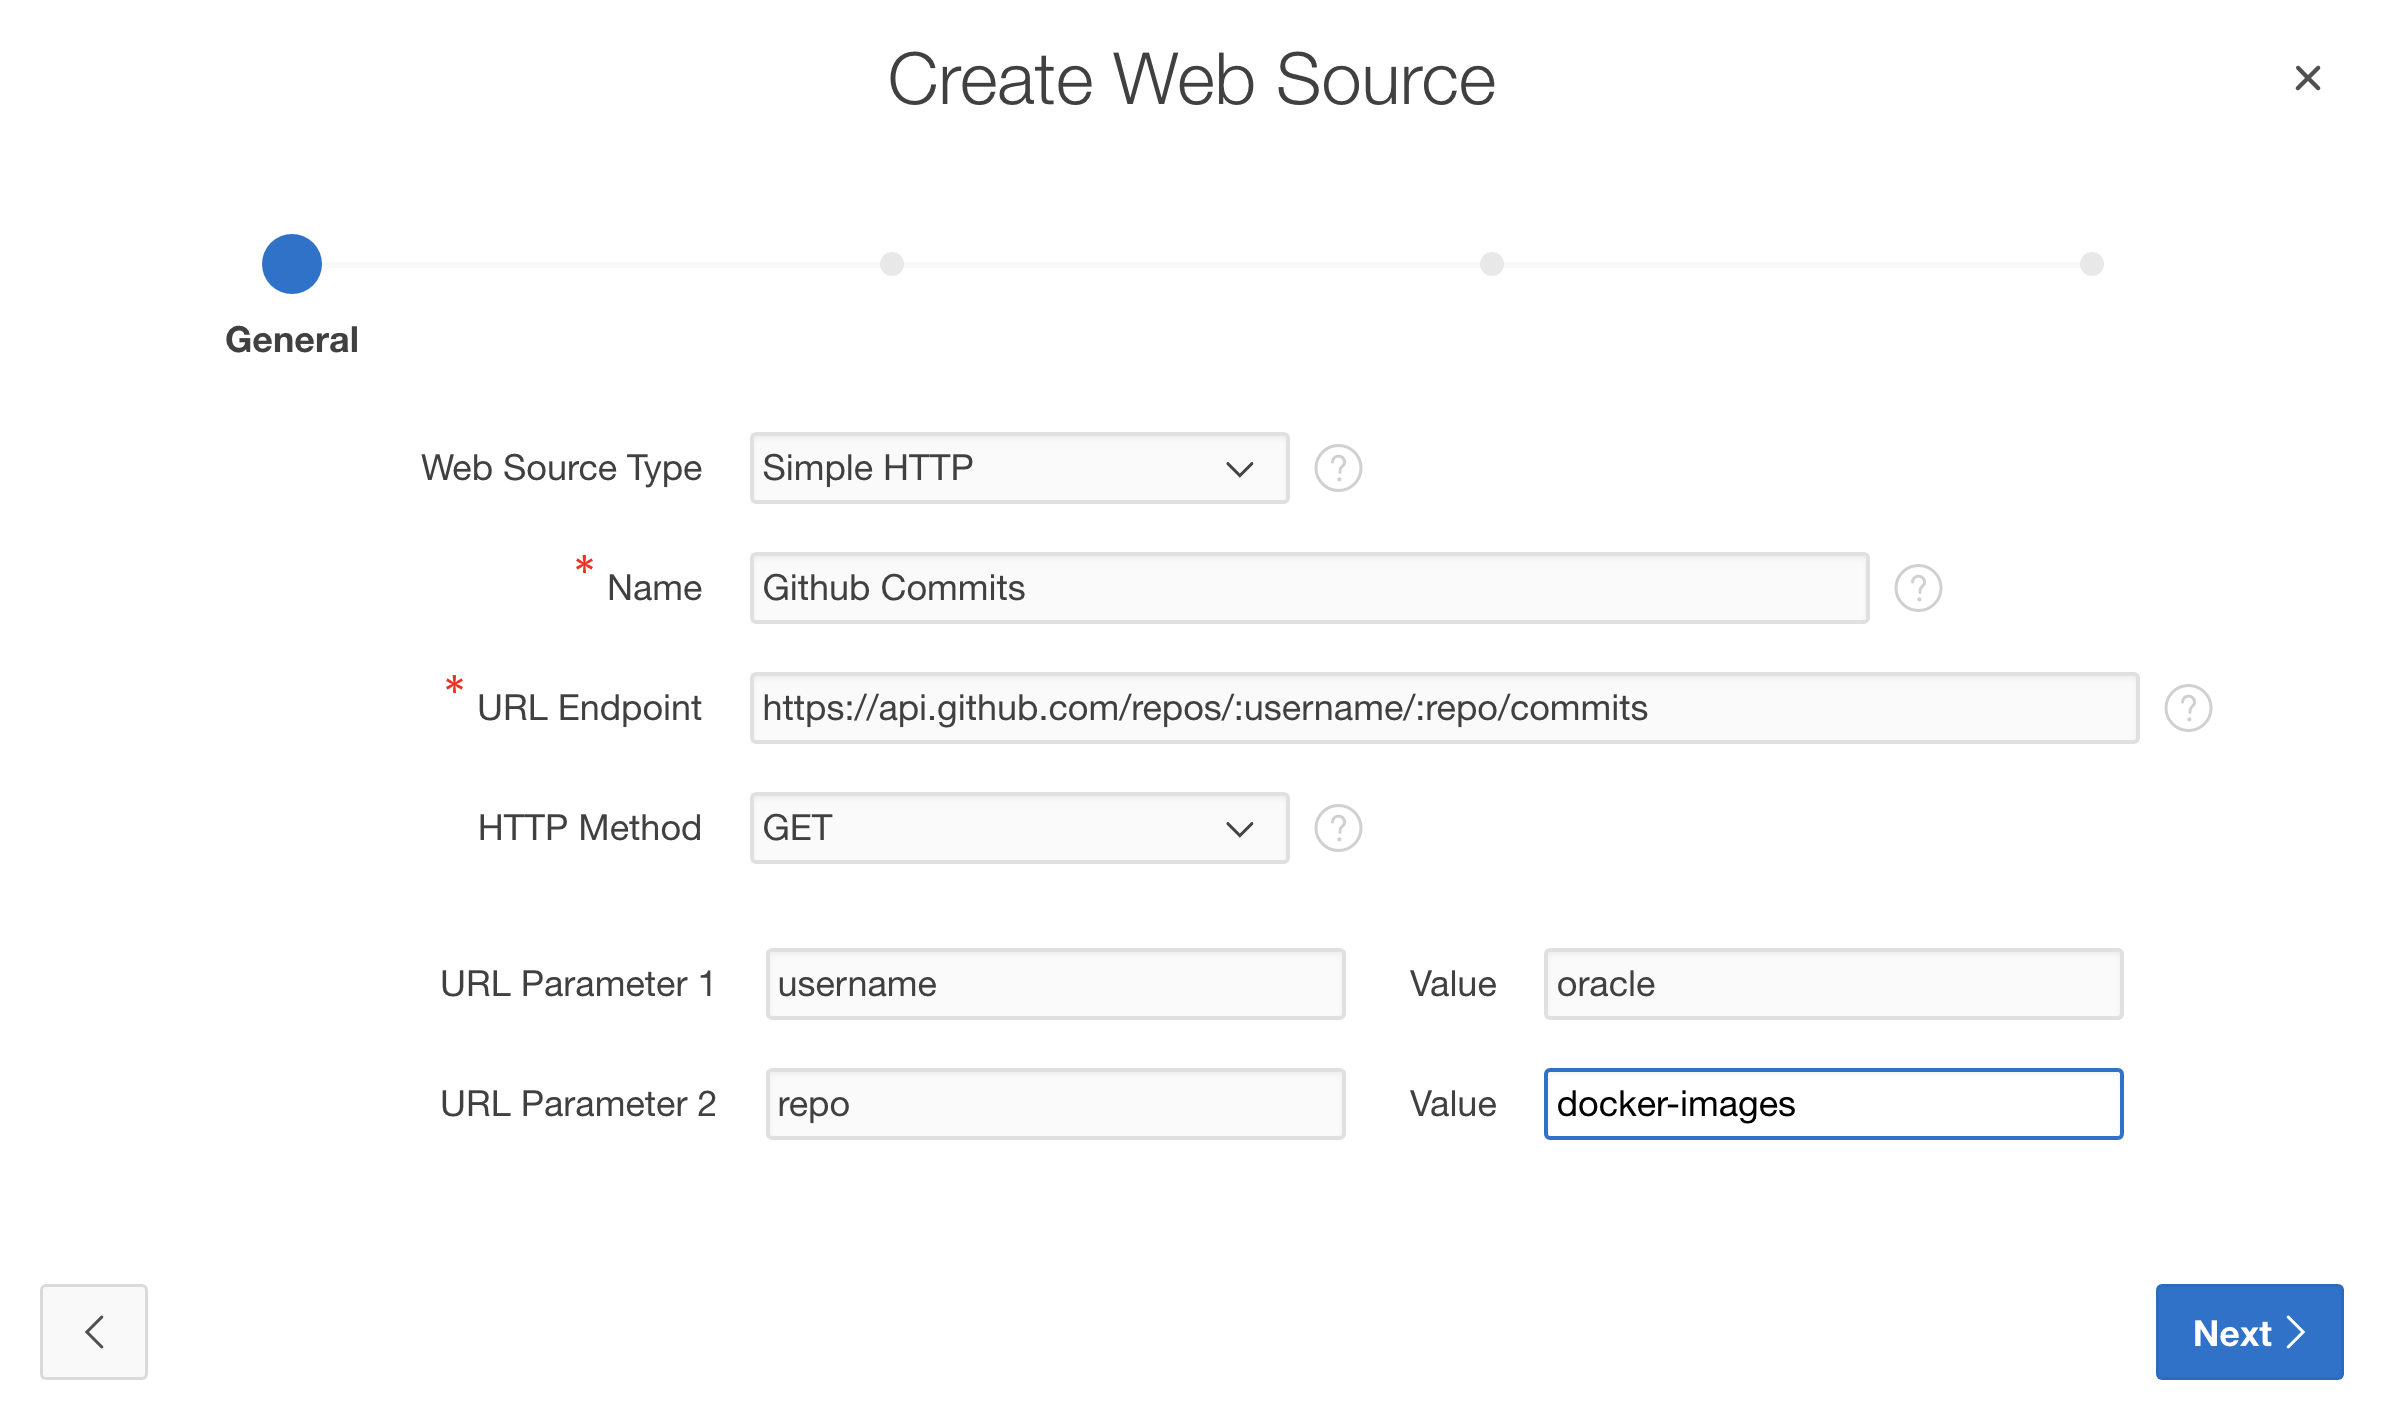
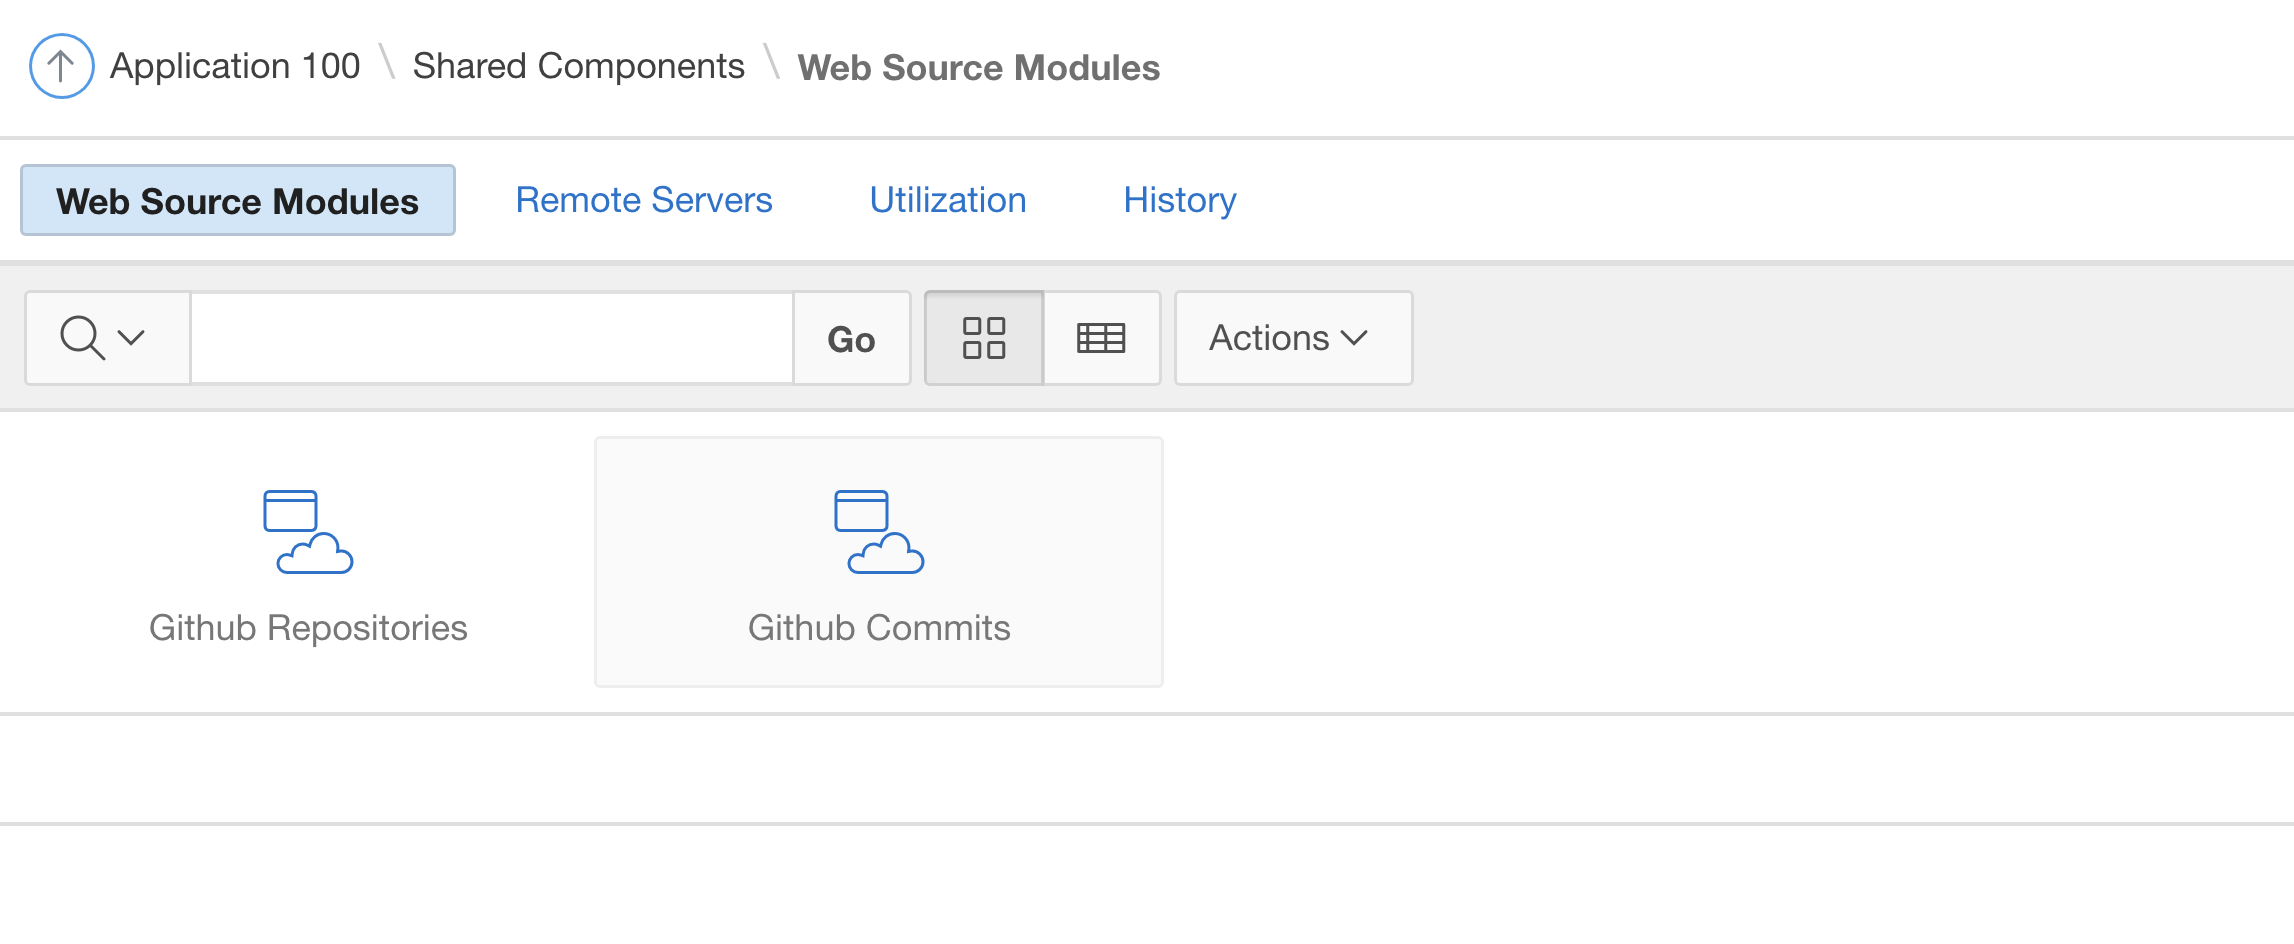
Thus, navigate to the Shared Components of your application which has been created in the first blog posting. In Web Sources Modules, click on the Create button and choose Create from Scratch” – just as done in the first posting. Keep Simple HTTP as the type and GET as the HTTP method and provide a name (“Github Commits“). For the endpoint URL, we’ll use Web Source Parameters right from the beginning this time. Use https://api.github.com/repos/:username/:repo/commits – Application Express will detect the URL Parameters and prompt for default values to be used during Web Servicer discovery. Choose oracle for the :username and docker-images for the :repo parameter. When finished, click Next.
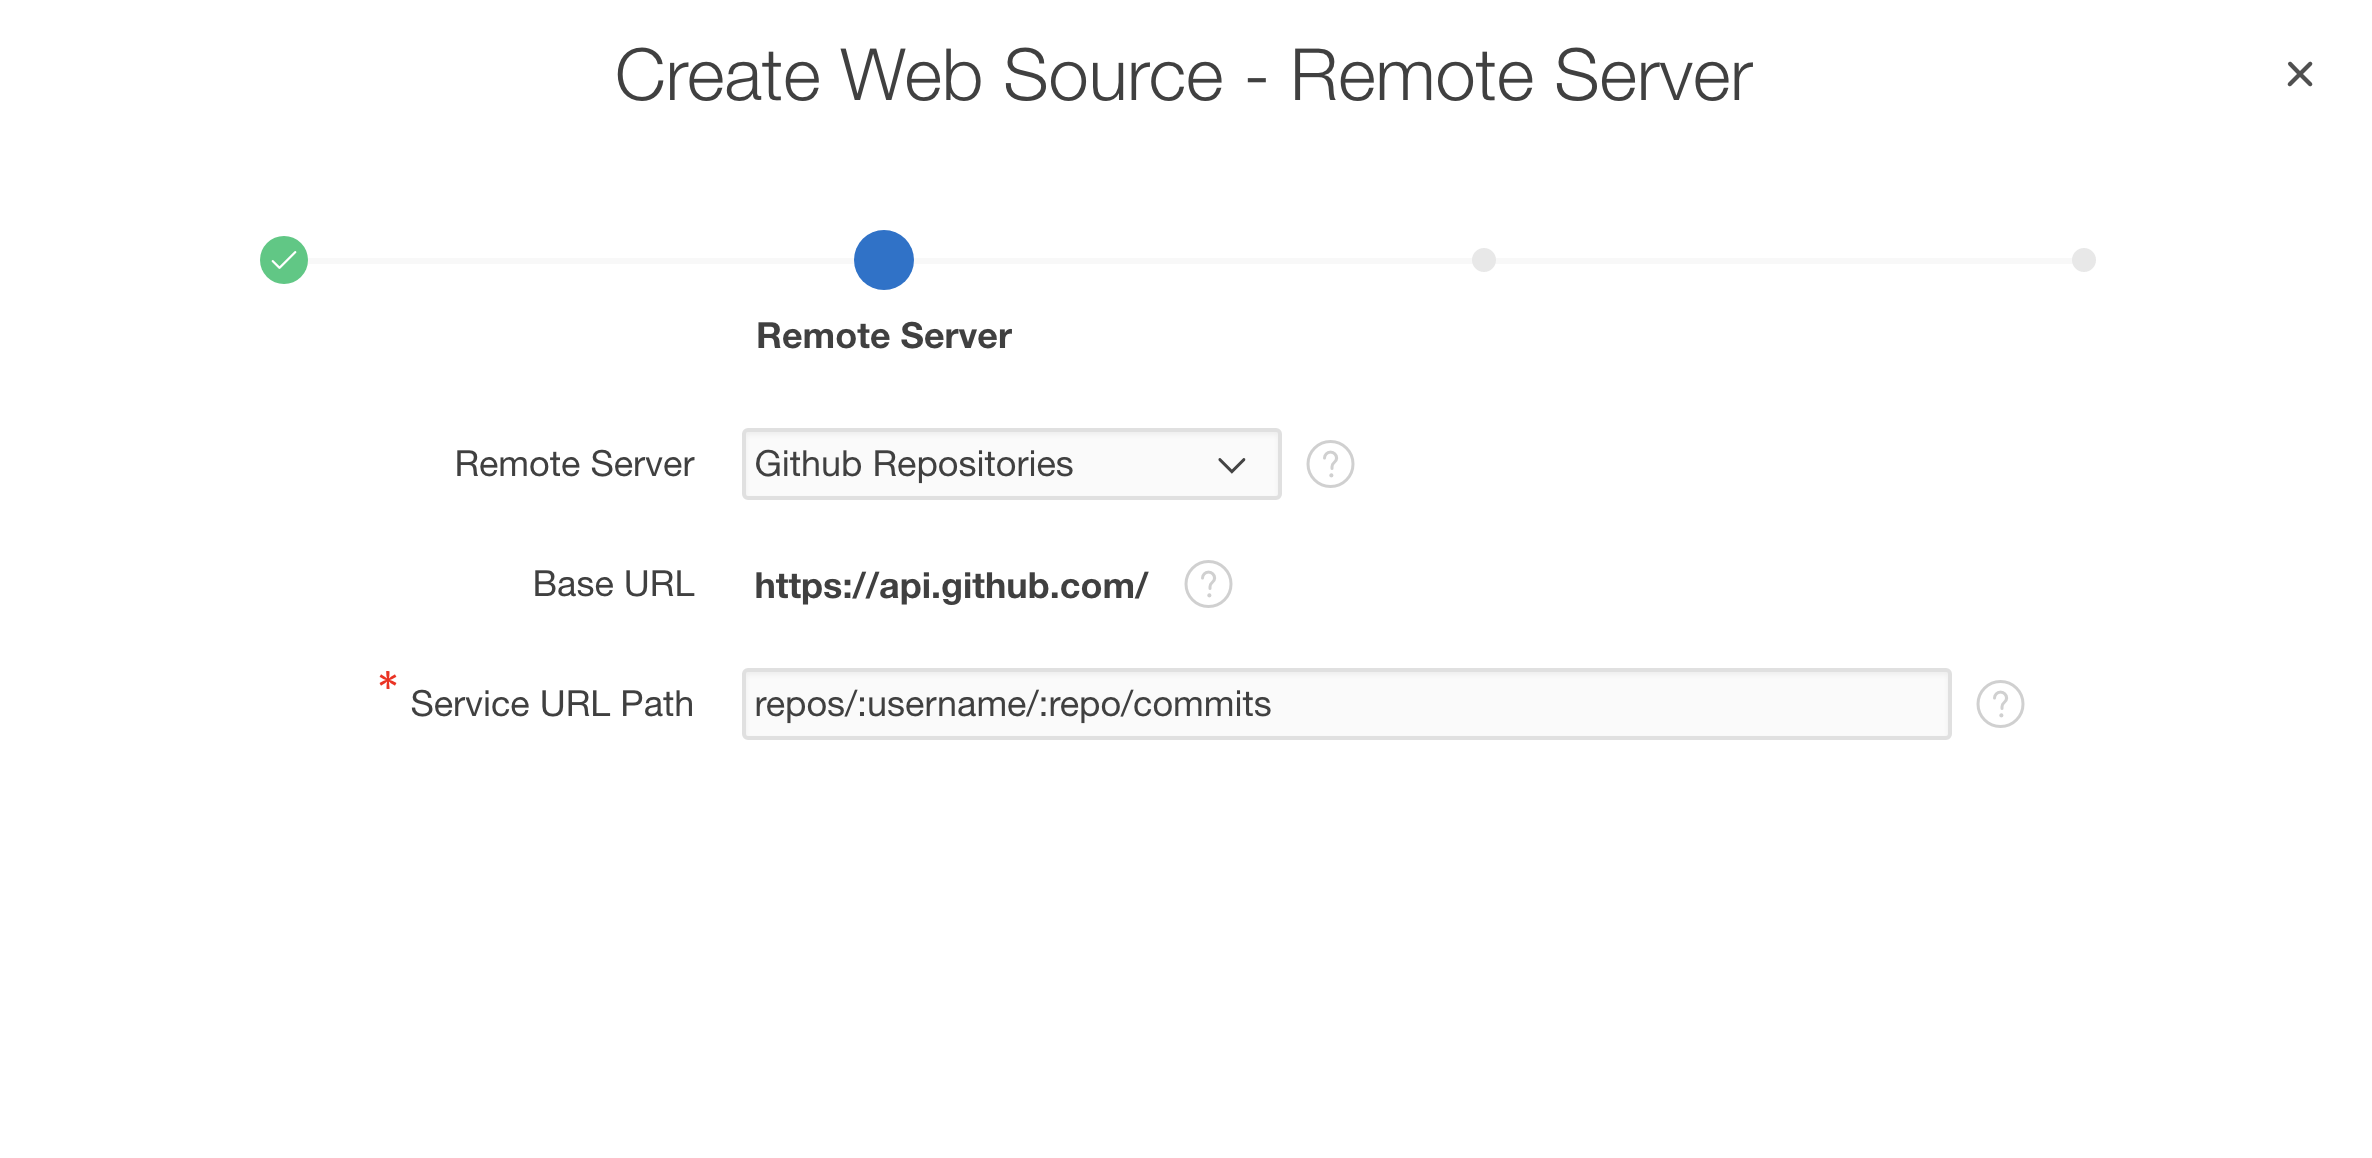
Application Express checks whether an existing Remote Server object matches the given endpoint URL. Since as already have a remote server object for Github URL endpoints, we’ll reuse that here. Click Next to get to the Authentication dialog.
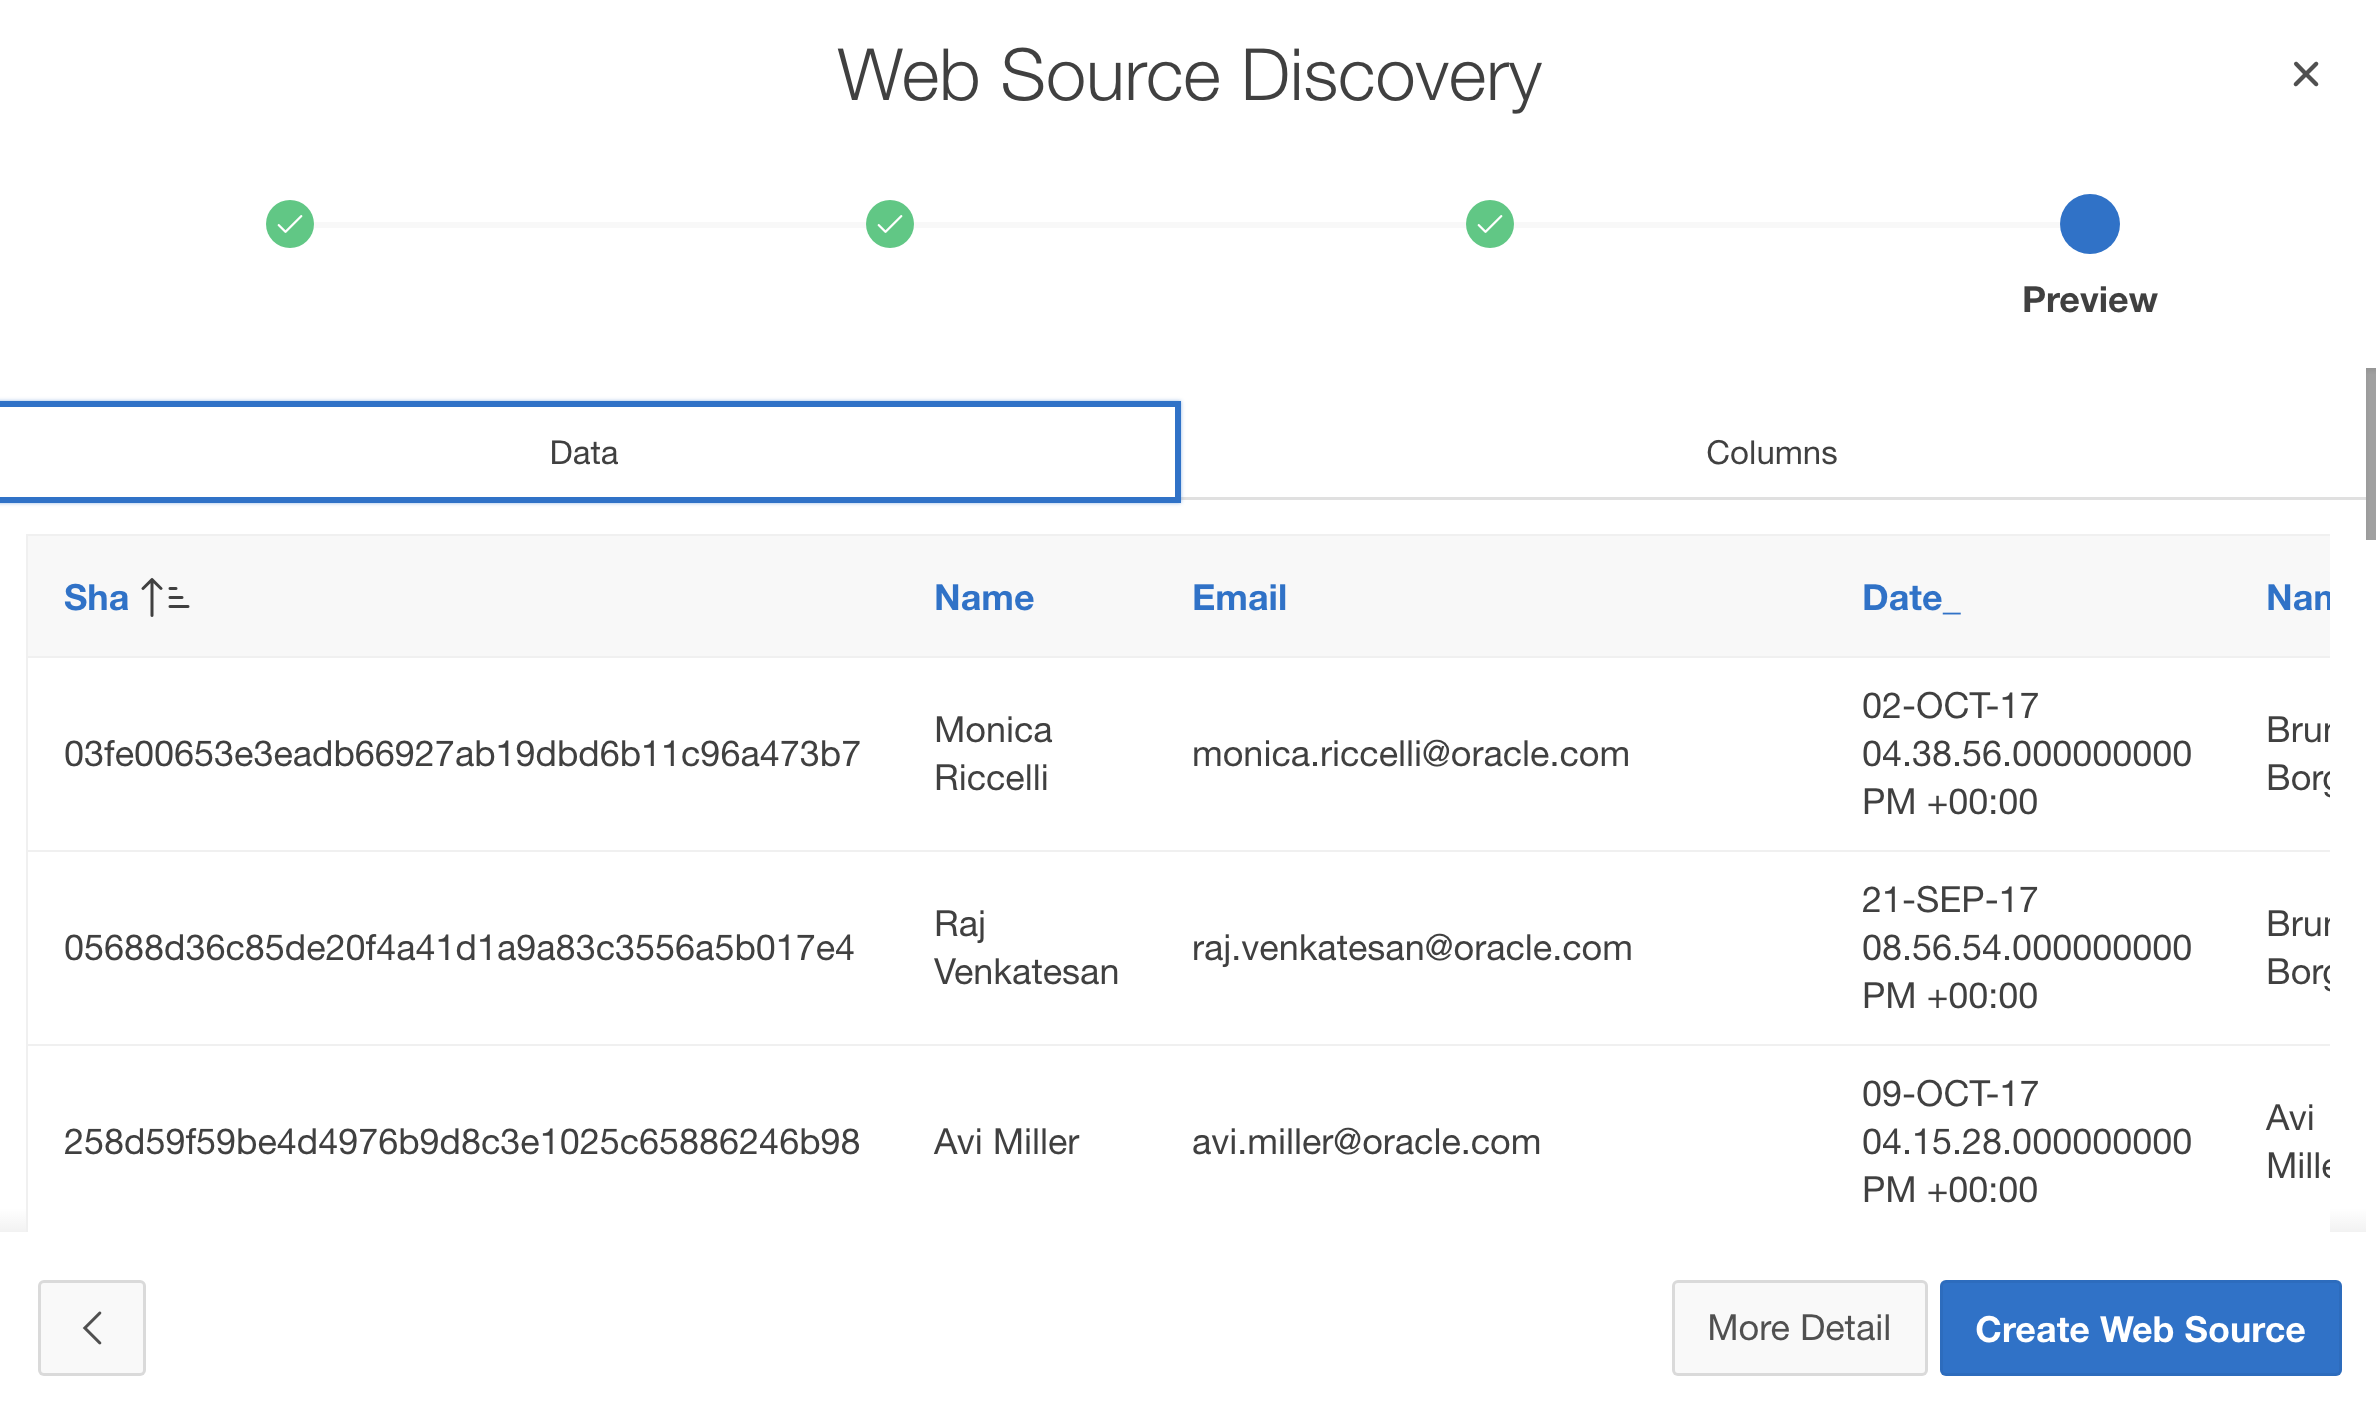
As the repository list, the commits list also does not require Authentication. So you might click the Discover button to start web source discovery. Application Express will invoke the URL endpoint, grab the JSON response and examine it to determine columns and data types. Once you see the list of columns and the sampled data, click the Create Web Source button.
Once the Web Source has been created, click the icon in order to review its details.
On the details page, open the Data Profile tab.
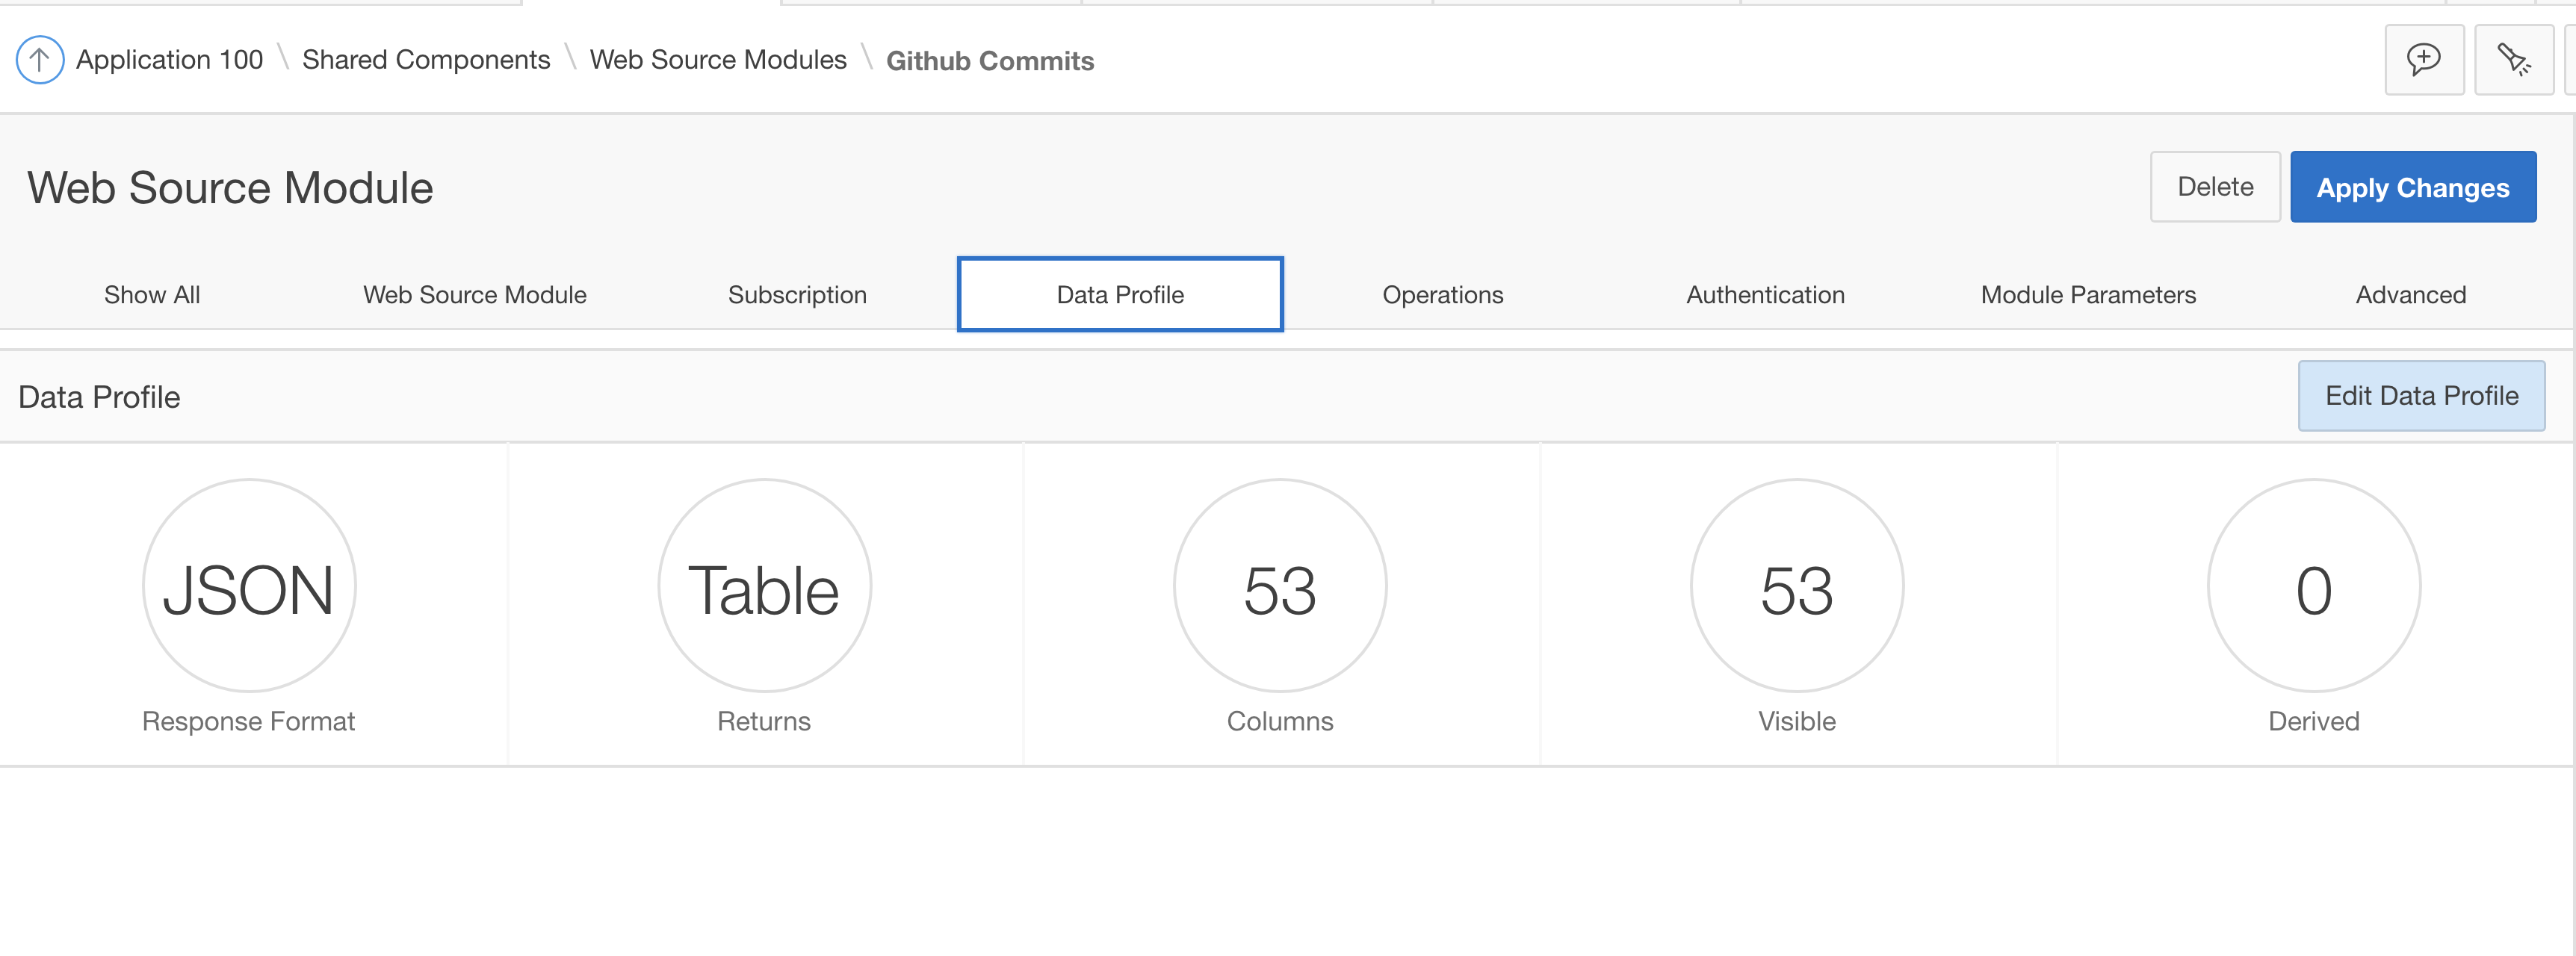
The JSON response contains about 50 attributes – most of them will never be needed in the APEX application. So we might want to adjust the attributes, column names and their visibility. Click on the Edit Data Profile button to see all details on about how Application Express parses the JSON response and extracts rows and columns.
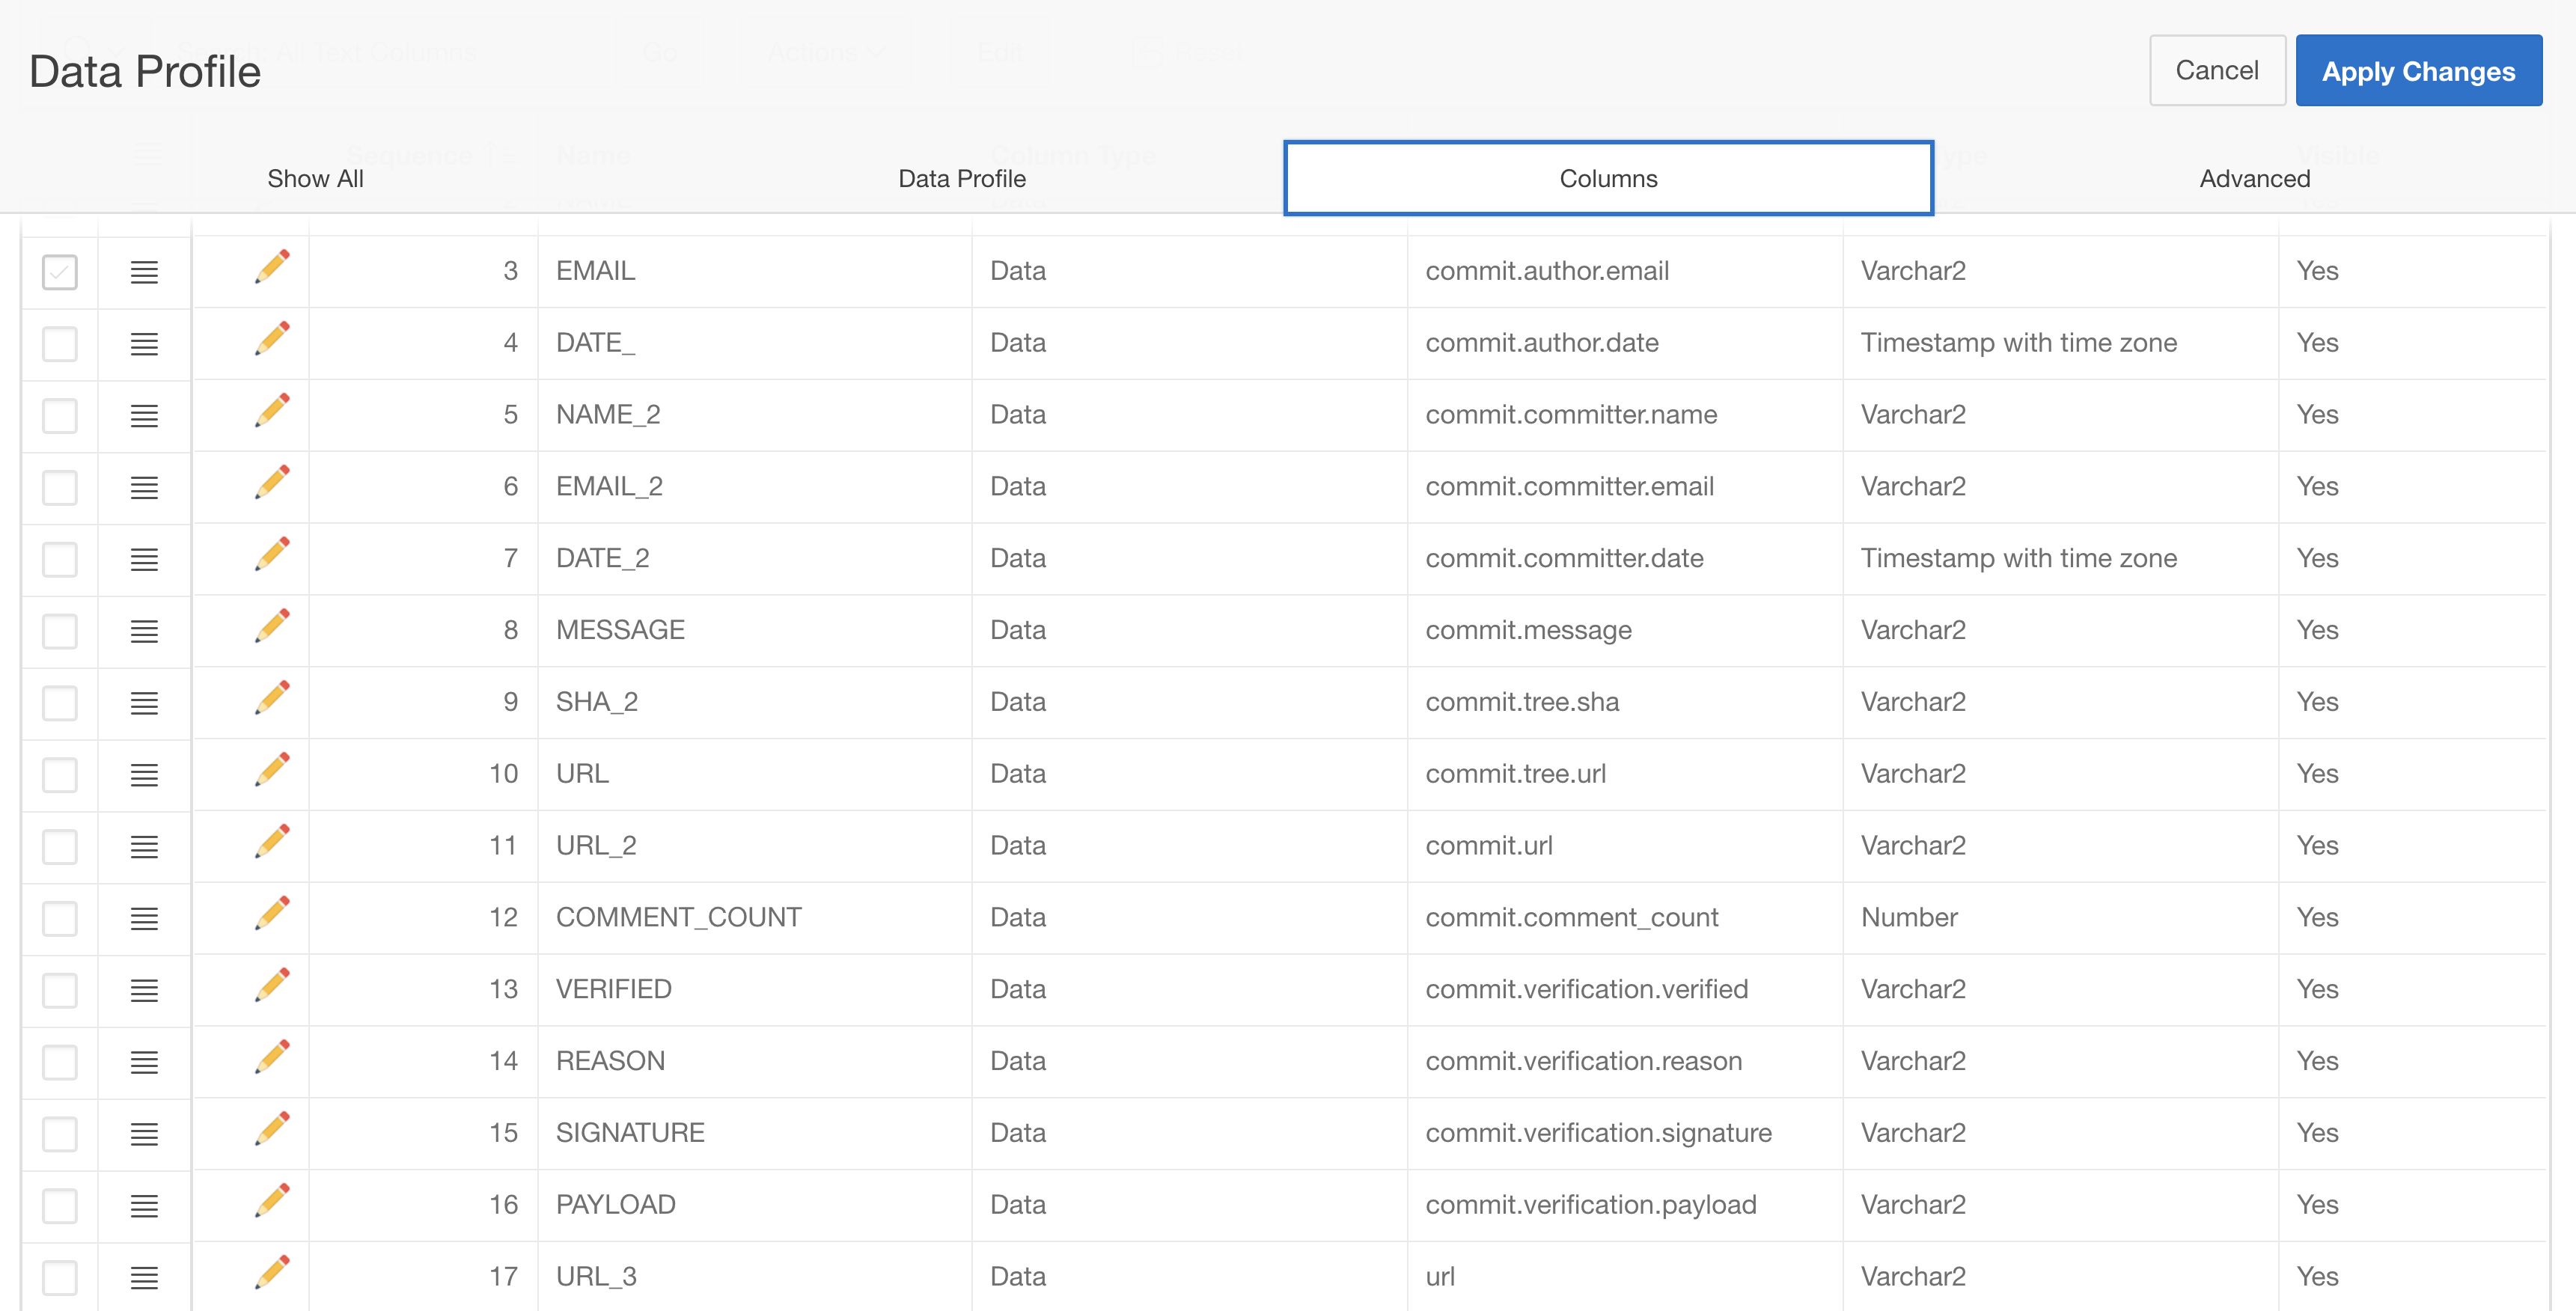
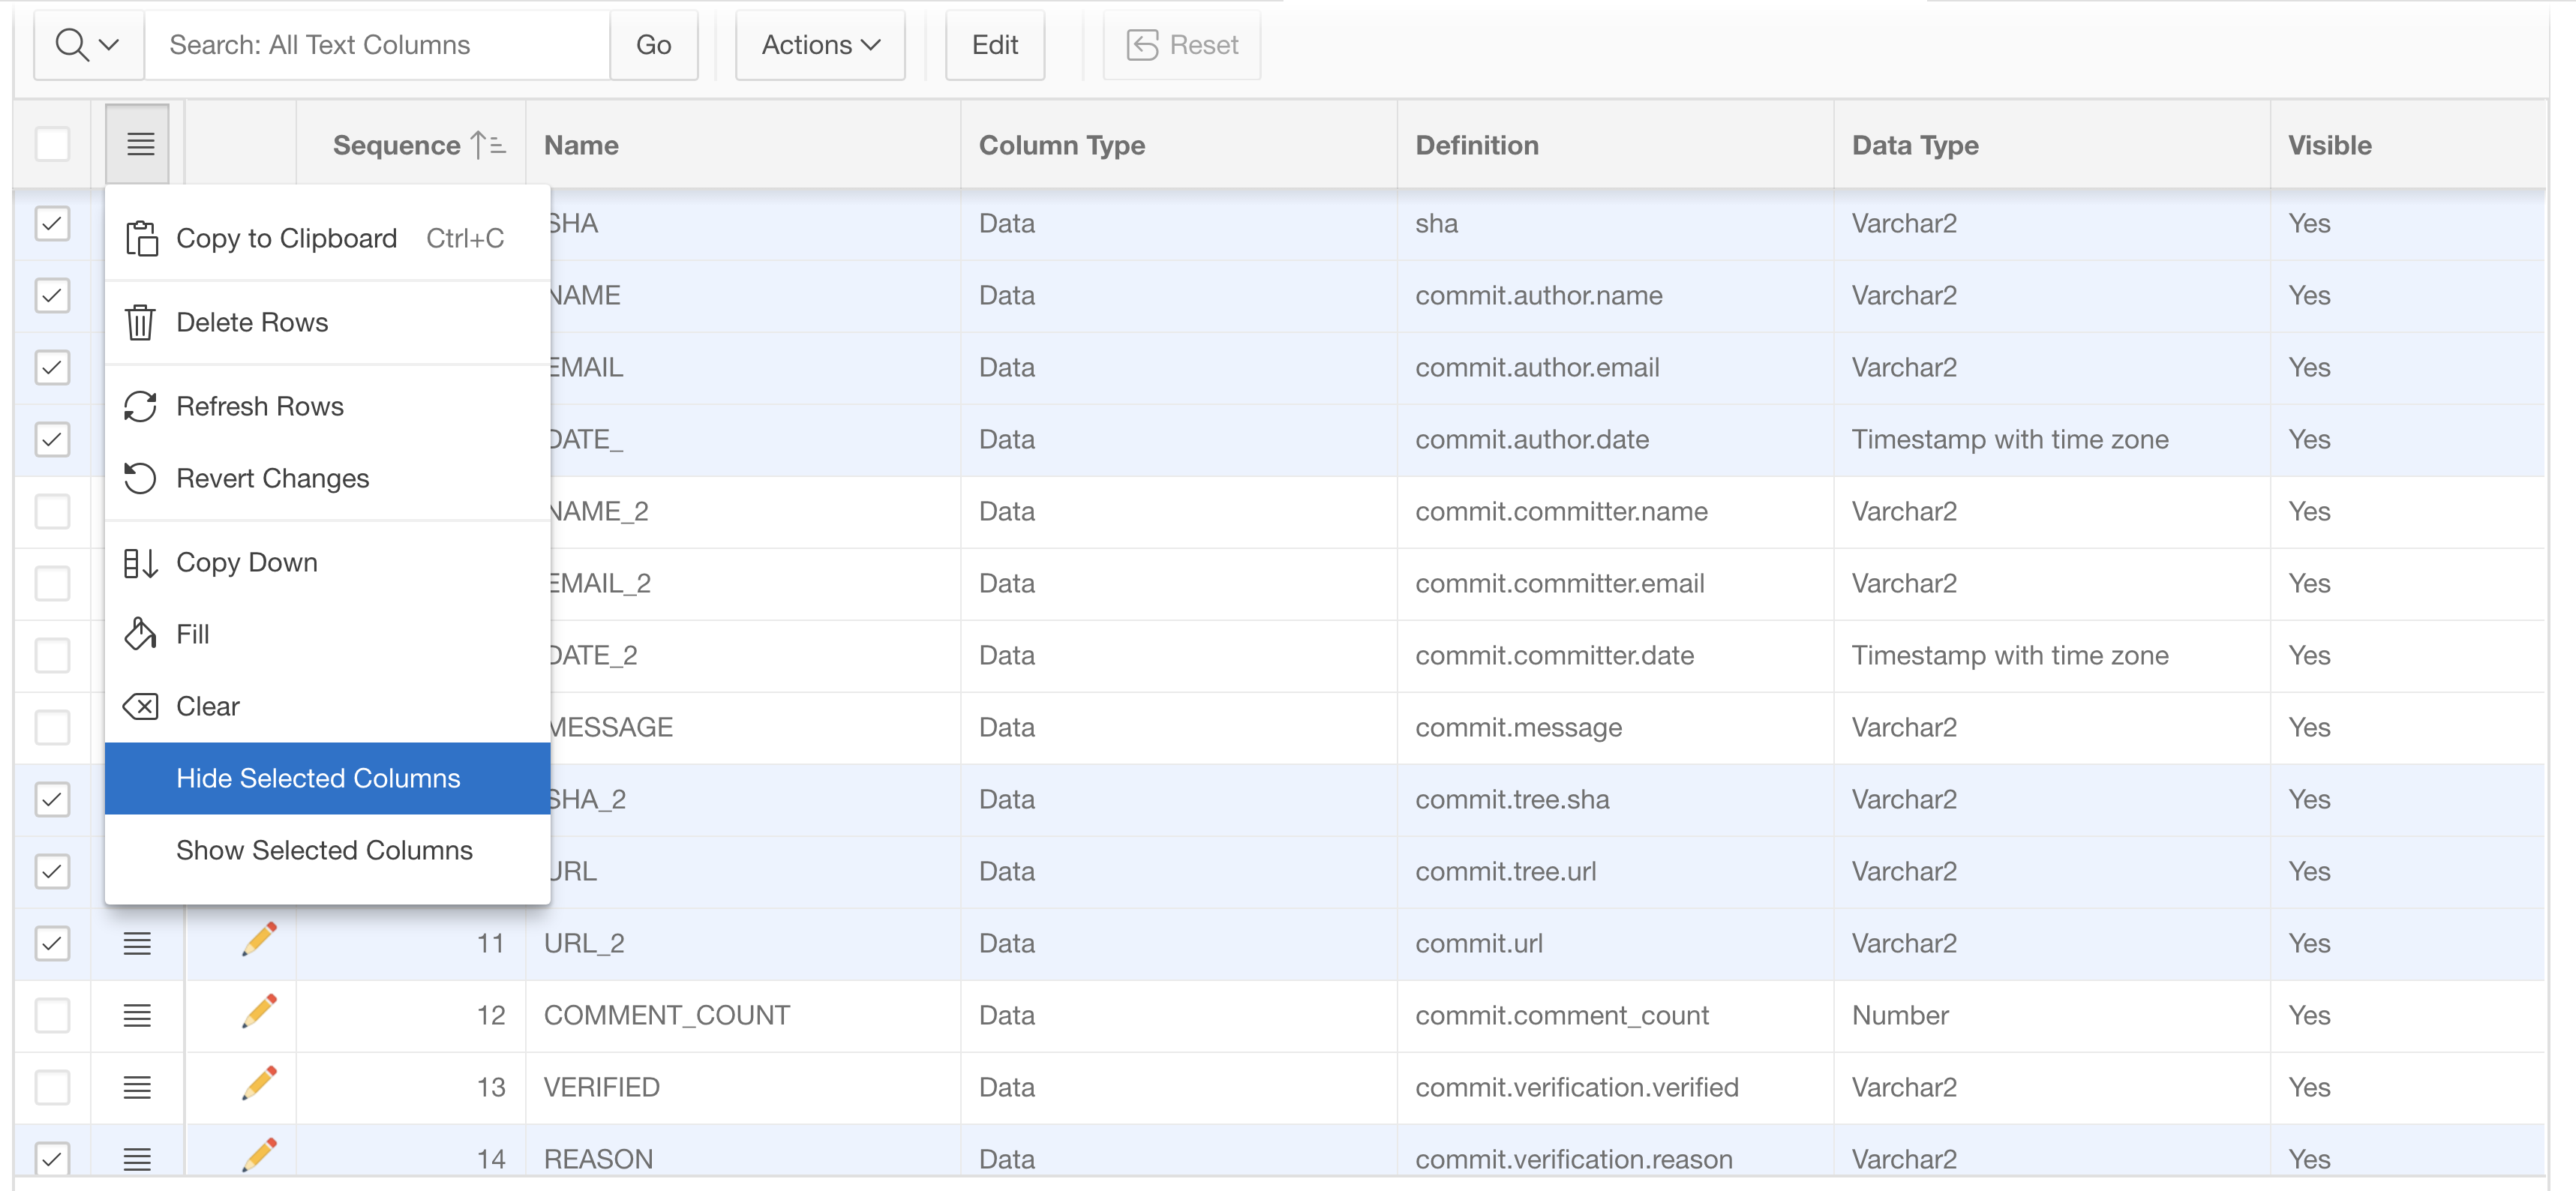
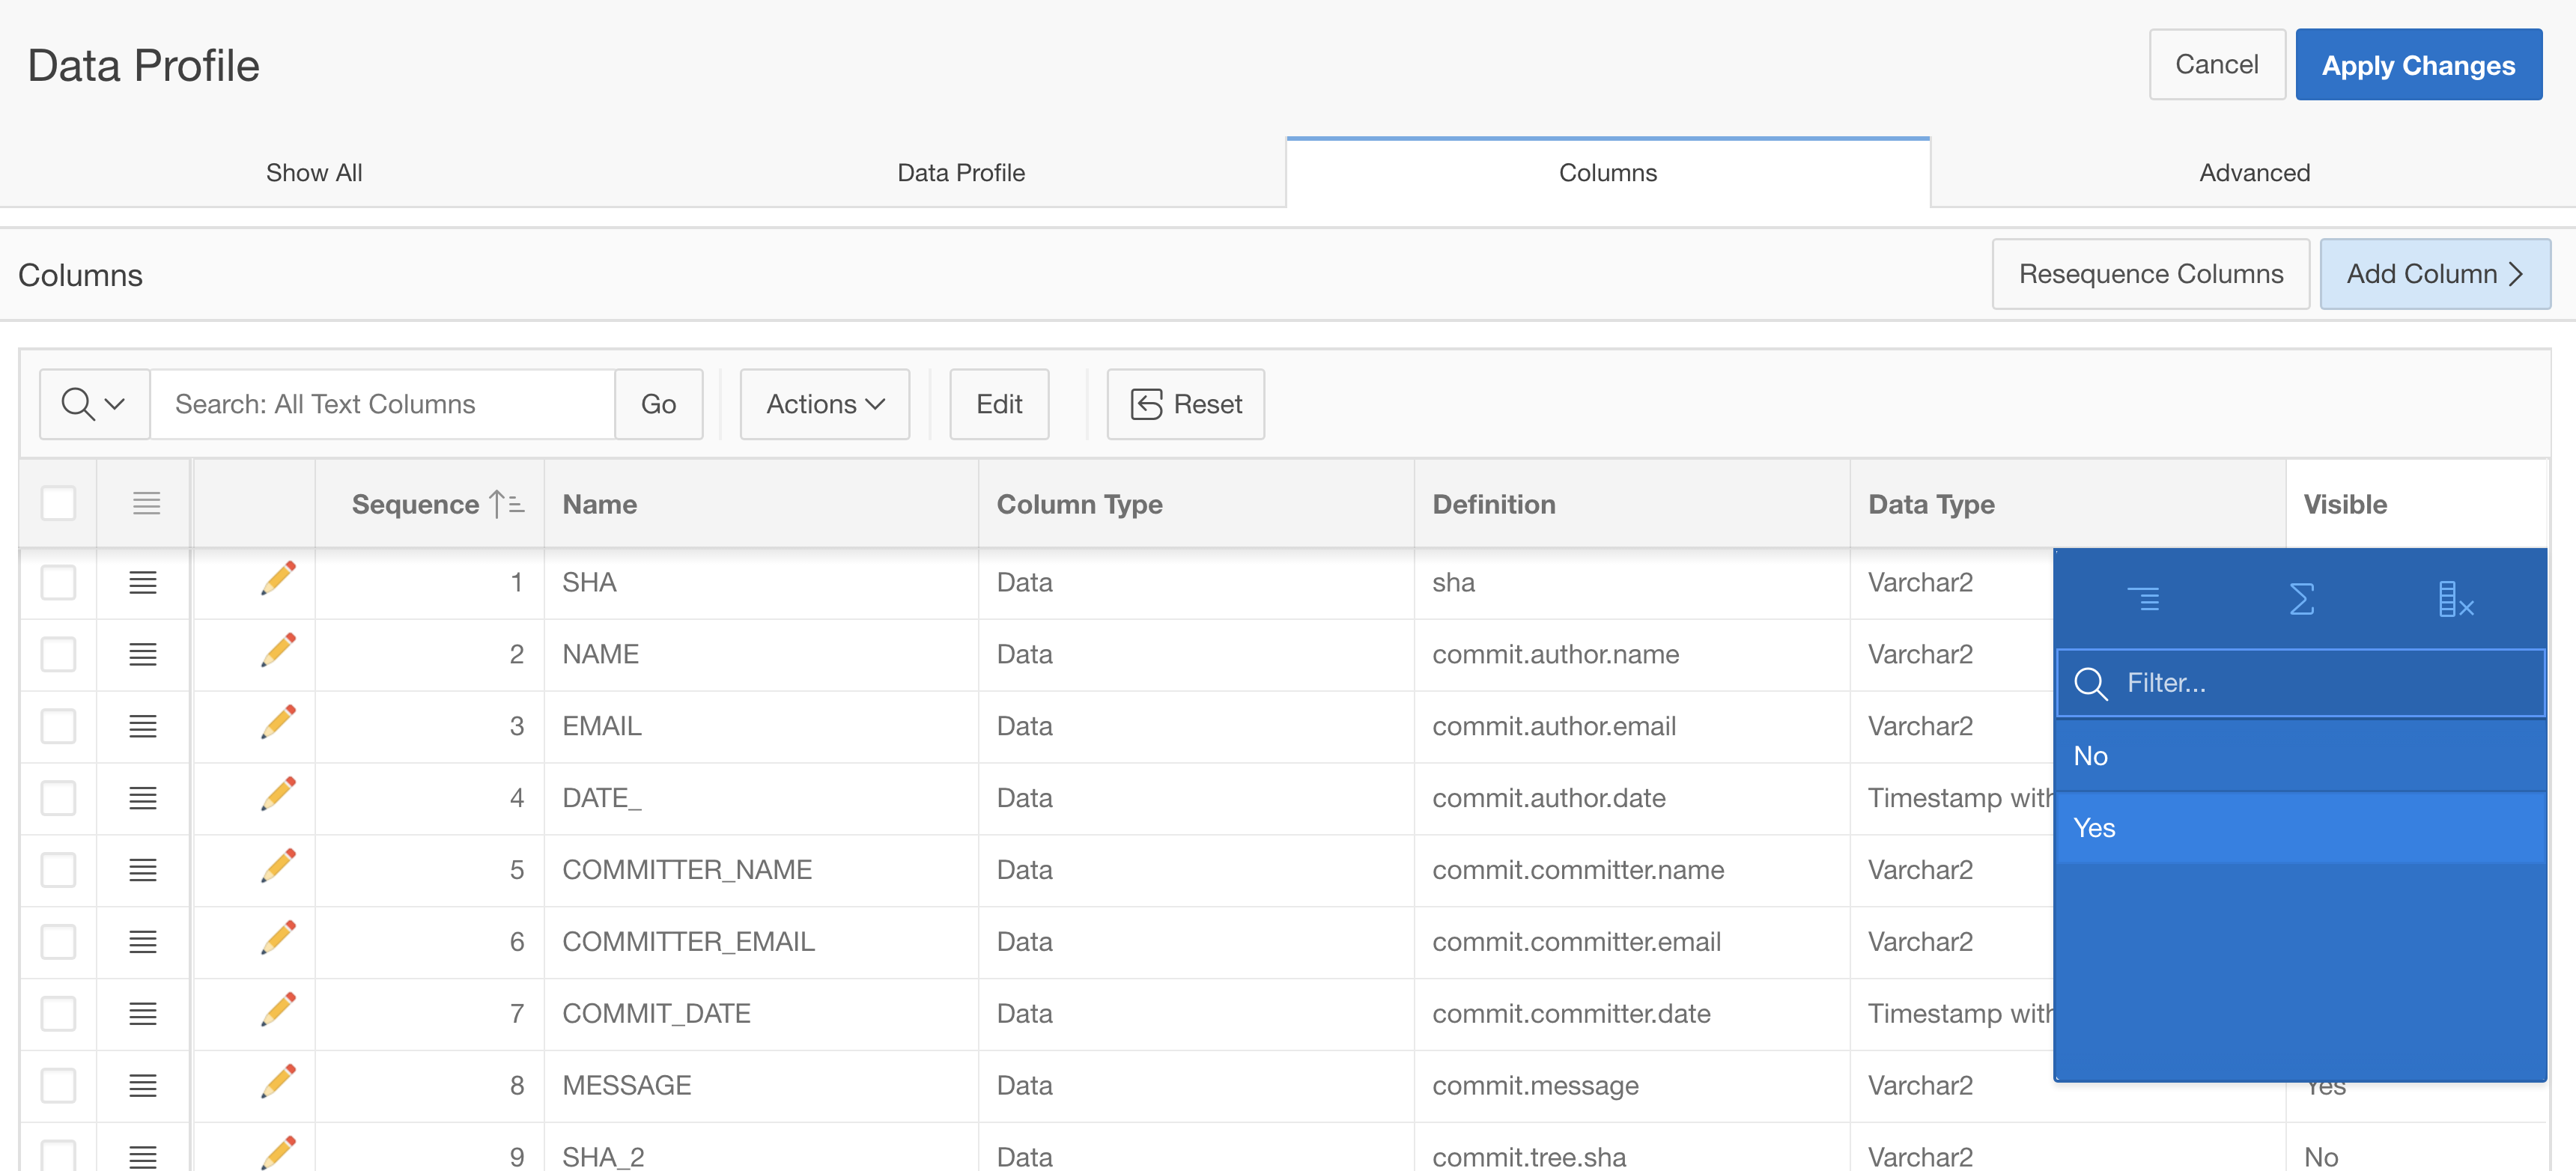
The Columns tab within the Data Profile section lists all columns extracted from the JSON response. The report shows the column name, its data type and the JSON path expression (tells APEX where the value for that column is being found in the JSON response). This column list can be changed: Columns might be removed or even added in cases where Application Express did not detect them properly.
First, we will not need all the 53 columns in the APEX applications – we also do not want to remove them (we might need them later on). So Application Express allows to hide the columns: Hidden columns will not be offered in the Create Page Wizards and not automatically added by Page Designer. However, when a component uses a hidden column, it still works. Thus we want to hide most of the columns, except NAME_2, EMAIL_2, LOGIN_2, AVATAR_URL_2, DATE_2 (we’ll change these names as well), MESSAGE, COMMENT_COUNT and VERIFIED. Check the columns to be hidden on the very left side of the grid, open the context menu in the heading section (as illustrated below) and click Hide Selected Columns.
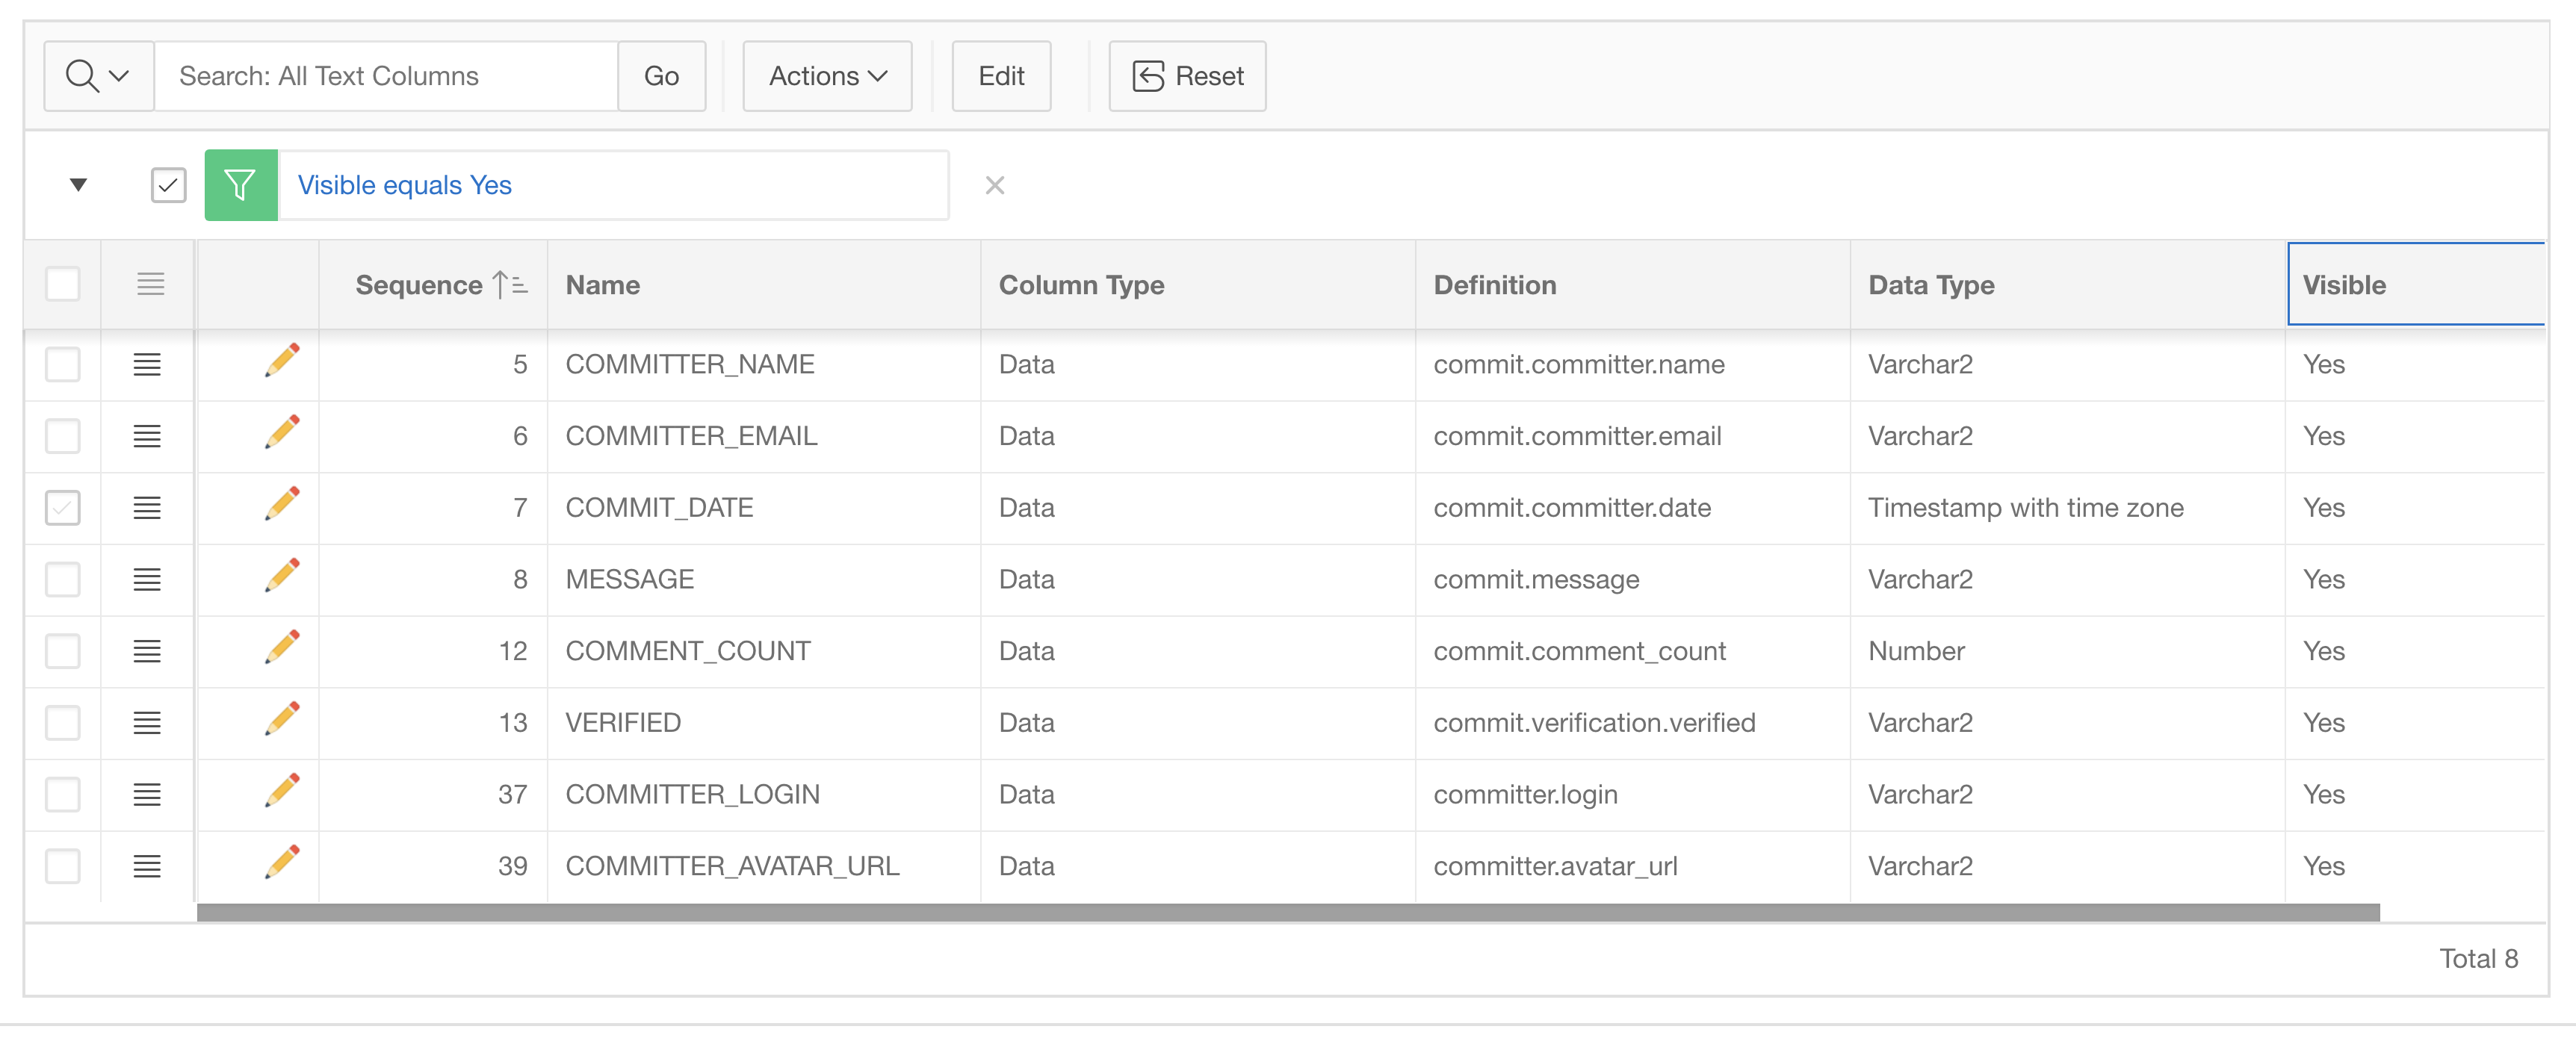
The Visible column of the selected rows will change to No. Then click Apply Changes to make this persistent. Revisit the Columns tab and choose to only display the visible columns – as follows:
Then change the column names (can be done in the grid directly) as follows:
- NAME_2 to COMMITTER_NAME
- EMAIL_2 to COMMITTER_EMAIL
- DATE_2 to COMMIT_DATE
- LOGIN_2 to COMMITTER_LOGIN
- AVATAR_URL_2 to COMMITTER_AVATAR_URL
The list of visible columns should then look as follows:
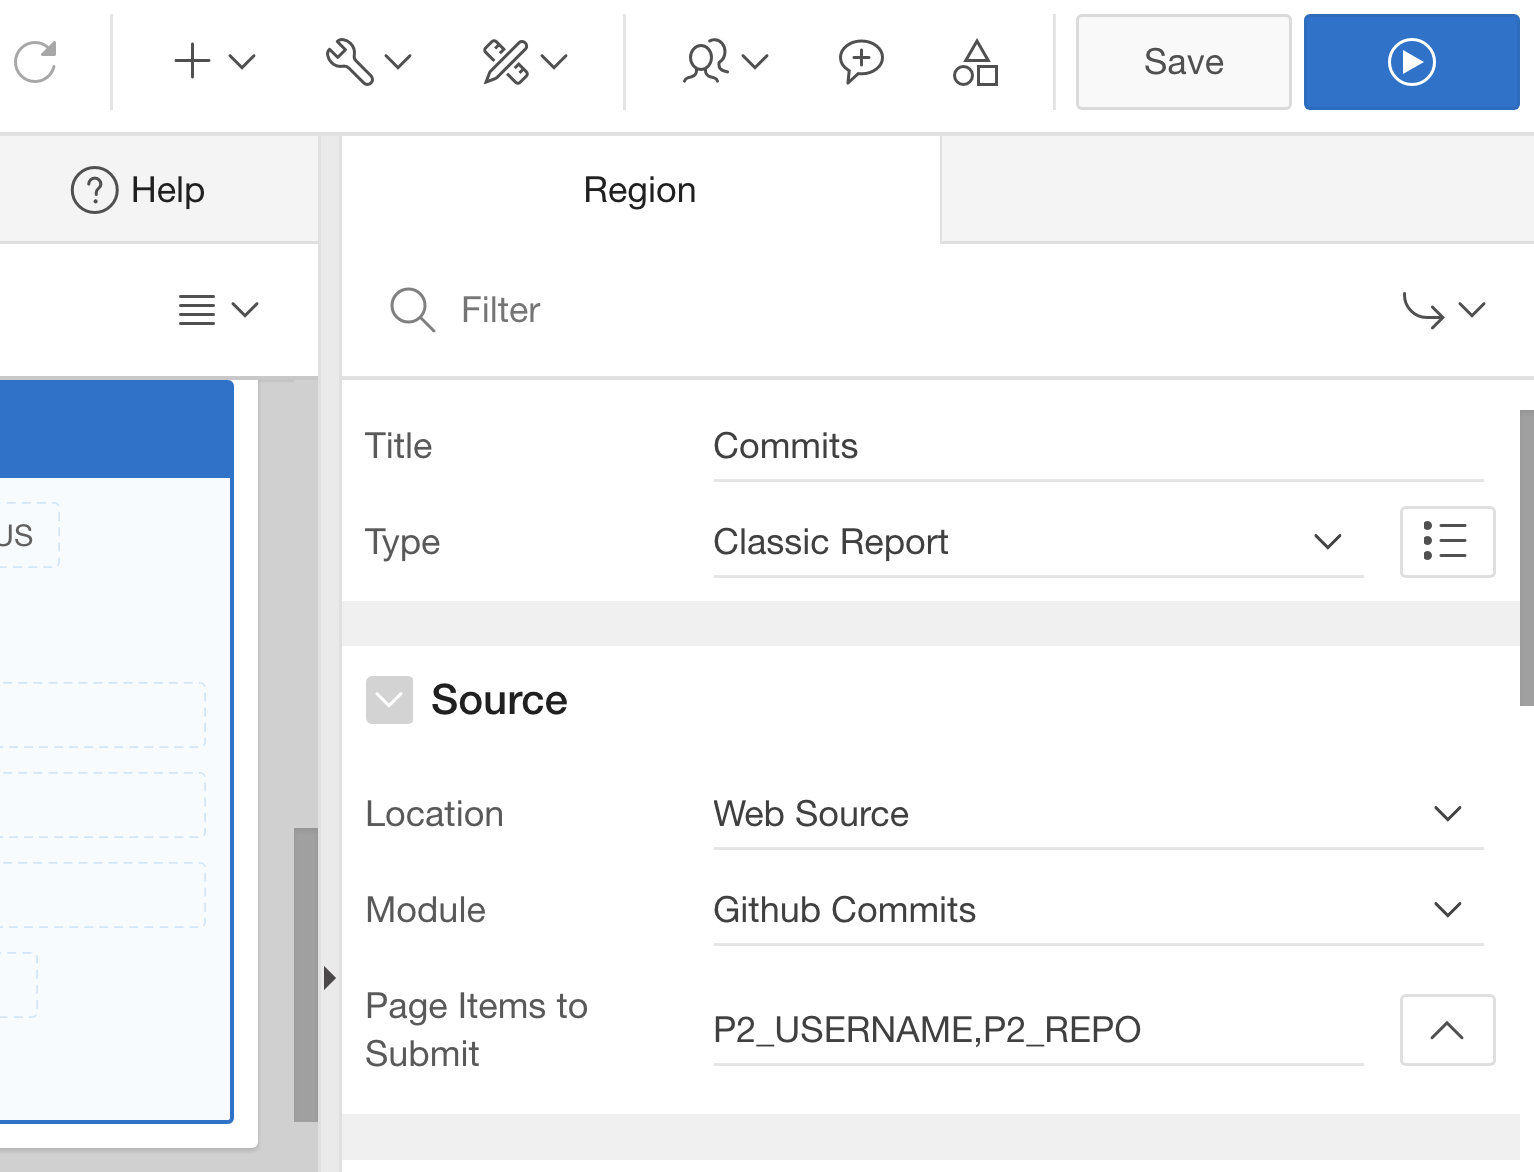
Finally save everything and navigate to the application page containing the Classic Report on Github Repositories from the first blog posting. Drag another classic report next to the existing one. That report will show the list of commits to a chosen repository.
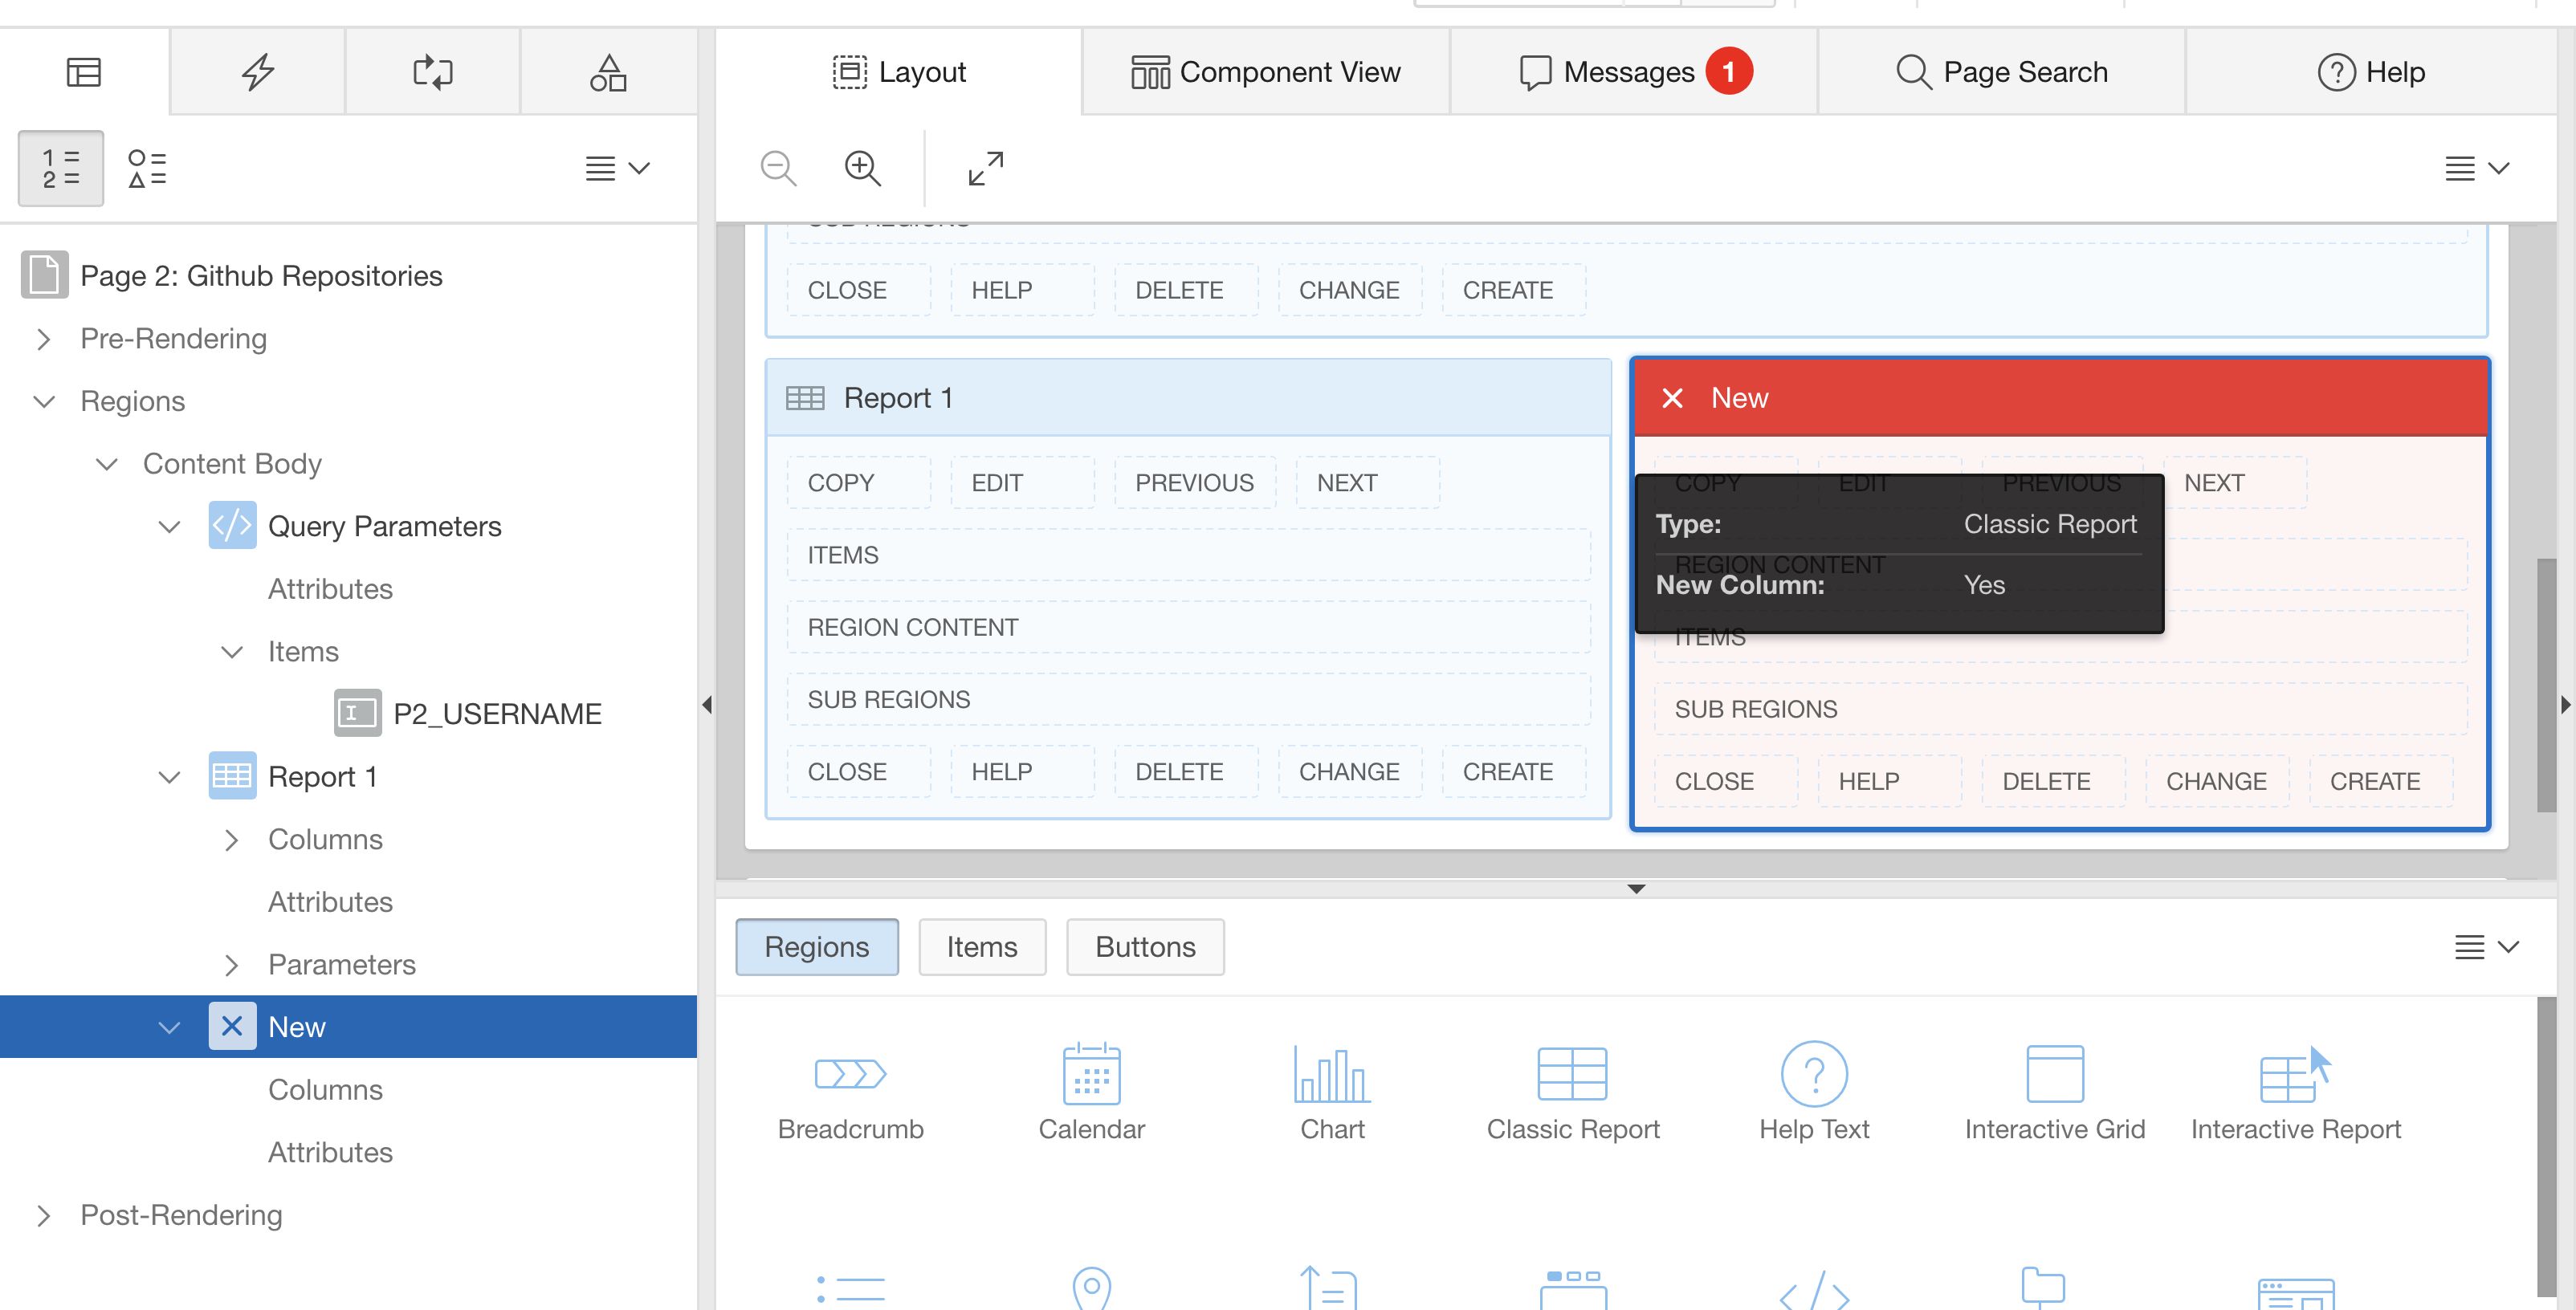
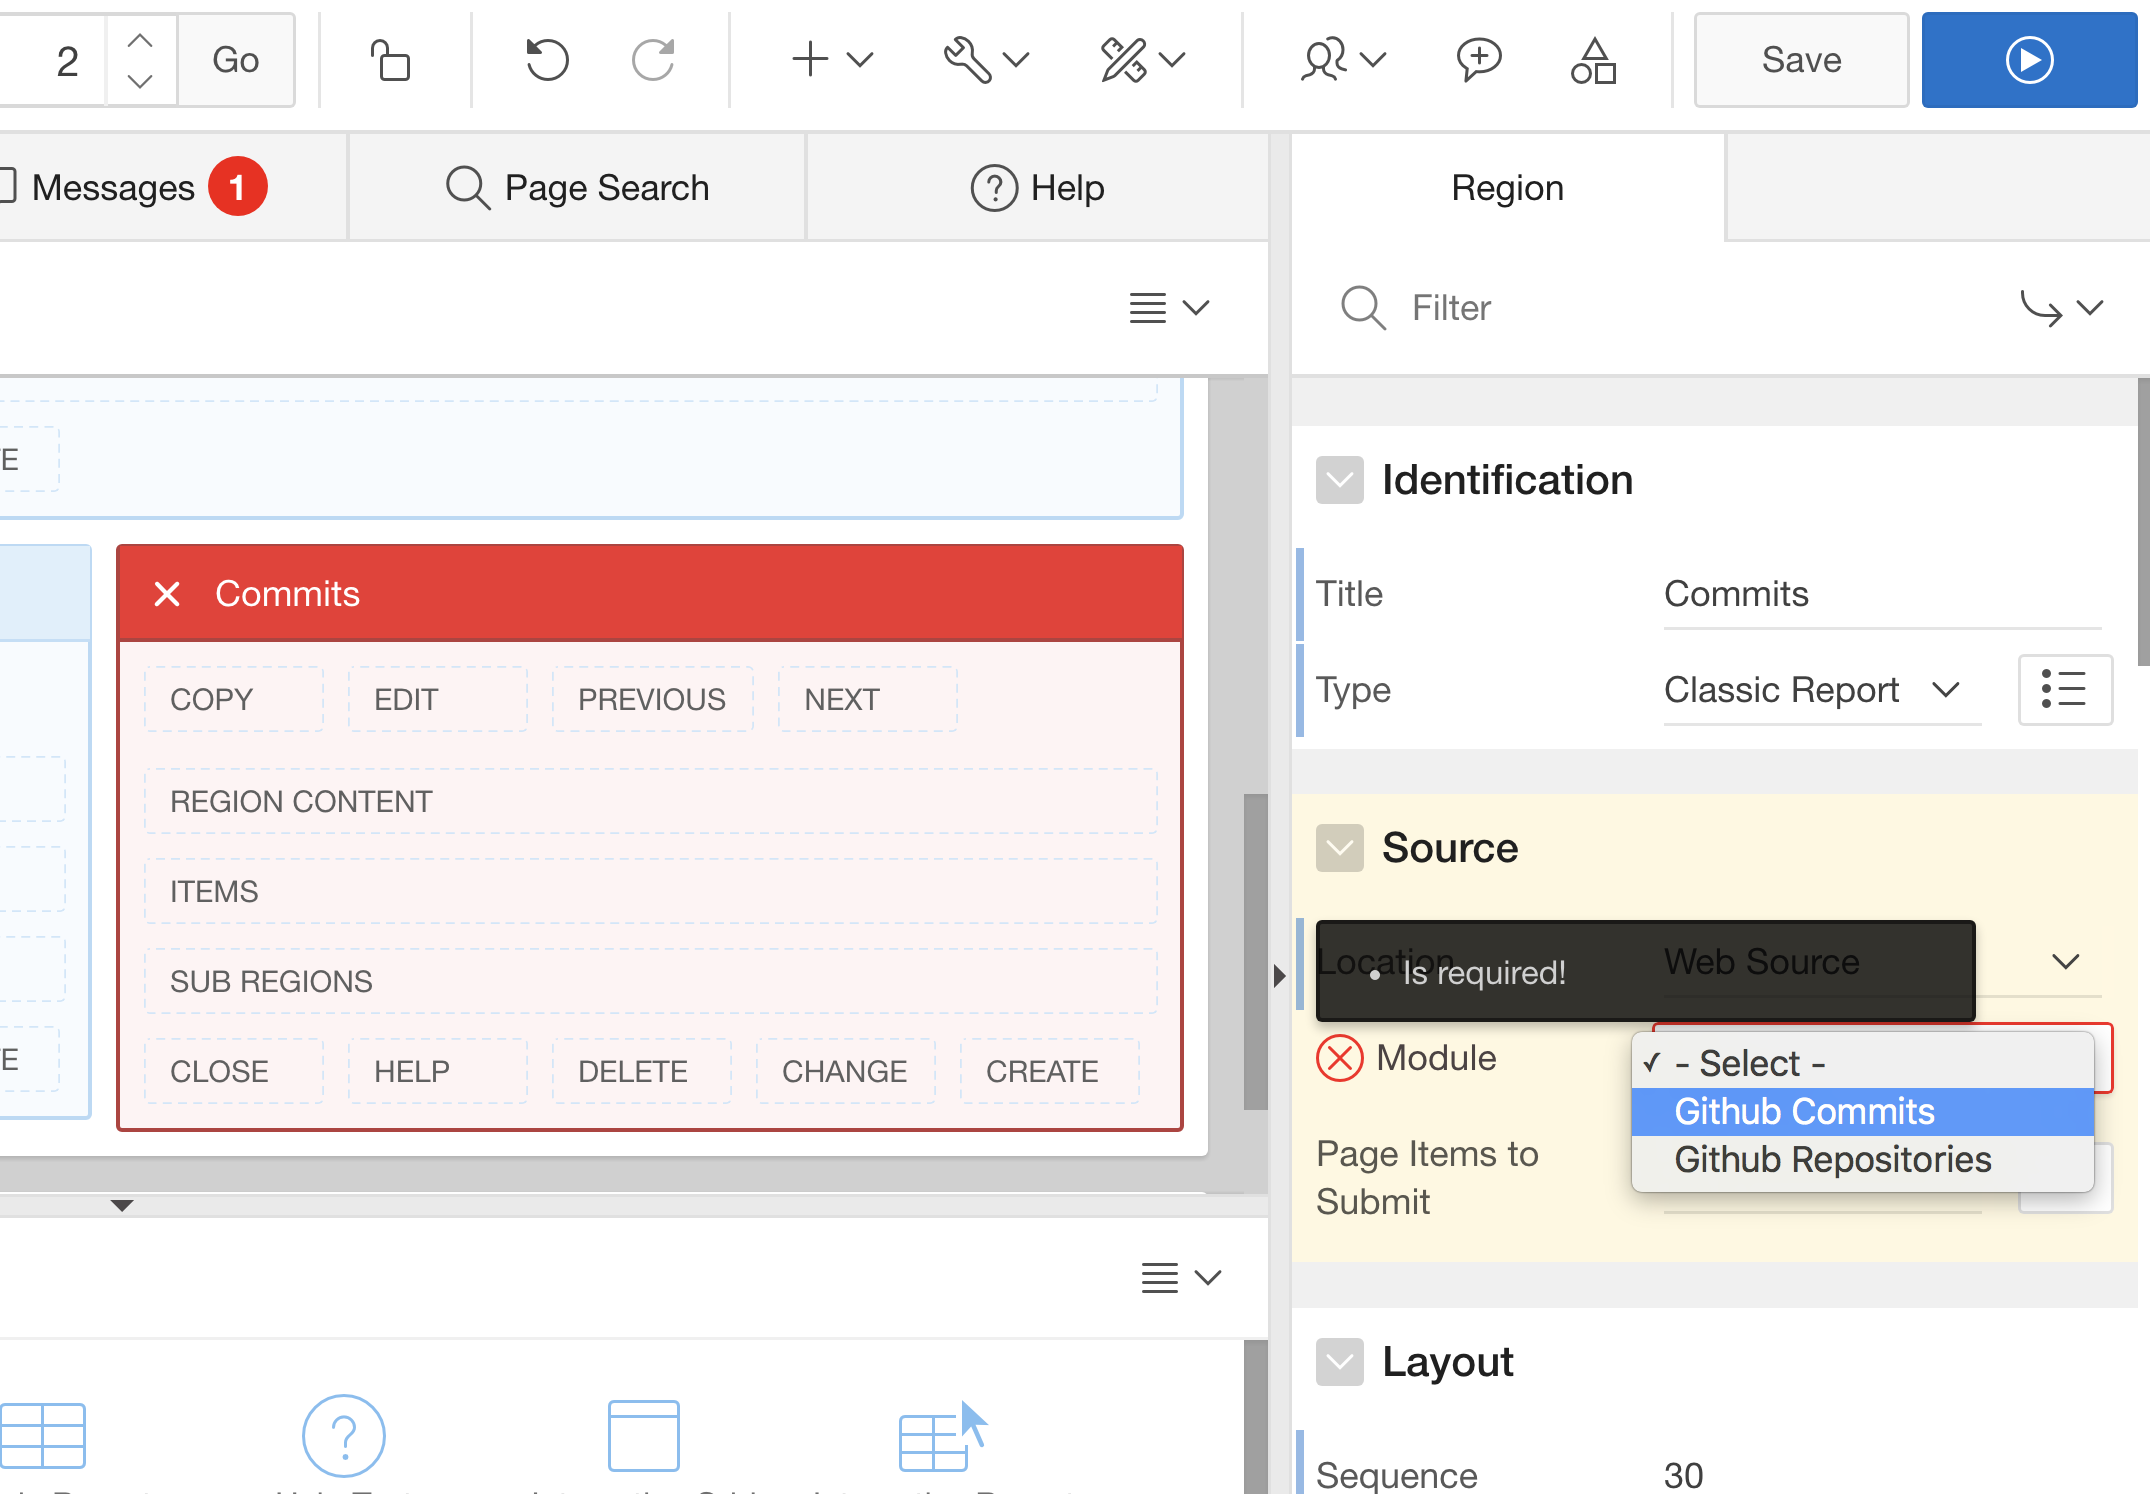
Name the region Commits and in the Data Source section, have it using the Github Commits Web Source Module.
You will see the non-hidden columns automatically being added by Page Designer. Hidden Columns are not added.
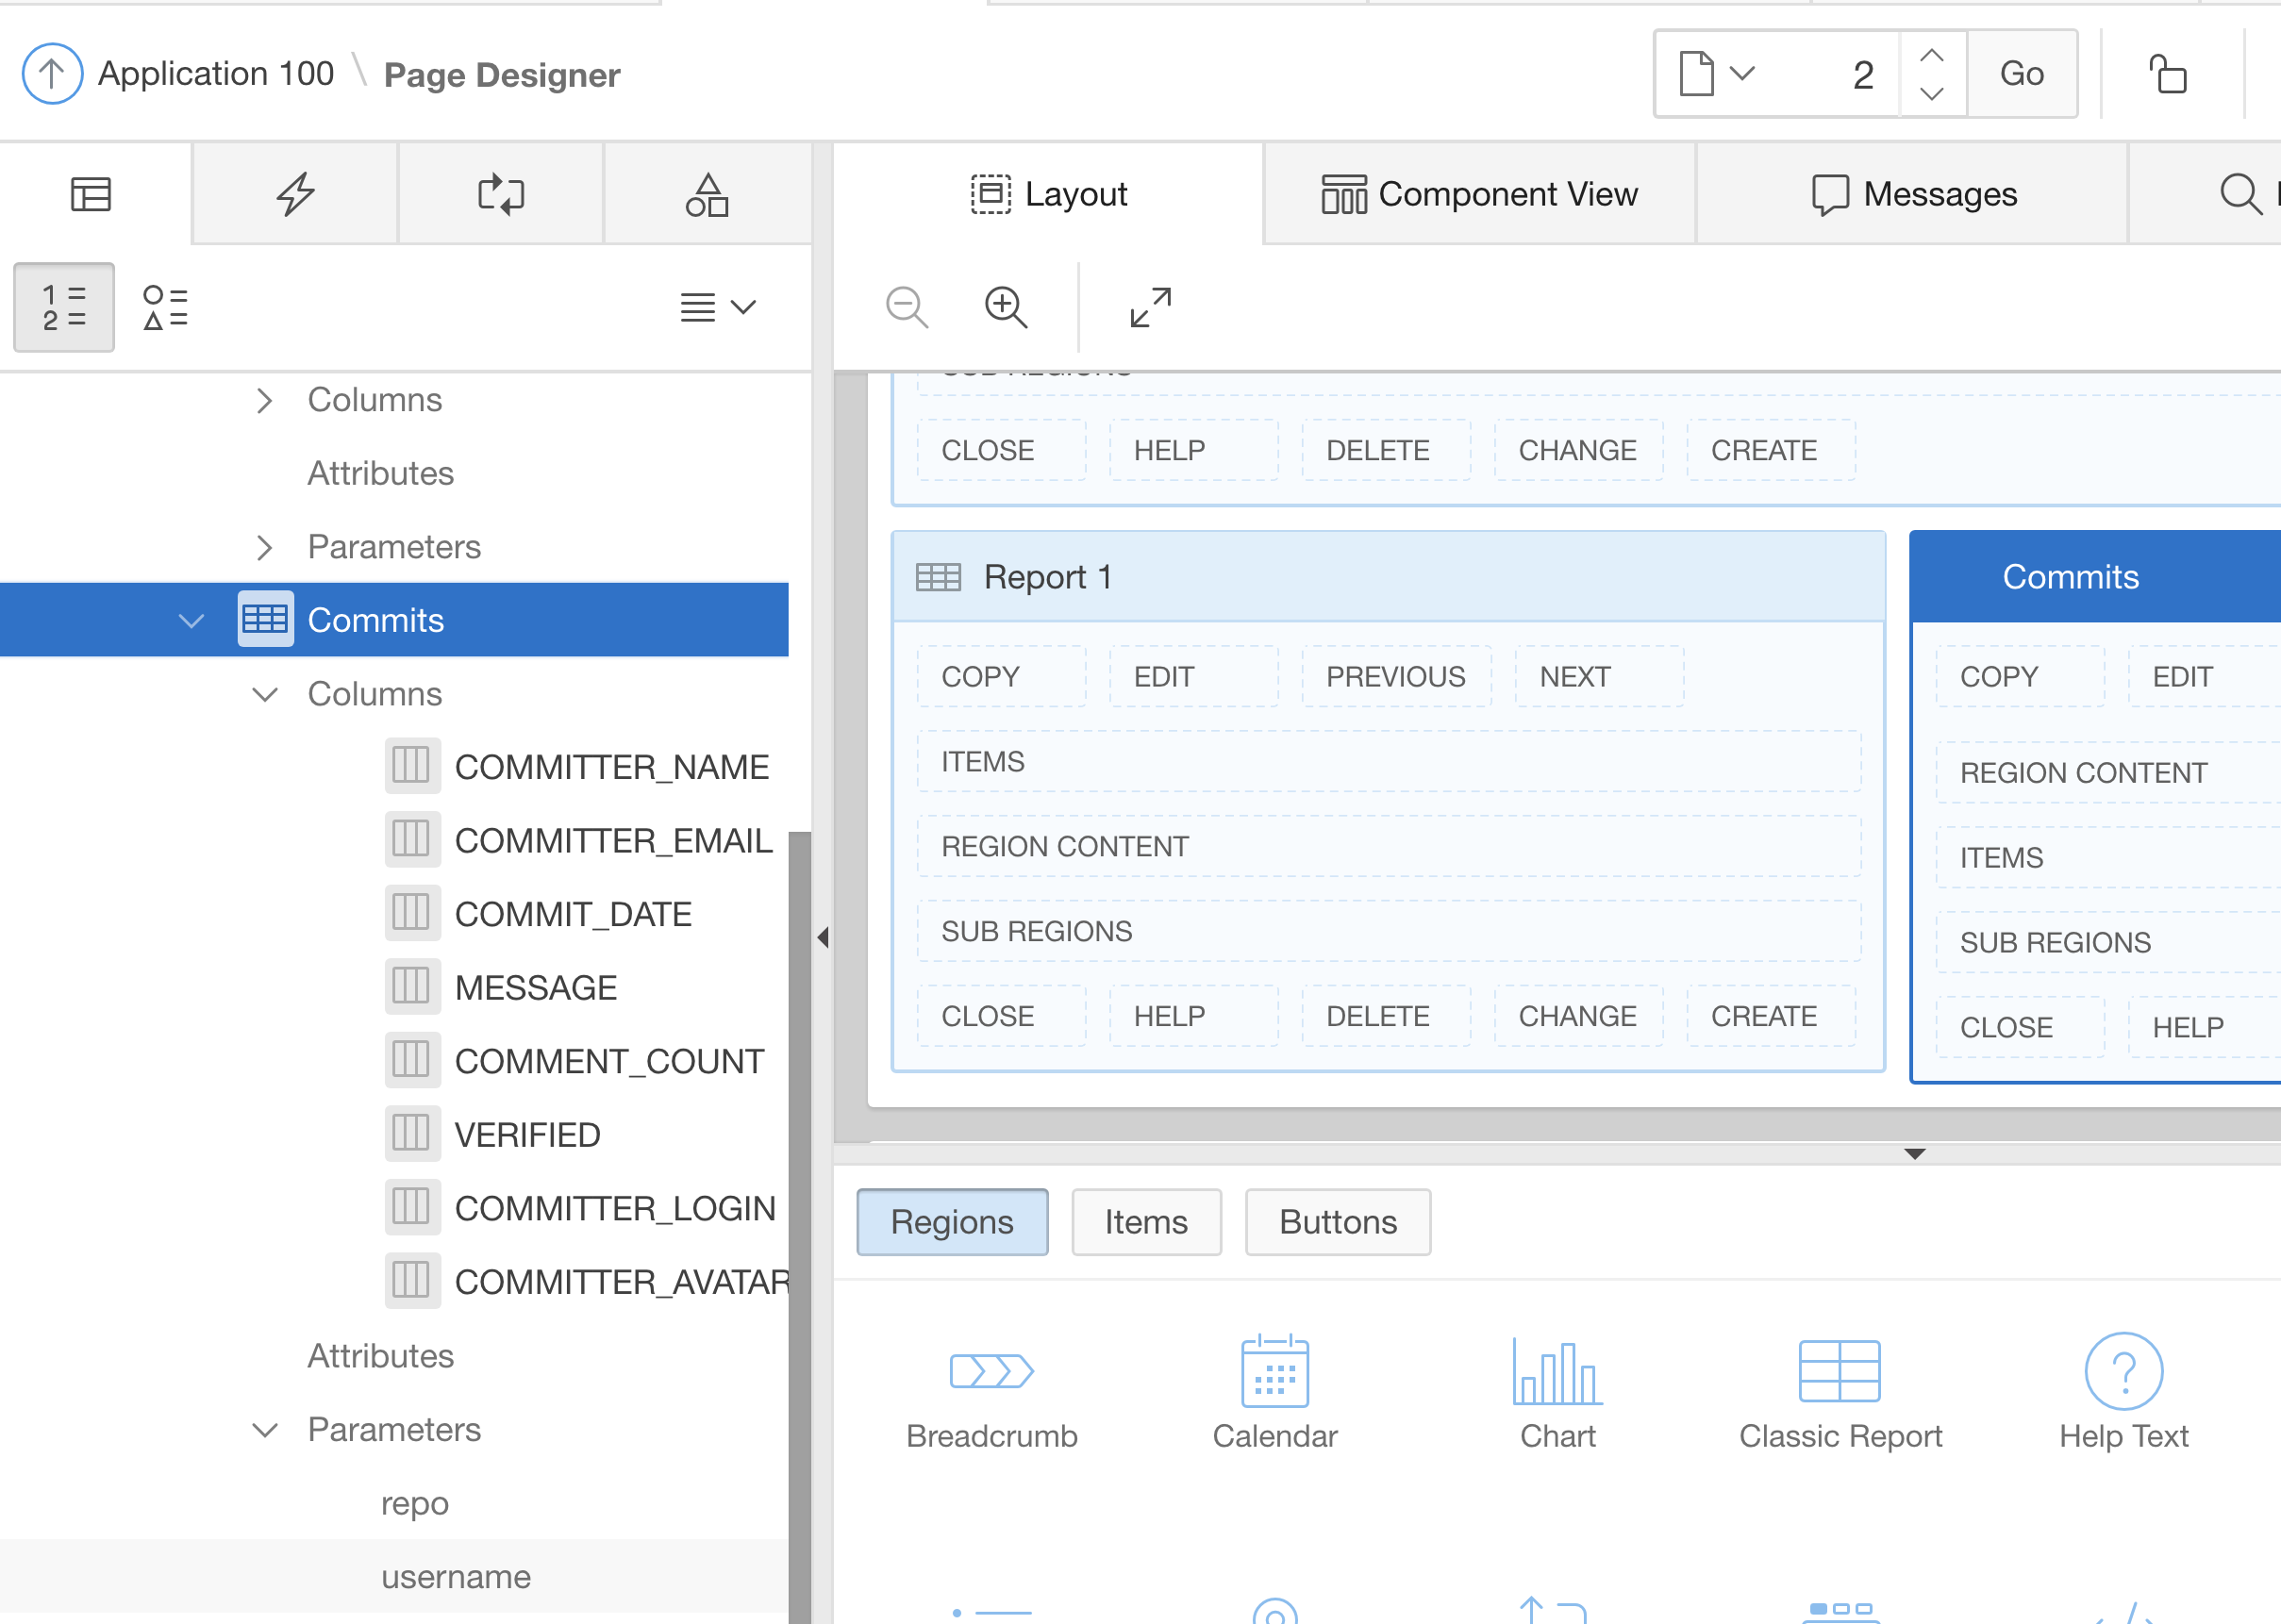
In the above screen shot, Page Designer also shows the two Web Source Parameters: username and repo. For username, we already have a page item as a text field. For repo (repository name), add another (hidden) page item to the above Static Content region. Name it P2_REPO.
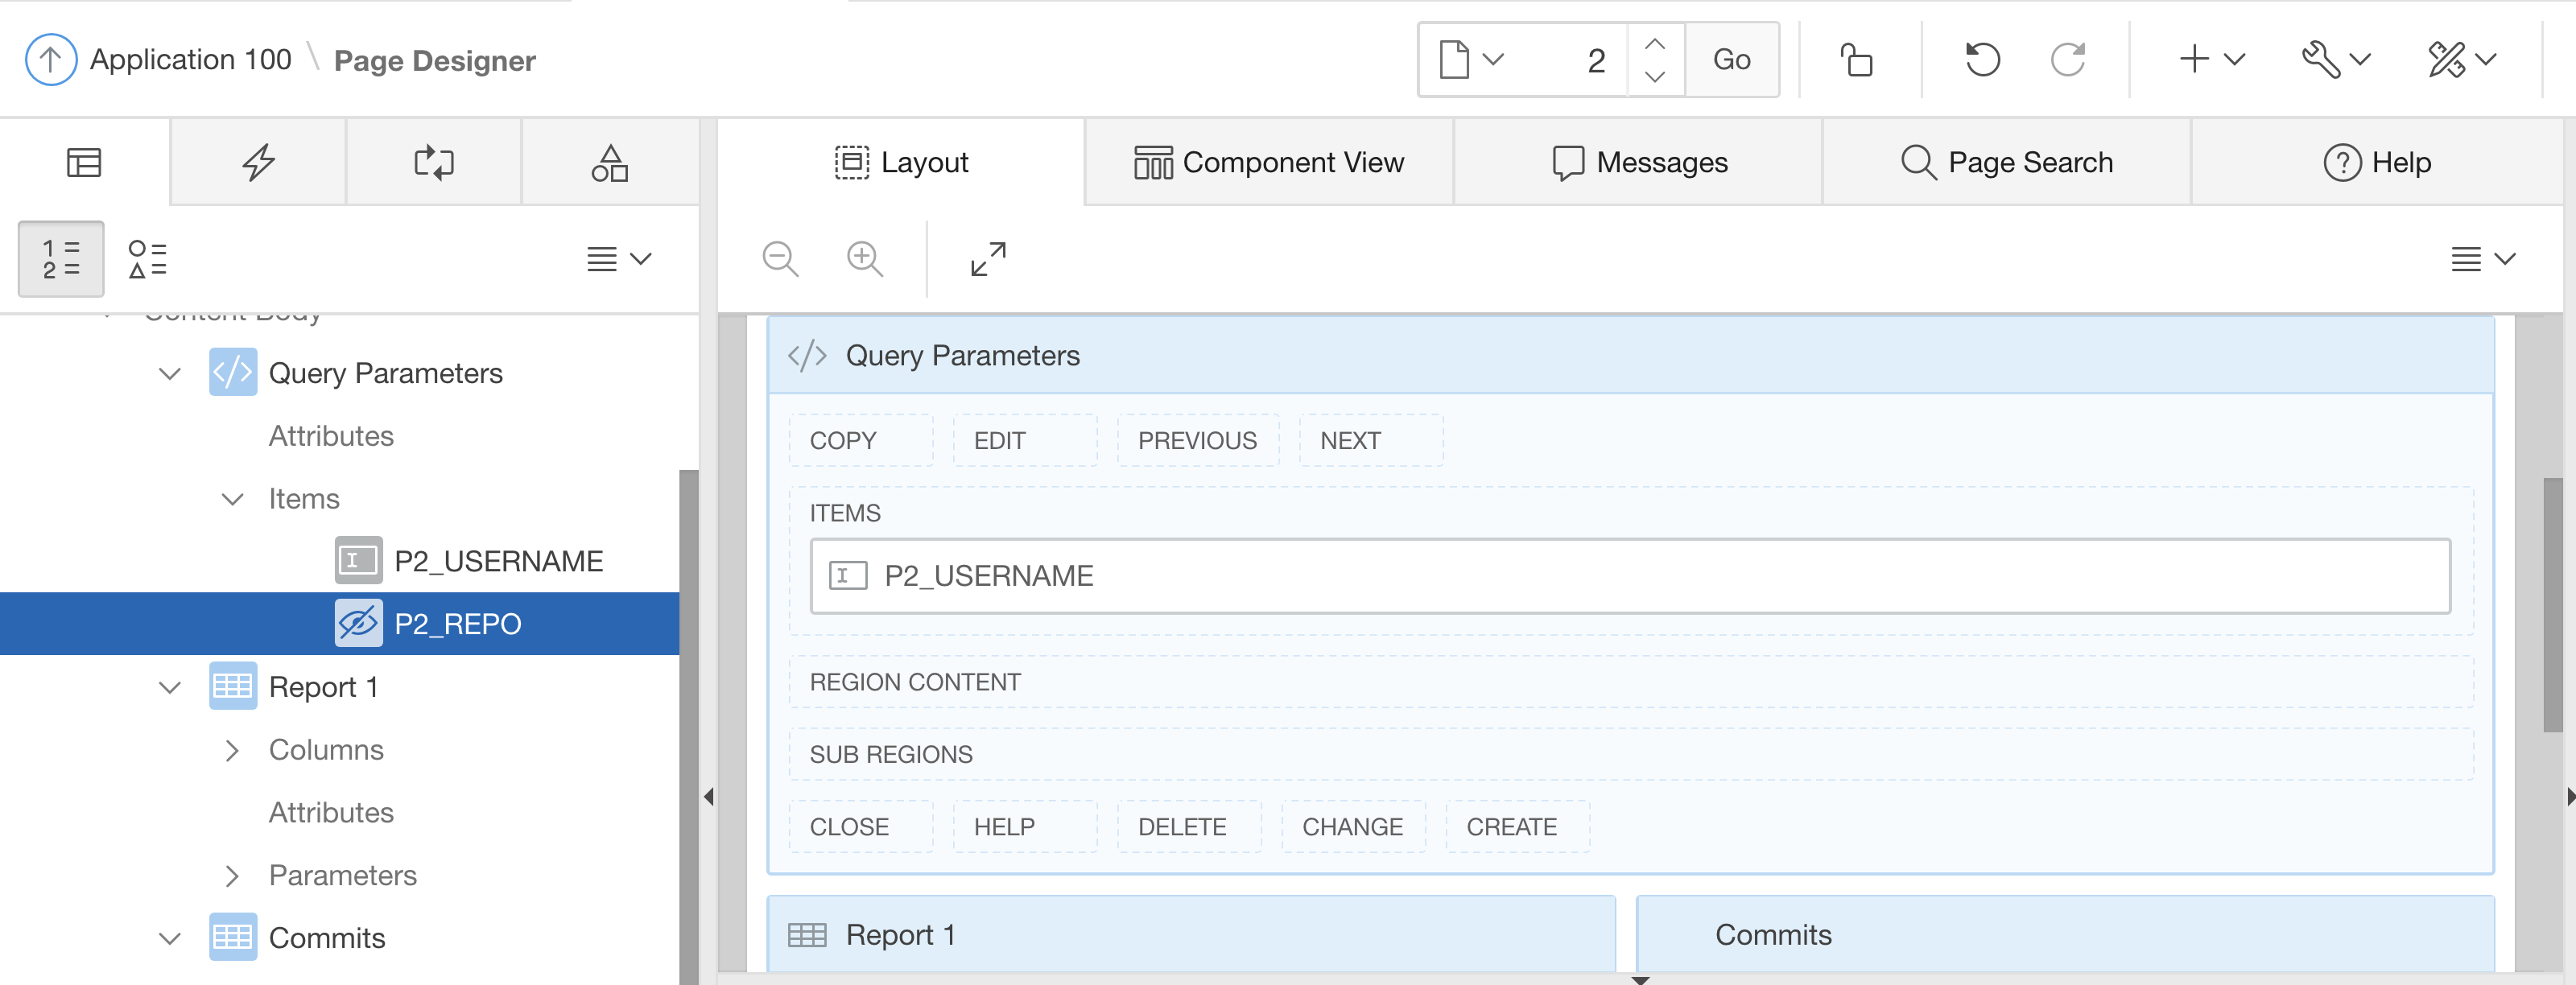
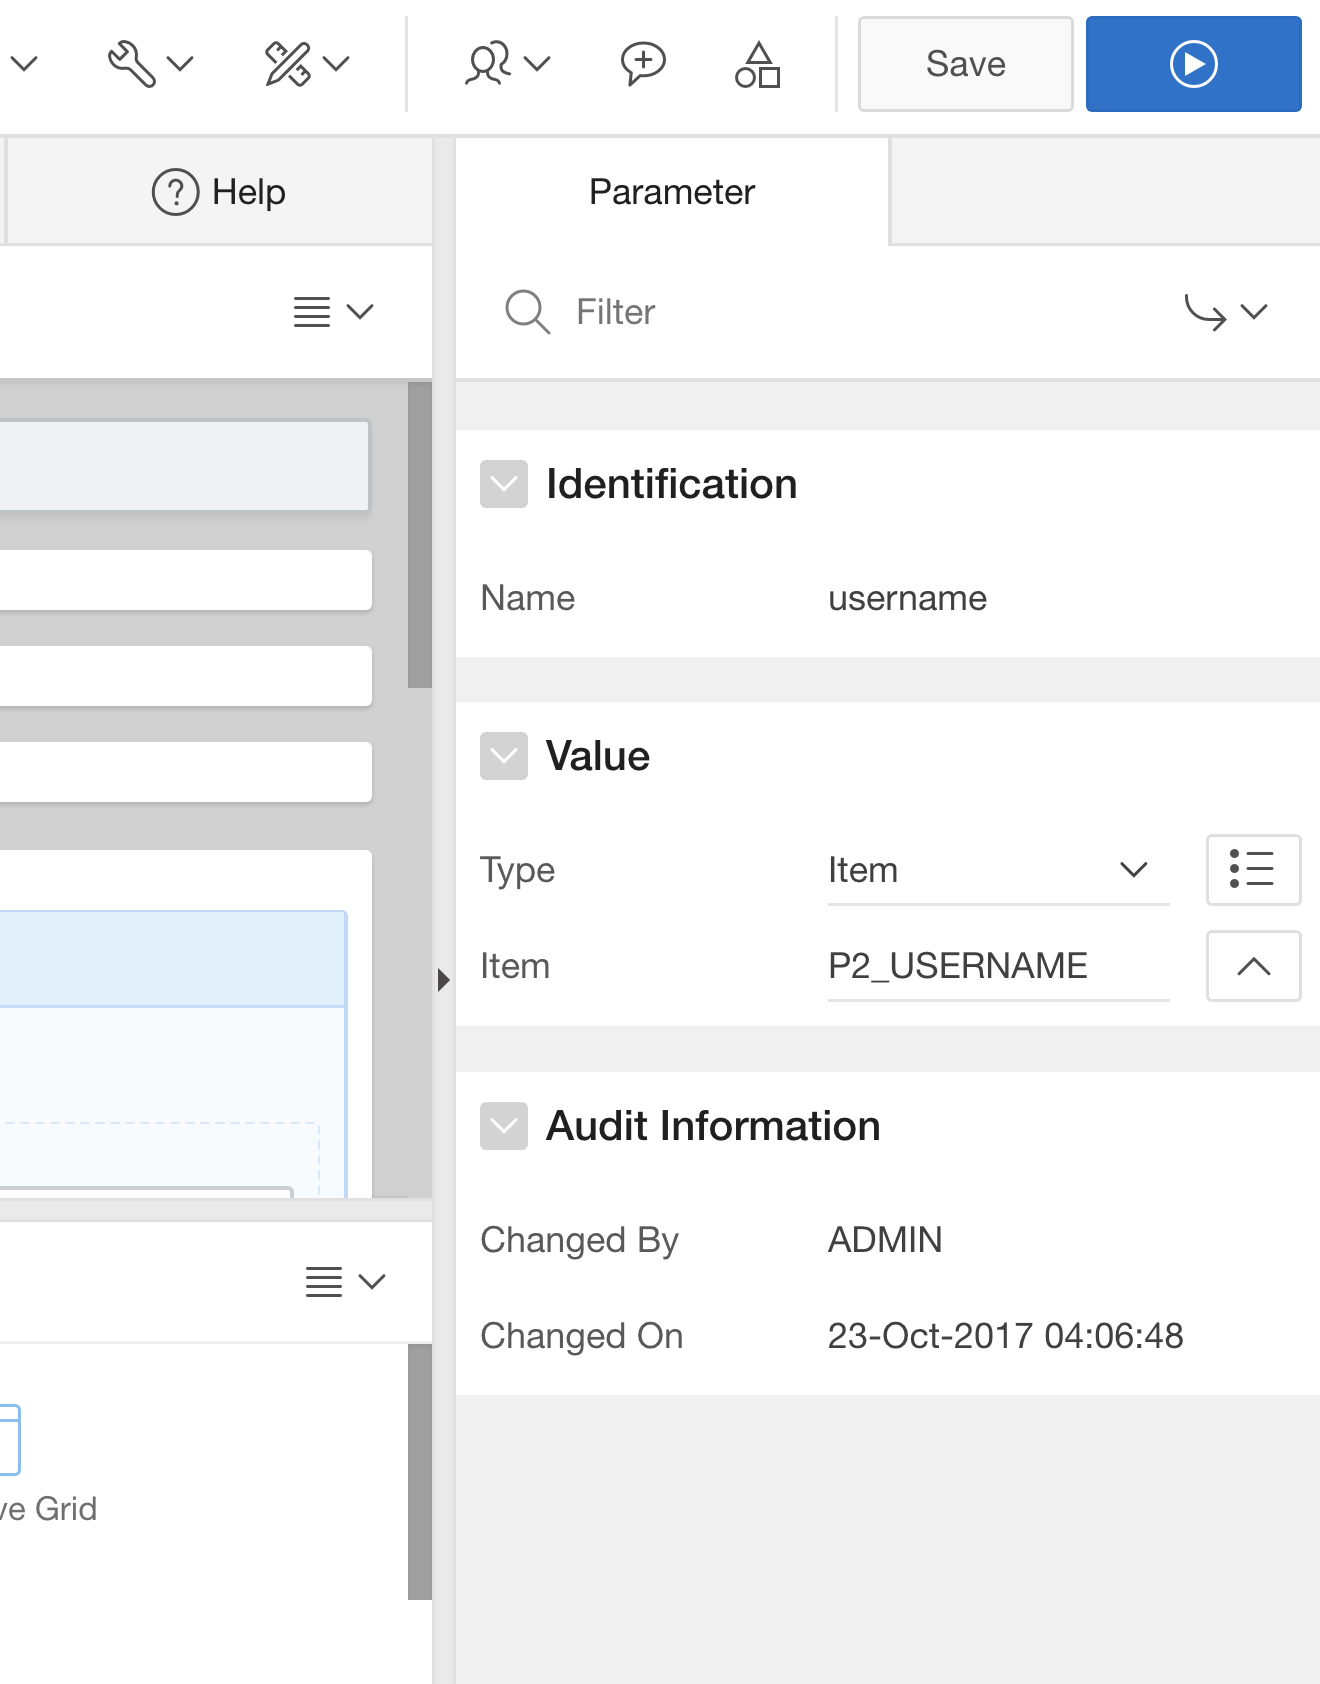
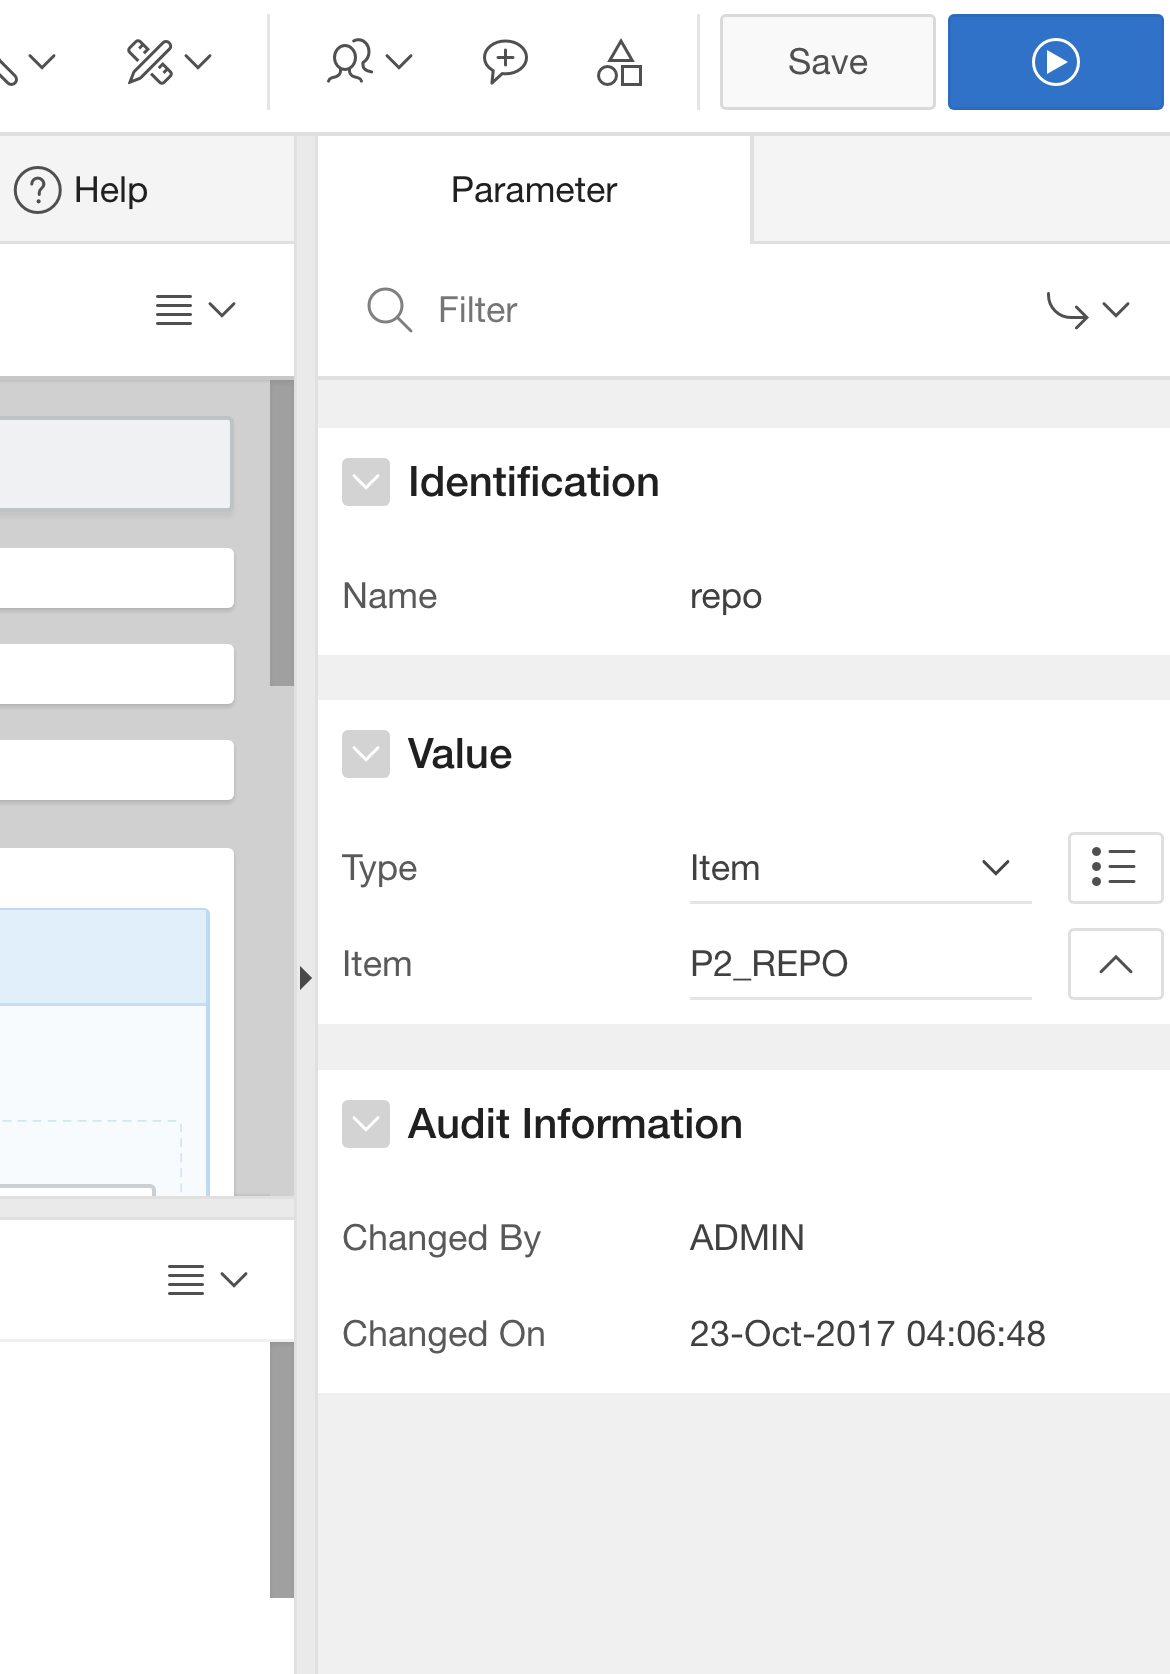
Then navigate to the Parameter node of the Classic Report and assign the P2_USERNAME text field item to the username parameter and the P2_REPO hidden item to the repo parameter.
Item values must be submitted in AJAX requests (report pagination and sorting). So add the items to the region’s Items to Submit attribute.
Let’s then link the two reports together. Navigate to the NAME column of the first report (showing the repository list). Change it to become a link column.
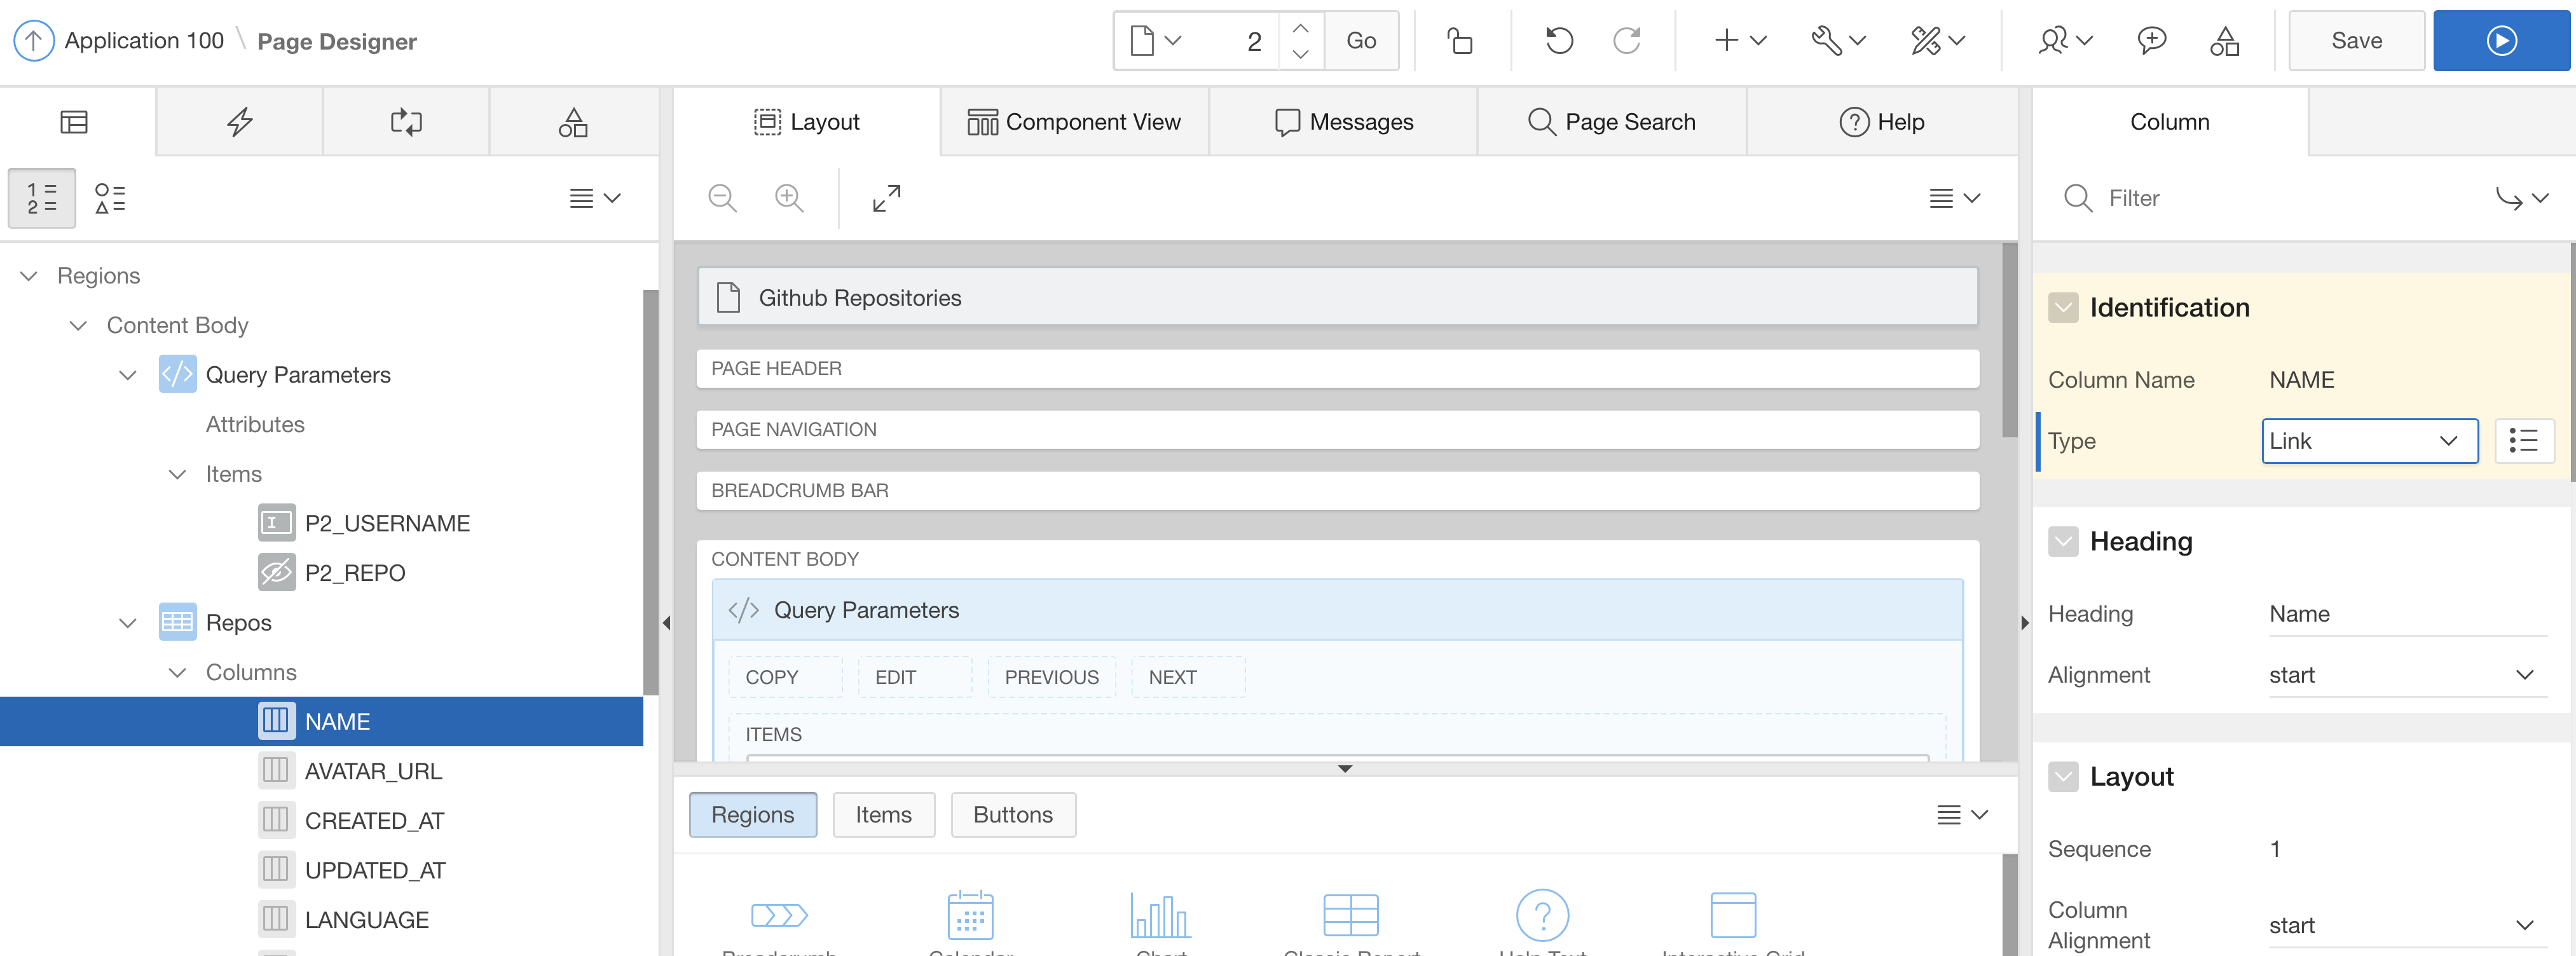
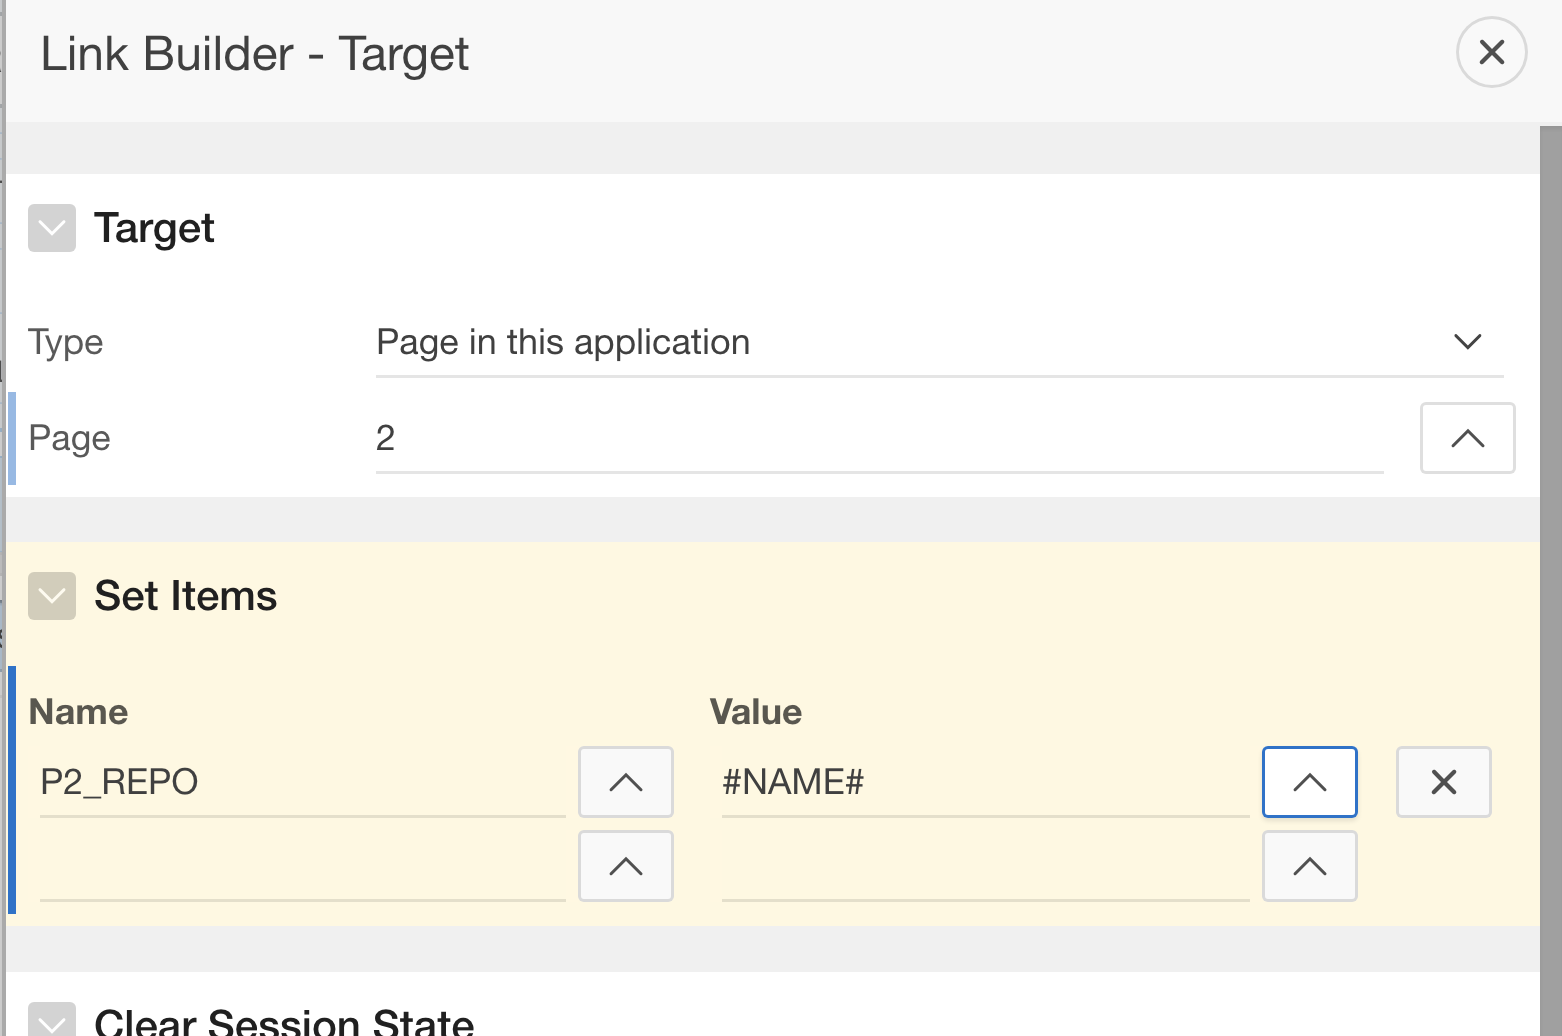
In the link attributes, link to the same page (here: page 2) and assign the value of the NAME column (#NAME#) to the P2_REPO item.
Then let’s format the second report as well: The committer’s “Avatar URL” (again) is a link to a hosted image. It’s best to just show it with an <img> tag. Configure that within the HTML Expression column attribute.
<img alt="Convert the AVATAR_URL to a picture using and the HTML Expression attribute” src=”/apex/wp-content/uploads/sites/15/2025/10/bildschirmfoto_2017_10_23_um_13_09_29.png” style=”width: 500px; height: 437px;”>
Also make the second report conditional; when P2_REPO is null, it should not be shown. Finally run your page. First it will show the repository list of the given user.
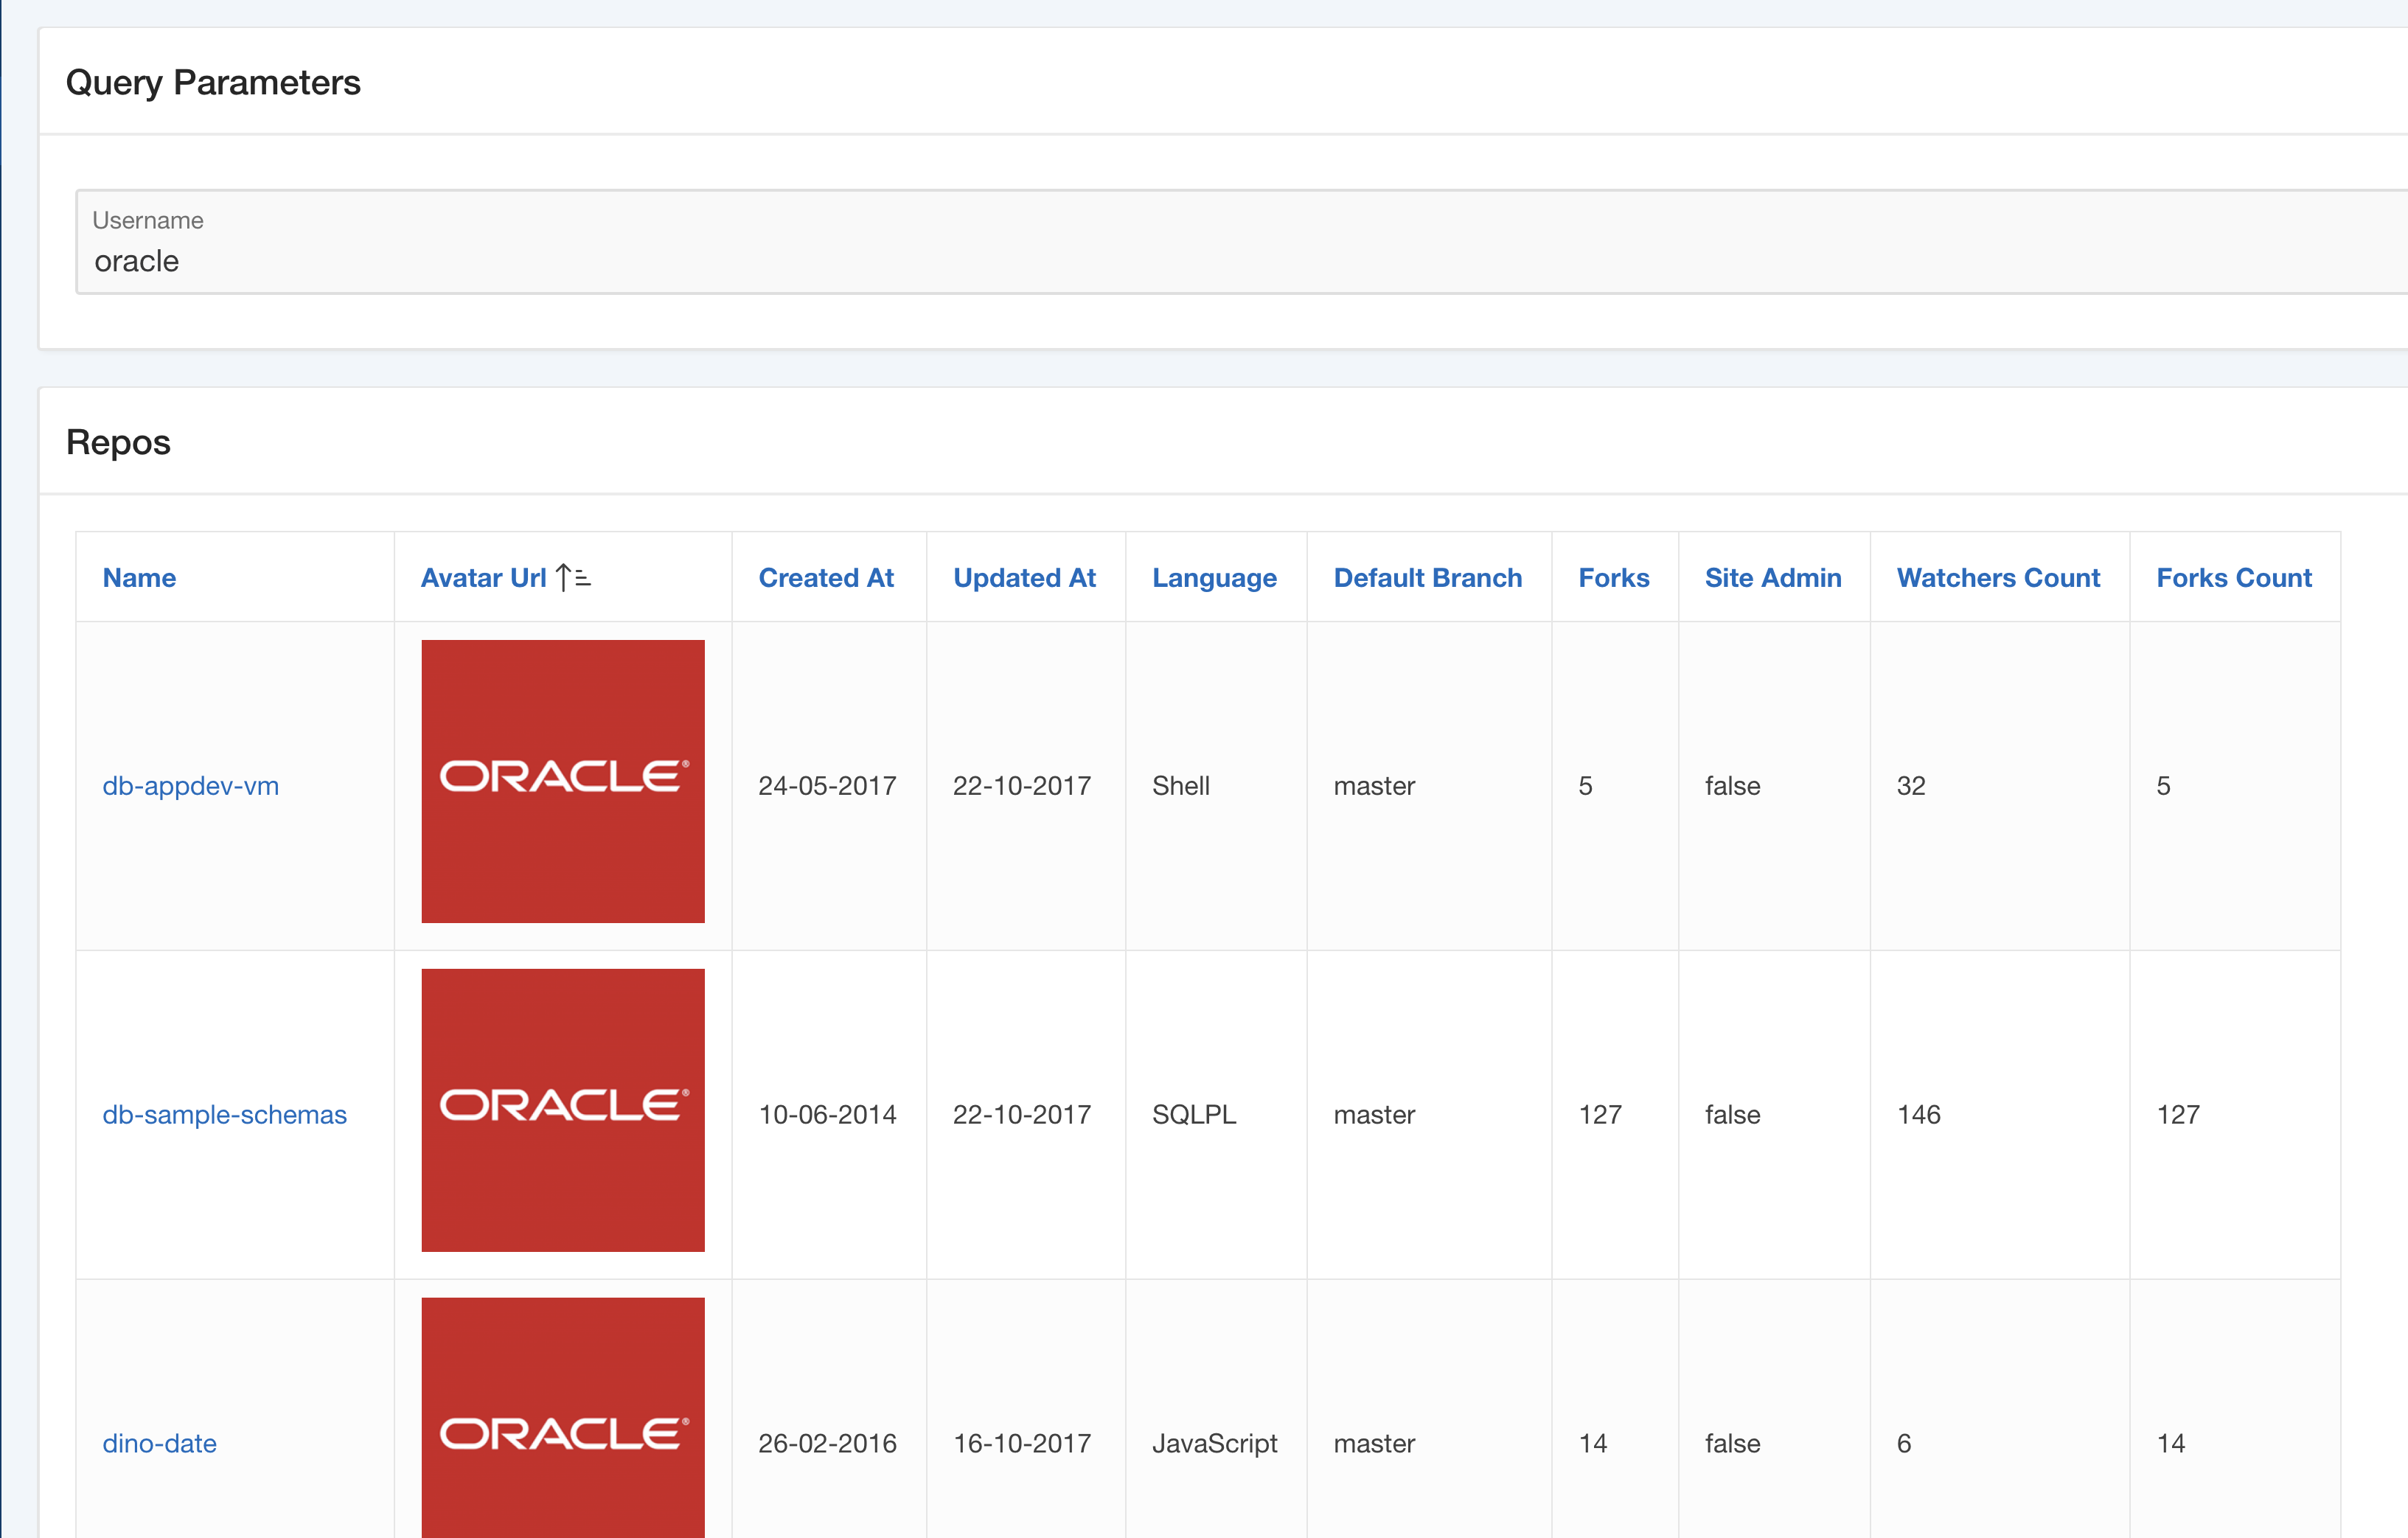
Clicking on a repository name shows the list of commits. You might sort it by commit date descending.
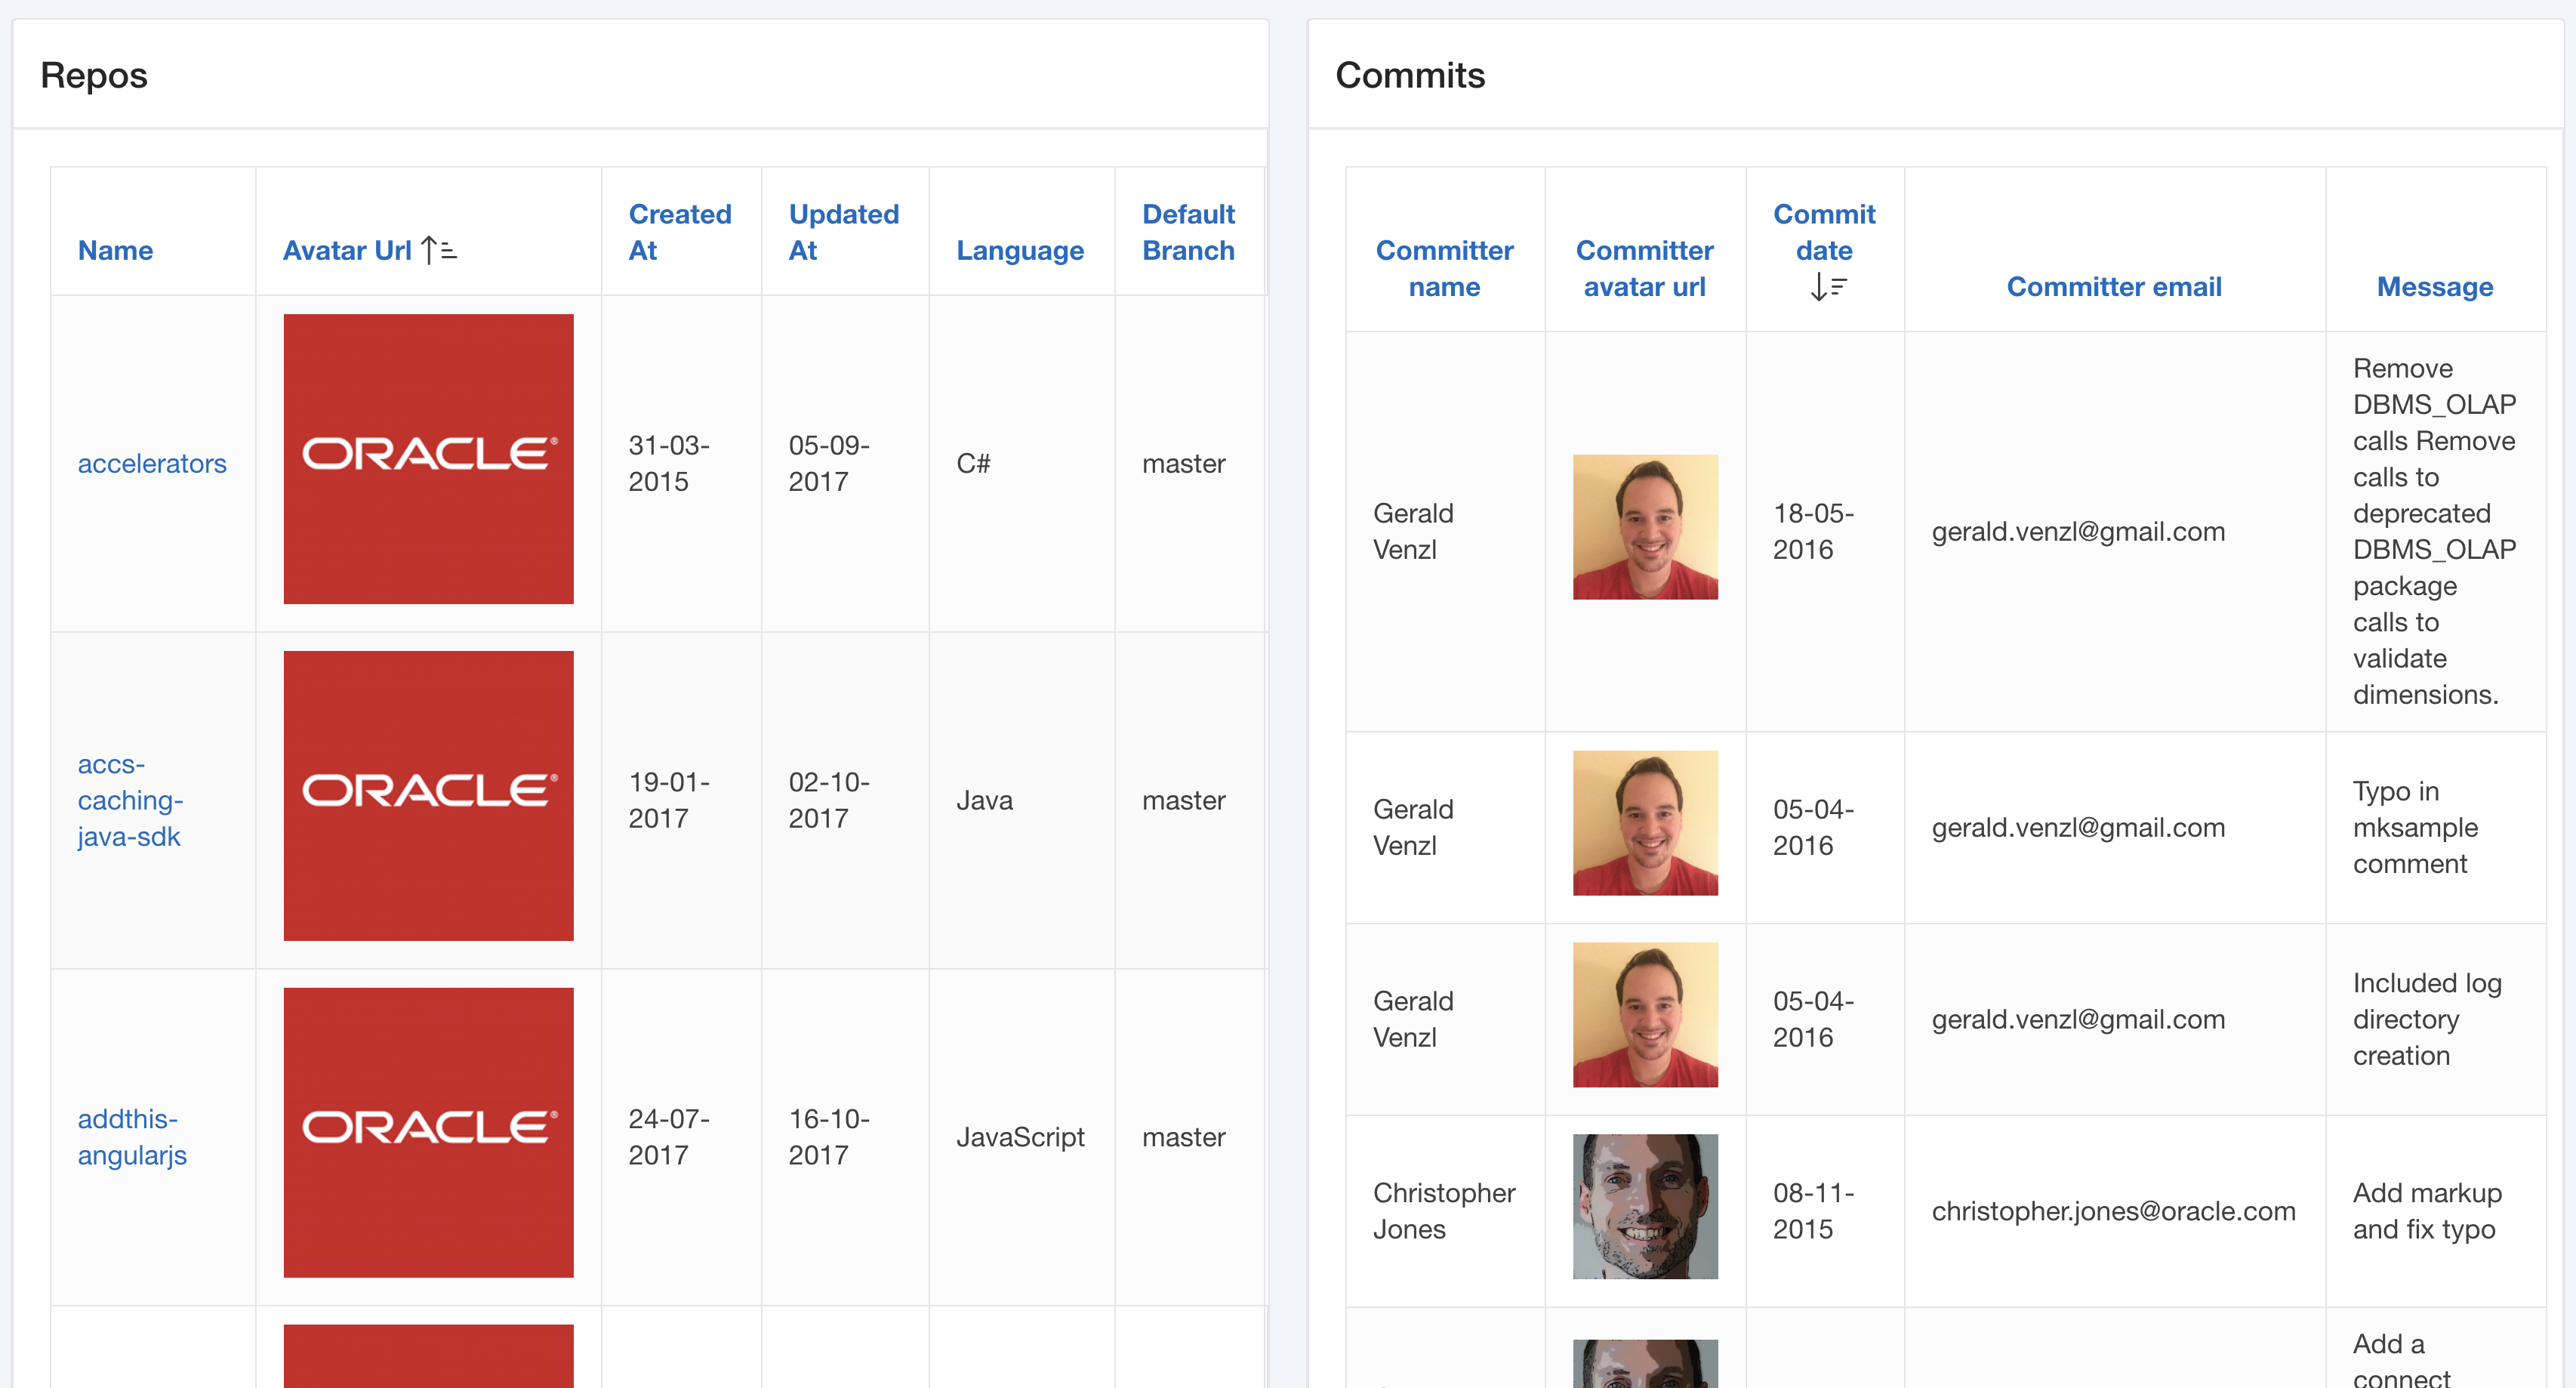
You now have built a master-detail relationship with two Classic Reports on top of external REST services. It very similar to building such a page based on relational tables. Of course, this can be further optimized; When somebody clicks the repository name to see the commits, we could refresh the second report using dynamic actions instead of reloading the page. That will work similar to a page working on tables and views – there is no REST speciality any more. Just play with this and try some variations out.