This post is the final installment in our series exploring the Oracle AI foosball demo, which was recently showcased at Oracle CloudWorld (OCW). The demo offered attendees an interactive experience, allowing them to play foosball on our table on the showgrounds floor while real-time AI-generated analytics provided insights into their gameplay. For part one of this series, see Creating an AI foosball experience: Integrating OCI technologies.
The final component of the Foosball Frenzy experience provided players with real-time insights into their game through simple metrics such as goals and possession. These dashboards completed the cycle, starting from the physical foosball game on our table, all the way to the digital analysis and insights delivered through dashboards and AI.
Why use Oracle Analytics?
When building the graphical interface, we had two options: Oracle Analytics Cloud (OAC) or Oracle APEX. While APEX, integrated with the Oracle Database, was a strong candidate for real-time analytics and insights, we opted for Oracle Analytics. Despite APEX’s low-code environment, the tight project timeline made OAC a more efficient choice with its zero-code setup and augmented analytics capabiltities. Although we sacrificed some flexibility, OAC provided a rapid no-code approach to deliver stunning visualizations.
The visual experience
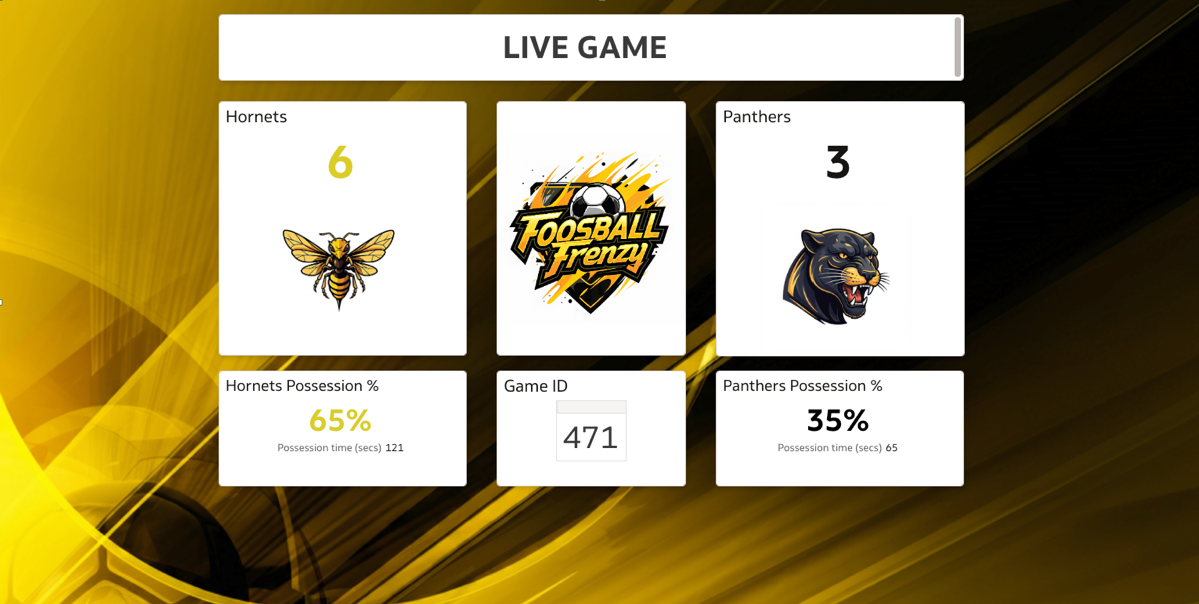
As shown in Figure 1, the live game dashboard displayed real-time game statistics, including current scores and possession percentages and updates every two seconds. As goals were scored, the data was captured and stored in the Oracle Autonomous Database, from which OAC retrieved the latest game status. While the data transfer took only a fraction of a second, the two-second refresh rate struck the right balance between responsiveness and resource management.
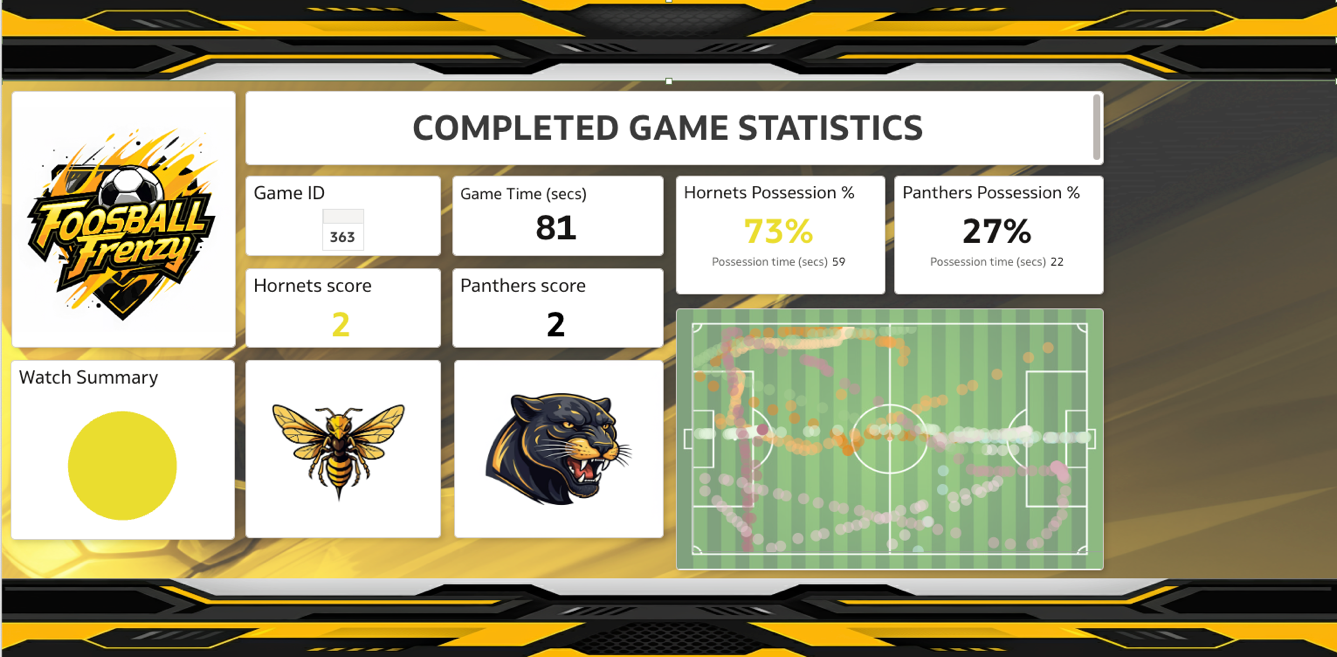
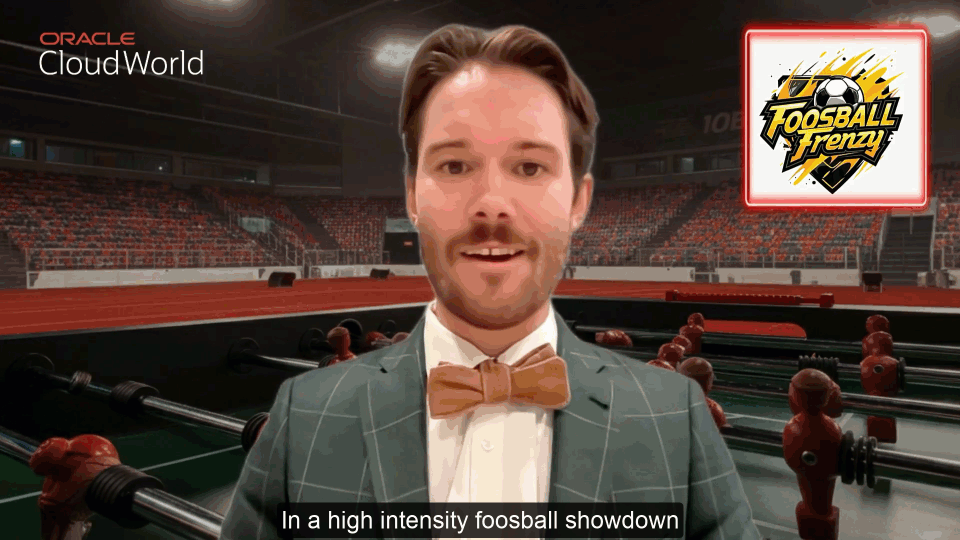
The second dashboard created was the game view, as shown in Figure 2. This view displayed all the statistics for any game that had been completed. While also displaying metrics like the score and possession, it also provided an overlay of ball position relative to the field (or table). This relative position showed interesting plays that occurred through the game. By using a custom data action, we provided a live link to the game’s AI Avatar sportscast video, as shown in Figure 3.
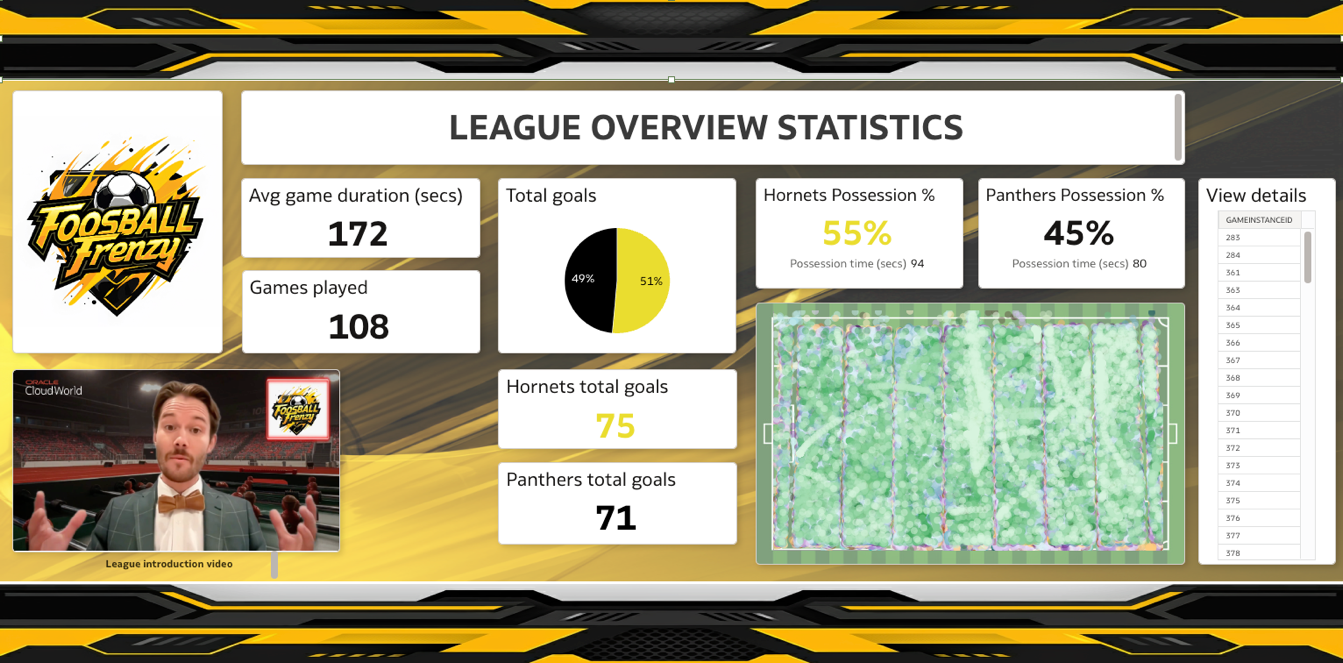
The final dashboard provided a complete view of all games played in the league. This presentation surfaced interesting insights, like the overall dominance of the Hornets (yellow) being attributed to a slight tilt on the table favoring the Hornets and our insertion of the ball on the same side after each goal.
To enhance our gaming experience, we used the Oracle Generative AI service with Llama 3.1 to create dynamic, one-minute scripts tailored with each game’s metrics. The large language model (LLM) was instructed to present the data with the energy and enthusiasm of a sportscaster. An API then passed these scripts to Synthesia, which rendered an AI avatar delivering the content. This approach offered players a personalized experience because they could watch a lifelike avatar highlight key insights from their gameplay in an engaging way.
Conclusion
The Foosball Frenzy experience showcases diigital insights, analytics, and AI-driven commentary can seamlessly enhance physical gameplay. By using Oracle technologies, we captured analog movement, stored data in the database, and delivered real-time dashboards and AI-generated sportscasts, offering players a personalized and engaging review of their performance. The combination of intuitive data visualization and advanced AI creates an immersive experience, setting a new standard for interactive gaming analytics.
For more information, see the previous posts in this series:
- Part 1: Introductory blog (this blog)
- Part 2: Core engine and data processing layer
- Part 3: Achieving automation using Python
- Part 4: Translating operational data into analytical insights
- Part 5: Visualizing the data for players
Get more information about Oracle’s:
- AI Infrastructure
- Database 23ai
- Kubernetes Engine (OKE)
- Generative AI using Llama 3
- Analytics Cloud (OAC)