Machine learning (ML) models can be sensitive to changes in data quality and can often fail silently and produce incorrect predictions, which can lead to adverse business impact. Drift in data distribution or concepts can also cause degradation of model output over time. ML observability can maintain longer term model quality by helping to evaluate, monitor, and track machine learning systems. Observability can span the entire ML lifecycle, from problem exploration all the way to postproduction monitoring, tracking changes in data, performing root cause analysis, and providing tooling to take corrective actions.
To bolster your ML observability toolkit, starting from data evaluation, training to postproduction use cases, Oracle presents ML Insights. ML Insights is a Python library that covers many ML observability use cases. In this blog post, we look at some of the salient features of ML Insights, what use cases it can solve, and a quick intro on how to use it.
How ML Insights can help
ML Insights comes with many of components and metrics that can enable users to evaluate their data, measure their model’s performance, or keep track of any drift happening in their incoming data or model output. ML Insights provides the following components.
Data reader for importing data
Data reader is responsible to read the data that we want to process. The data can come from different sources and at different stages of the model lifecycle, including the following examples:
- Initial summarization of data can be useful to help you decide what kind of model you need for prediction. It can provide useful insight like data distribution, seasonality, and missing data.
- Test and validation sets of data to generate reports on training performance
- Request and response (prediction) output of models in production for continuous evaluation.
Data Reader components can read data for a specific format. So, a CSV reader can read CSV files only. Also, data readers are intentionally kept aware of execution engines. A csv reader can come in multiple variations for different execution engine , such as CSVDaskReader and CSVSparkReader. The distinction allows the component to take advantage of any engine specific APIs and features, such as dask_delayed.
Transformers to transform input data
The transformer component provides an easy way to do simple in-memory transformations on the input data. You can use a transformer in the following methods:
- Normalize an input feature
- Change scale of selected items in a feature
- Modify or append columns based on existing columns
- Convert types
Some uses of a transformer include the following examples:
- Transforming a continuous feature to categorical feature, such as risk score to high, medium, and low severity.
Transforming multiple features into a more meaningful feature, such as house size and cost into cost per square feet.
Metrics to evaluate data and model
Metrics can be further divided into groups, where each group of metrics is useful for a specific ML monitoring use case, including the following examples:
- Minimal config run: ML Insights has an option called minimal config run, where if no specific metrics are mentioned in the input config, the library uses heuristics to decide what metric best suits the input data and automatically computes them. For a minimal config run, you only need a location and schema to input your data. This mode then selects the best metric heuristically for the data schema provided.
- Data integrity: With continuous checks in production, you can run data integrity when you want to add a data source or a new event has happened like onboarding a major customer, which can start adding rows of data from a different source into your database. A data integrity check can provide good insight on whether the new data source has the same structure as the reference data. A data integrity issue can also point to issues in the pipeline itself, such as missing values and quasi-constant features.
- Data quality: Data quality can help both in postproduction and preproduction. A data quality profile group can help understand underlying problems with input data, pipelines, and new data sources. It can also help quickly validate if an inherent assumption during the training phase is still valid, such as mean, variance, and interquartile range.
- Input data drift: These metrics can help identify if the data distribution or concepts have drifted over time from the baseline, such as KS drift, JS drift, and chi square.
- Model performance with no ground truth: Runs periodically in production gives indicator metrics that the model performance might be degrading and requires retraining or tuning. Some example metrics in this domain include feature importance and prediction drift.
- Model performance with ground truth: When ground truth is available, these metrics provide direct indication of model performance, such as accuracy, recall, and precision.
Postprocessor to take actions on evaluated metric set
Postprocessor components are responsible for running any action after the entire data is processed and all the metrics are calculated. You can use them for different purposes, like writing metric result to storage, calling any external service, and integration with other tools. The interface of the postprocessor is intentionally kept open-ended for the same reason. Postprocessor components only have access to the final output of the framework, such as the profile, and don’t have access to any of the input data. You can add multiple postprocessor components for your monitoring runs to the builder, and they all run.
Who can benefit from ML Insights?
While you can use ML Insights to solve many use cases, the following personas can take advantage of the features provided by the library:
- Data Scientists can configure ML Insights and visualize the output to set alerts and events
- MLOps and visualize the output and setting alerts and events
- Developers and engineers can configure (but mainly rely on defaults), visualize the output, and set alerts and events
- Independent software vendors (ISVs) or software-as-a-service (SaaS) Ops can configure ML Insights as part of an ML application, visualize the output, and set alerts and events across a large fleet of instances (thousands of nodes)
ML engineers can also extend the framework by providing their own custom logic for metrics and reading their own data formats.
How to use it
We can easily setup ML Insights to evaluate data and models with minimal config setup. In this example, we let the library heuristically decide which metrics to evaluate based on the input data and run ML Insights in the notebook.
Preproduction experience: Notebook
The first step to run ML Insights is to install it. The library is available publicly in PyPi. In the notebook, we can the use pip install with the following command:
!python3 -m pip install oracle-ml-insights
After the library is installed, we import some required modules:
import pandas as pd
from mlm_insights.builder.builder_component import MetricDetail, EngineDetail
from mlm_insights.constants.types import FeatureType, DataType, VariableType
from mlm_insights.core.metrics.metric_metadata import MetricMetadata

# import data reader
from mlm_insights.core.data_sources import LocalDatePrefixDataSource
from mlm_insights.mlm_native.readers import CSVNativeDataReader

from mlm_insights.builder.insights_builder import InsightsBuilder
We will then import some raw data using the in-built CSV reader. When we have loaded the input data, we also need to let the library know the schema of the data, which contains the data type.
def get_reader():
    data = {
        "file_type": "csv",
        "date_range": {"start": "2023-06-24", "end": "2023-06-27"}
    }
    base_location ="input_data/iris_dataset"
    ds = LocalDatePrefixDataSource(base_location, **data)
    print(ds.get_data_location())
    csv_reader = CSVNativeDataReader(data_source=ds)
    return csv_reader

def get_input_schema():
    return {
        "sepal length (cm)": FeatureType(data_type=DataType.FLOAT, variable_type=VariableType.CONTINUOUS),
        "sepal width (cm)": FeatureType(data_type=DataType.FLOAT, variable_type=VariableType.CONTINUOUS),
        "petal length (cm)": FeatureType(data_type=DataType.FLOAT, variable_type=VariableType.CONTINUOUS),
        "petal width (cm)": FeatureType(data_type=DataType.FLOAT, variable_type=VariableType.CONTINUOUS)
    }
That’s all the setup! With both the data loaded and the schema provided, we will use the libraries built in feature to automatically decide what metric to calculate based on the data and feature types. In order to view the final metric we now have to calculate the profile. Profile in ML Insight context is a structure that holds all the metric result (along with additional states). Profile has a lot more additional features like merge-ablilty etc. which we will cover in a different blog.
def main():
    # Set up the insights builder by passing: input schema, metric, data frame and engine details
    runner = InsightsBuilder(). \
        with_input_schema(get_input_schema()). \
        with_reader(reader=get_reader()). \
        build()
    # Other Insights components that can be configured are:
    # - Metric - Can explicitly define metric. If not present, the minimal insight will pick with some in-built heuristic
    # - Custom Transformers (ability to transform incoming data frame to add/update/merge/delete/normalize etc features)
    # - Conditional Features (ability to create new features from existing features using python expressions)
    # - Tags (ability to provide custom metadata to be added as key-value pairs to a Profile)

    # Run the evaluation
    run_result = runner.run()
    return run_result.profile
Finally, we can use built-in profile apis to view the results that were just computed. The data can be visualised in different formats, such as dataframe, json etc. We can also pass on these results to any visualisation library to view graphs and chart based UI.
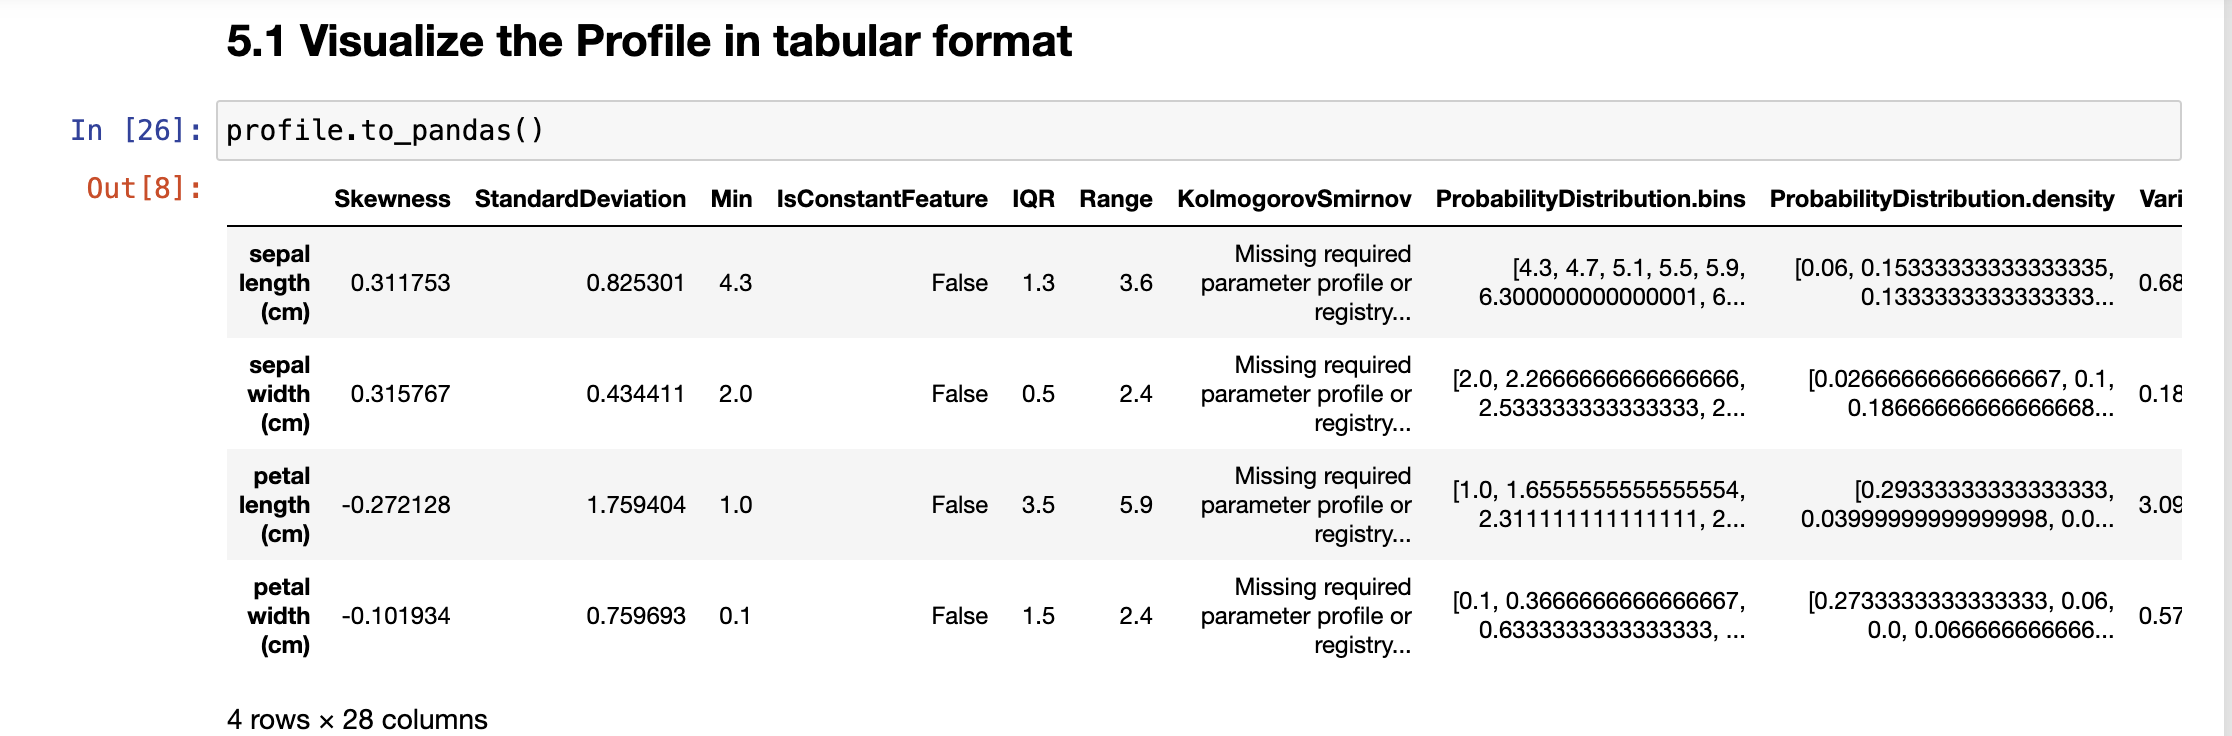
Note: Not all columns are visible in this results
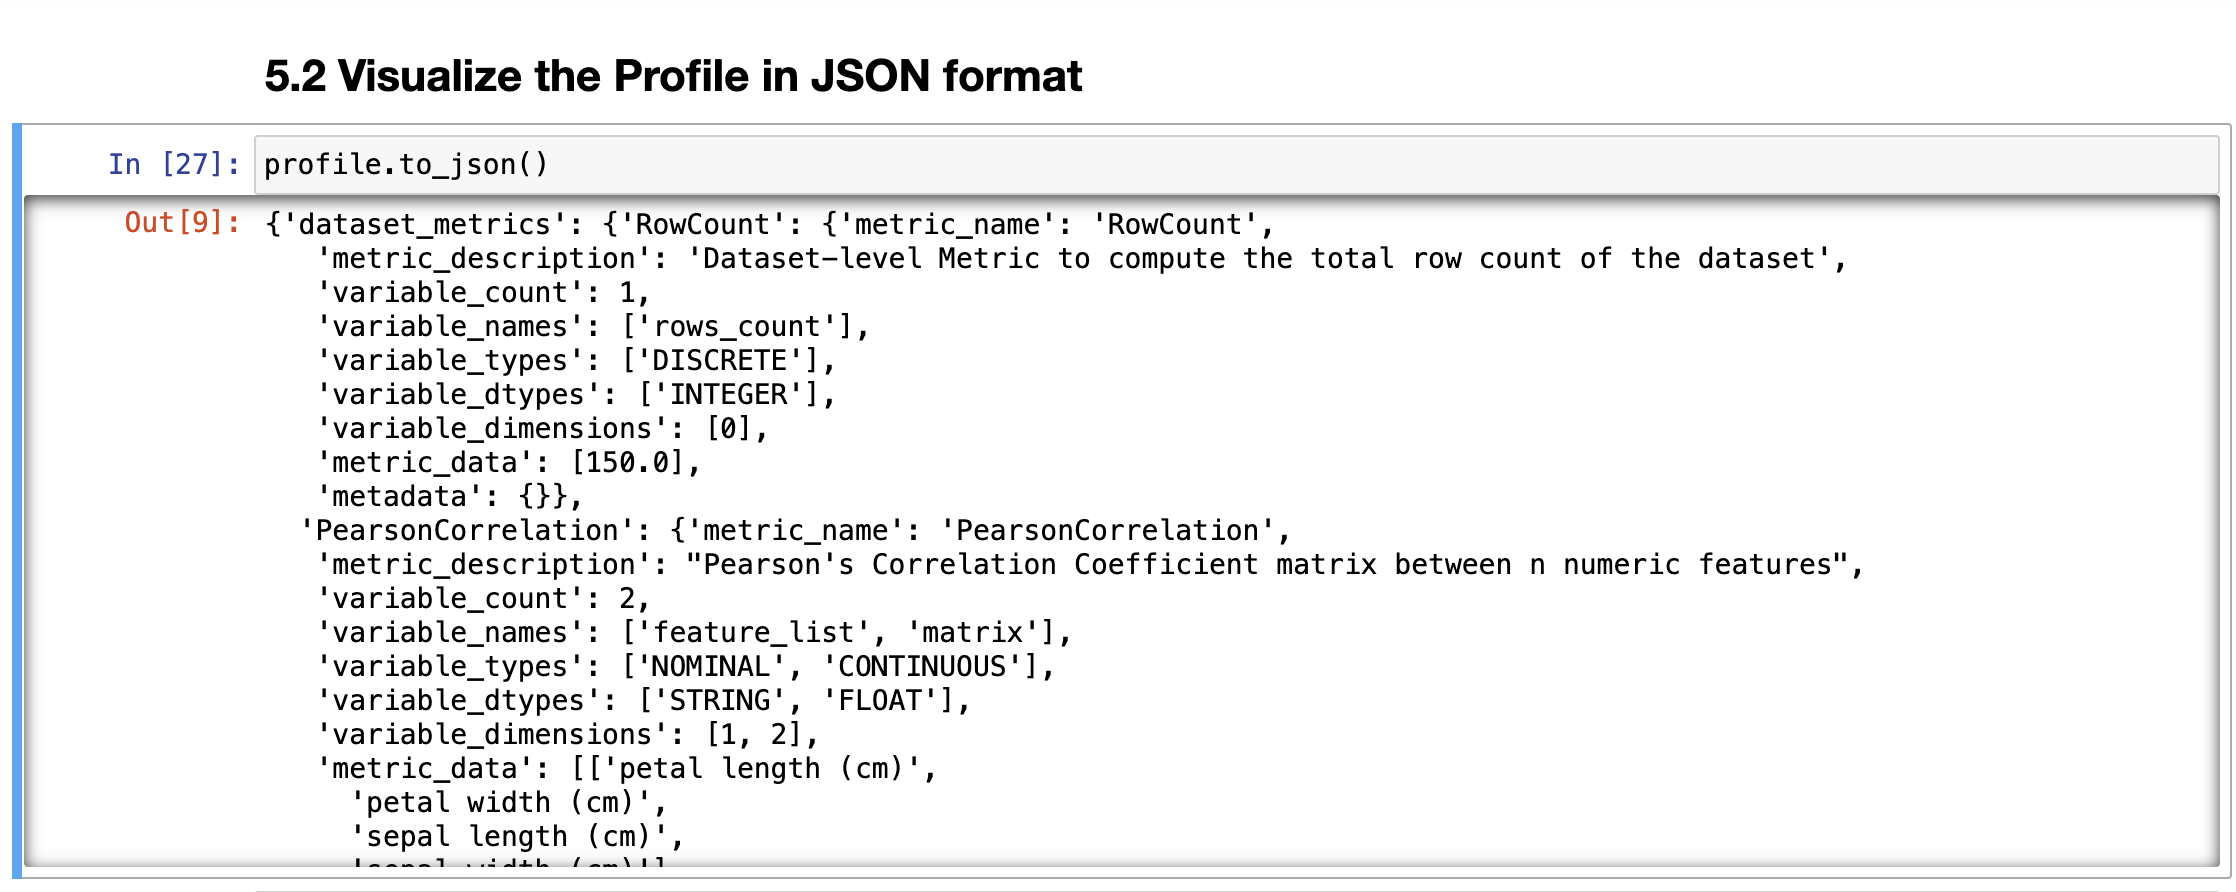
Similarly the result can also be viewed in json format:
Where can ML Insights run?
ML Insights can run anywhere. The library supports Pandas with in-memory processing, Dask for distributed computation and cluster based processing, and Spark compute. Changing the compute type on which the library runs only requires a configuration change and no code change at all. The library is also capable of running in multiple Oracle Cloud Infrastructure (OCI) infrastructures like ML Jobs, Oracle Container Engine for Kubernetes (OKE) , and Data Flow.
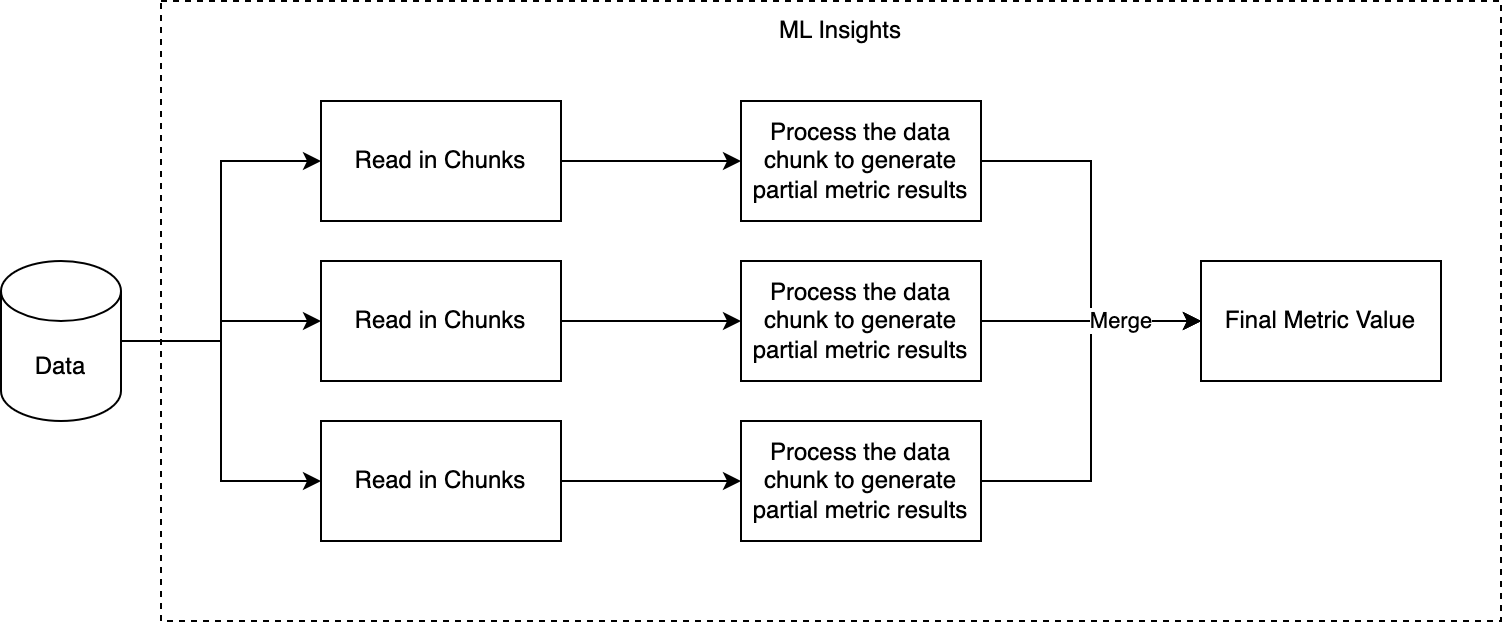
Running ML Insights for large volumes of data
Along with providing more than 50 metrics in different monitoring use cases like data integrity, data quality, model performance, and data drift, ML Insights provides the added advantage of processing and calculating all these metrics for large volumes of data. The library accomplishes this goal by loading the entire set of data in smaller chunks and then processing them in parallel. The library takes advantage of the parallel processing both in a single node with multiple CPUs or in a multinode cluster system. The following figure shows the overall process how ML Insights can process large amount of data.
Single Node Multiple CPU System (Dask)
Even on a single node, users can use dask to process large volume of data incrementally. Regardless of the size of the data, the system should never run into out of memory issues if the data partition values are correctly configured. If the node has access to multiple cpus, this will allow processing multiple partitions of data simultaneously, making the processing much faster.
Sample notebooks showcasing how to setup can be found in the Sample Notebooks link below.
Multiple Node System (Spark)
ML Insights is also compute agnostic and supports out of the box compute options like Dask, Pandas and Spark without the need to change any code. Just by changing the reader type or the input data frame type, the library can automatically change all underlying construct to run on the corresponding compute. Hence, if the library is supplied with SparkDataFrame, it can be run in OCI Dataflow.
Sample notebooks showcasing how to setup can be found in the Sample Notebooks link below.
Below we will showcase how we can set up the library to run in OCI infrastructure utilising the dask local cluster.
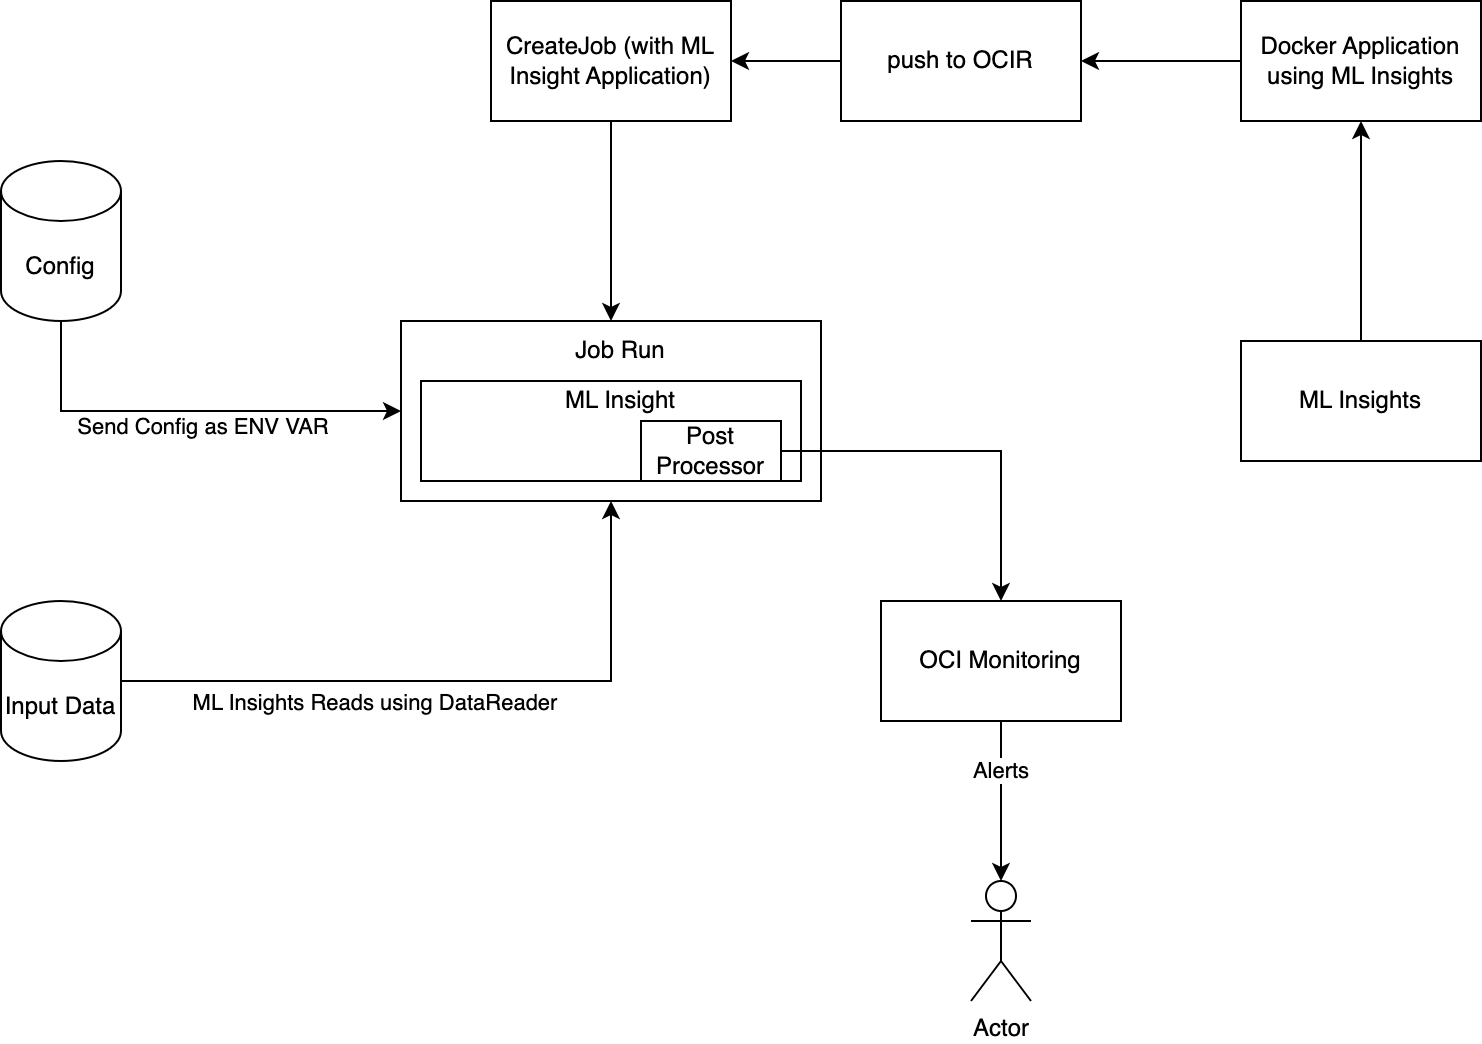
Post Production Experience – ML Jobs
In addition to running ML Insight in notebook for quickly testing data, the library also supports post production use case. The library can be containerised and run in different infrastructures like ML Job, OKE or OCI Dataflow. We have provided an overview of such a solution. We will discuss such solution in more details in upcoming blogs.
Getting Started with ML Insights
This is just a small introduction of what ML Insight can do. To learn more try out Oracle Cloud Free Trial! A 30-day trial with US$300 in free credits gives you access to Oracle Cloud Infrastructure Data Science service. For more information, see the following resources:
Full sample including all files in OCI Data Science sample repository on Github.
Visit our datascience service documentation.
Read about OCI ML Insights
Pypi – Link here
Configure your OCI tenancy with these setup instructions and start using OCI Data Science.
Star and clone our new GitHub repo! We included notebook tutorials and code samples.
Watch our tutorials on our YouTube playlist (change the link)
Try one of our LiveLabs. Search for “data science.”