When you’re trying to get SQL to run faster there’s one thing that’s vital: an execution plan. In this post we’ll investigate four ways to create these:
But before we begin let’s answer the question:
What is an Execution Plan?
The plan for a SQL statement is a set of instructions. This tells the database how to access the data and join it together.
Plans come in two varieties:
- Explain
- Execution
These sound similar. But they’re different. To understand why consider this example.
You’re making a car journey. You plan it beforehand. This is the route you expect to take.
But just as you’re going to leave, you hear on the news that there’s been an accident on your chosen route. This will make it much slower. So you go a different way.

There are two routes here. The one you expected to take and the one you actually took.
After you arrive you wonder whether you could have completed the journey faster. To figure this out, you need to look at where you went. Not where you planned to go.
An explain plan predicts how Oracle will process your query.
An execution plan describes the steps it actually took.
Just as in the driving example above, Oracle may use a different route than the one it predicted. As Tom Kyte discusses, there are several reasons this could happen. So to diagnose your queries, you need to know what Oracle did. Not what it guessed it might do!
Side note
“Explain plan” sounds a lot like “execution plan”. This can lead to confusion. Many times when I ask people to supply an execution plan they provide one of the explain variety instead.
I think it would be better if we gave these very different names. For example, calling execution plans “described paths” or similar. This would help alert people to the fact these are different things (though they look similar) and reduce the chance of confusion.
Top tip: If someone asks you for “the plan” they’re usually looking for one of the execution variety. I.e. what really happened.
So with that cleared up, how do you go about gathering them?
Autotrace
First up, autotrace. This is a freely available tool. You can enable it in SQL*Plus using the “set autotrace” command.
With this on, after each query Oracle displays its output. Below this is the plan along with its performance stats:

If your query returns hundreds or thousands of rows you have to wait for Oracle to display them all. This can be a pain.
Luckily you can suppress the results with the trace[only] option. You can also choose to show just the plan or the stats. For example, to hide the query output and show just the stats, use:
set autotrace trace stat
To include the output and the plan, enter
set autotrace on exp
Once you’re finished you can switch it off with:
set autotrace off
While using SQL*Plus is better than nothing, it has several limitations:
- It doesn’t show the stats (ouput rows, buffer gets, etc.) for each step in the plan
- It uses explain plans, so what you see may not be what Oracle did!
So while it’s useful for a quick finger in the air, there are better versions available.
Such as:
Autotrace in SQL Developer
This is a step up over the SQL*Plus version. It displays the stats for every step of the plan. So for each operation you can see metrics such as:
- How many buffer gets it used
- How long it took to run
- How many disk reads and writes it did
This makes it much easier to which points are consuming the most resources.
To see how to configure and run it, check out this video:
Besides the step-by-step breakdown, autotrace in SQL Developer has more advantages over SQL*Plus. These include:
- You can expand and collapse parts of the plan. This makes it much easier to see what’s going on
- You can compare execution plans. A fantastic tool when you’re trying to find the difference between two large plans.
This is a big step up over the SQL*Plus version. So from now on when I refer to autotrace I mean the SQL Developer version.
A quick word of warning. By default SQL Developer only fetches the number of rows according to the “SQL array fetch size” parameter. For queries that return a large number of rows this could miss a big chunk of the work. Ensure you set it to “Fetch all rows“.
Often when you’re tuning queries you want to save the plan for later reference or to share with others. To do this, right click the plan and you’ll get an option to “Export HTML”:
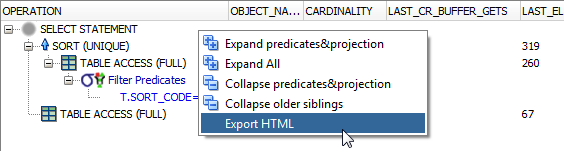
Save this and you’ll get a file like this:
|
||||||||||||||||||||||||||||||||||||||||||||||||||||||||||||||||


This all sounds great.
But there is one big drawback to autotrace: you have to wait for the query to finish!
If your SQL takes minutes or hours to complete waiting for this is a pain. It would be awesome if you could see query progress in real time.
Which brings us to the next method:
SQL Monitor
The SQL Monitor levels up autotrace. It provides similar operation-level stats. But with an added bonus. You can view the progress of execution plans in real time!
Got a troublesome full tablescan? You can watch while Oracle churns away at it. Instead of having to wait for the query to finish, you can see the plan immediately. This makes identifying bottlenecks easy.
Even better, unlike autotrace which you need to run manually, Oracle will capture the plan for you automatically.
So how do you view the plans?
They’re available in SQL Developer by going to Tools -> Monitor SQL…
Or you can view them in the Performance tab of Enterprise Manager:

Clicking on the SQL ID for your statement brings up the full details:
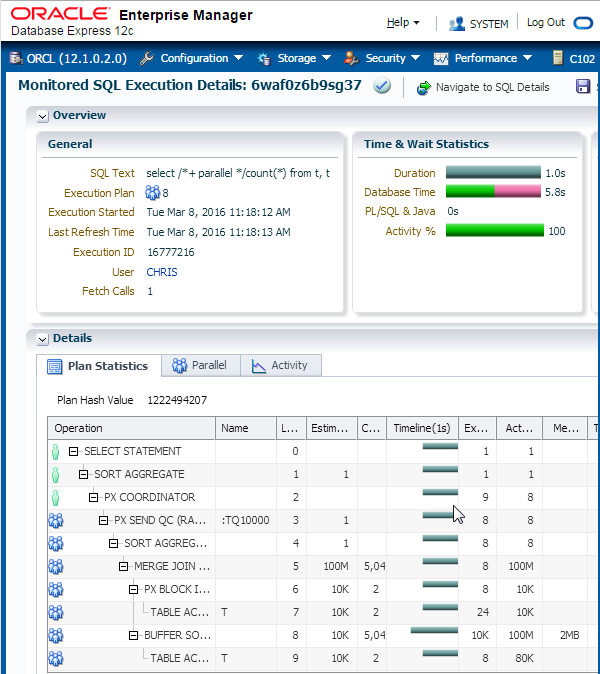
As with SQL Developer, you can expand and collapse the sections of your plan. For more details on reading these reports see this post on monitoring parallel execution.
For those of you who prefer text, you can output the plans using SQL. To do so, use the following query:
  select dbms_sqltune.report_sql_monitor(
            sql_id       => '4htx5uyx0gxxx',
            type         => 'TEXT',
            report_level => 'ALL'
         ) as report
  from   dual;
You’ll need to replace SQL ID parameter with the ID of your query. You can find this with the following statement:
  select sql_id, sql_text from v$sql
  where  sql_text like '%some text from your query%'
  and    sql_text not like '%not this%';
If there are many matches, check the SQL text to see which one is your statement.
Note SQL_text is limited to 1,000 characters. So for really large statements, you may need to include the SQL_fulltext column too!
If it’s so great, why isn’t this my favourite approach?
Well, there are a couple of caveats:
- Not all queries appear by default. Oracle only captures those lasting longer than five seconds or those running in parallel.
- You need to have Diagnostics and Tuning packs licenses to use it
The first limitation is easy to get around. One way to do this is by adding the monitor hint:
select /*+ monitor */… from …
For licensing you’ll need to speak to you local sales rep 😉
Assuming you are licensed, the SQL Monitor is a fantastic way to do early troubleshooting on those hour-long queries. Often you can spot which parts of the plan are doing the most damage within a few minutes. This enables early diagnosis. You can plan new approaches without waiting for the statement to finish!
Both of these methods are great. But they work on a single statement at a time. What if you want to analyze the performance of several pieces of SQL in a transaction?
Enter:
TKPROF
TKPROF is a command line utility that analyzes trace files and turns them into readable form. It gives you the execution stats for all the SQL in the file. Which begs the question:
How do I generate a trace file?
There are several methods. The easiest is to set SQL tracing on. The command to do this is:
alter session set sql_trace = true;
Oracle will capture all statements you execute after this in the trace file. To stop this, either disconnect or turn tracing off with:
alter session set sql_trace = false;
This method is easy but limited. For example, it only traces your session.
A more powerful method is to call DBMS_monitor.session_trace_enable. This has five parameters:
- Session_id
- Serial_num
- Waits
- Binds
- Plan_stat
Pass in the relevant session_id and serial_num to trace another session. If you leave these null, Oracle will trace your current session. Setting waits and binds to true includes information about these in the file.
To stop tracing, call DBMS_monitor.session_trace_disable. As with the enable procedure, pass the relevant session_id and serial_num. Or leave blank if tracing your current session.
So to generate a trace file for your current session, including waits and bind details, do the following:
exec DBMS_monitor.session_trace_enable ( null, null, true, true );
***your code here***
exec DBMS_monitor.session_trace_disable;
DBMS_monitor also includes procedures to trace all statements:
- Across the database
- For given clients
- Specific combinations of service name, module and action.
Note that tracing adds overhead. So avoid enabling it for the whole database. And remember to disable it when you’ve finished!
Once you’ve traced your code you need to get the file so you can analyze it.
How to get the trace file
“But where can I find the trace file?” I hear you ask.
It lives on the database server. This means you need access to it (or help from someone who does!). You also need to know where it is and what it’s called!
Connor explains how to find them in this video:
Getting the files can be fiddly, especially if you don’t have access to the server. You can get around this by configuring a file reader enabling you to query their contents (and thus save to your local machine).
With the trace file in hand you can parse it with TKPROF. The basic syntax for this is:
tkprof <trace_file_name> <output_file_name>
For example:
tkprof ORCL_ora_27883.trc trace.log
This parses the contents of ORCL_ora_27883.trc into trace.log. You’re now ready to start analyzing the queries!
Quick note: TKPROF also includes an explain option. This will show you explain, not execution plans. Use this with caution.
Compared to autotrace and the SQL Monitor this is a lot of work.
So you may be wondering: is this extra hassle worth it?
Well TKPROF has some of advantages over these:
- It includes all the SQL statements run between you starting and stopping tracing. This includes recursive SQL i.e. statements inside triggers, functions, etc.
- It breaks down the execution time into parse, execution and fetch times
The first benefit is great if you have a slow transaction that includes several statements. You can sort them in the output file from slowest to fastest. This helps you spot which is takes the longest. To do this, use the sort option:
tkprof <trace_file_name> <output_file_name> sort=prsela,exeela,fchela
This is particularly useful for spotting fast queries that you execute many times. This could be because you’re doing row-by-row processing. Or you have a SQL statement with many calls PL/SQL which itself calls SQL (something you should generally avoid). Or trigger logic you weren’t aware of. Though, as Jonathan Lewis notes in the comments, be aware that a SQL statement could have a different plan for each exection. TKPROF will only report one of these.
The parse, execution and fetch breakdown helps you spot issues unrelated to the plan itself. For example, in an overloaded system parse times can be higher. If a significant fraction of a statement’s runtime is parsing then you should start looking for issues other than the plan itself.
So TKPROF enables you to see information not visible in the previous two tools. Sometimes the extra hassle is worth it!
DBMS_XPlan

The final method we’ll look at uses the package DBMS_XPlan. This includes several display functions. These are pipelined, so you can query these like normal tables using the table() operator.
Using these, you can get the performance stats for each step of the plan: actual rows, time taken, etc.
To see this information, you need to increase Oracle’s stats level. You can do this by:
- Setting statistics_level to all in the session (or database!) using:
alter session set statistics_level = all;
- Adding the /*+ gather_plan_statistics */ hint to your query
Once you’ve done one of these and run the statement to completion you can get your plan!
Call display_cursor to get the plan immediately after executing your SQL (taking care to ensure you’ve set serveroutput off):
select * from table(dbms_xplan.display_cursor);
This fetches the plan for the last statement in your session. This is good but misses many of the juicy details. To include these, use the format parameter. This enables you to include or exclude parts of the plan. Some of my favourite options are:
- ALLSTATS – Shorthand for IOSTATS MEMSTATS. This includes details such as how many rows and consistent gets each step used.
- LAST – Only display the stats for the last execution. Otherwise this default to giving you the information for every execution.
- PARTITION – Include the Pstart and Pstop columns. This tells you which partitions Oracle accessed. Only needed if you’re querying partitioned tables!
- PARALLEL – Again, only relevant for parallel statements!
- NOTE – includes the note section. This provides extra information, such as whether Oracle used features like dynamic statistics, adaptive plans, etc.
If you want to exclude parts of the plan, just prefix the format with the minus sign ‘-‘.
You can also use this to get the plans for previous statements. You just need to find the SQL ID and pass it in:
select * from table(dbms_xplan.display_cursor('sql_id', null, 'ALLSTATS LAST'));
The plan must still be in the cursor cache to use this. Head to LiveSQL for an example of how to do this. If you’re using the Automatic Workload Repository, you can get older plans using display_AWR:
select * from table(dbms_xplan.display_awr('sql_id', null, null, 'ALLSTATS LAST'));
This is all well and good. But the output is static text. You can’t expand and collapse the plan like you can in SQL Developer. This can make large plans tricky to read.
So why would you choose this over SQL Developer?
An obvious answer is because this is part of a scripted process. You need pure SQL for these!
Another is if you want to post the plan somewhere (*cough* Ask Tom *cough*) to get help tuning help from others. The simple text format makes it great for sharing.
Summary
We’ve looked at four methods of creating execution plans.
These all come with their own pros and cons. In the end which you use is largely a matter of personal taste.
For short running queries, the ability to expand, collapse and compare execution plans makes autotrace in SQL Developer the winner for me. For longer queries – where licensed – I’d go for the SQL monitor.
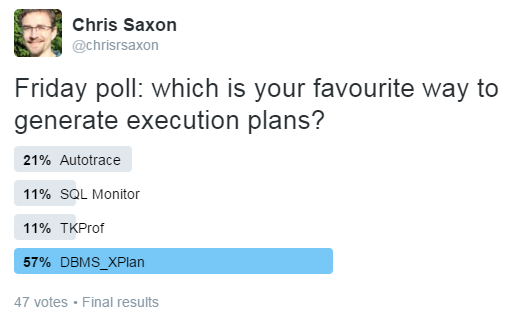
But according to my recent Twitter poll, DBMS_XPlan is the most popular in my followers:
There are many other ways to generate Oracle execution plans. Notably SQLTXPLAIN. This is a powerful tool that also includes lots of supporting details, such as the current table statistics. This is most useful if need help from other people (e.g. support!). This ensures they have all the information they need to diagnose the problem.
The most important thing is to ensure that you are getting execution plans, not explain plans. If the output is missing details such as actual rows and time taken then there’s a good chance you’ve got the wrong type. At the very least, you’re missing vital information to help you tune your SQL.
How about you? Which do you like best? Are there any other tools you use I haven’t mentioned? I’ve heard there are tools from other vendors for creating execution plan tools too 😉 Do any of these have significant benefits?
Let us know in the comments!
Learn more about SQL Performance Tuning in Databases for Developers: Performance
UPDATED: 19 July 2017: added Jonathan Lewis’ comment about multiple plans, link to LiveSQL demo for DBMS_XPlan and fixed some formatting
UPDATED: 25 Apr 2019: updating code formatting
UPDATED: 27 Jul 2020: adding Databases for Developers link