To calculate the running total for a column you can use analytic functions, aka window functions. The basic syntax is:
sum ( col ) over ( order by sort_col rows unbounded preceding )
So to get the cumulative sum of employee salaries, in the order they were hired use:
So how does this work?
overchangessumfrom an aggregate function to a window function. This means you still see all the individual rowsorder bysorts the rows byhire_daterows unbounded precedingis the window frame. This frame includes all the previous rows and the current in the total. It’s shorthand forrows between unbounded preceding and current row
You can use this method to get running totals for other aggregates (count, avg, etc.) on any expression. You can also change which rows to include in the total.
Read on to learn how to:
- Get the running total up the previous row
- Calculate moving averages
- Get running totals per group
- Cheat sheet for calculating running totals
But first, what happens if you exclude the frame?
Running totals with no frame
You may have noticed that you can omit the window frame:
sum ( col ) over ( order by sort_col )
Do this for the cumulative salaries query above and you get:
Notice that the running total is the same for rows two to five!
To see why this happens, watch this 60-second explainer:
The point here is when you use order by in window functions there is always a frame (in functions that support it!).
If you omit the frame it defaults to
range unbounded preceding
Notice the change from rows to range. Using range defines the frame in terms of the values it includes. There are three ways you can define which data to include in the frame:
rows– a number of rowsrange– a range of valuesgroups– a number of values (added in Oracle Database 21c)
Both range and groups include all other rows with the same value for the sorting columns. So when sorting on non-unique expressions many rows can have the same cumulative sum.
For example:
Usually, you want running totals to change for every row. While the rows method at the start of the post guarantees this, it’s non-deterministic when sorting on non-unique values. This means the same query on the same data could return different results!
You’re most likely to notice this non-determinism when either:
- You have many window functions with different sorts.
- The final
order byfor the query is different to those in the functions
These two queries are the same except for the sort at the end. This means that the fourth row in each has different values:
At best this is confusing. At worst it could lead to bugs. To avoid this include unique values (such as the table’s primary key) in the order by.
So far the calculations include the current row in the total. What if you want the running total of only the previous rows?
Get the cumulative sum up to the previous row with SQL
To get the running total of all rows up to – but not including – the current, you could subtract the row’s value. But this brings needless addition and subtraction operations.
Another way is to change the calculation to stop at the previous row. Do this like so:
rows between unbounded preceding and 1 preceding
This includes all rows from the start of the data set to the one immediately before the current. You can also define the window using range or groups.
This query shows the running total of salaries of people hired before each employee for each mode:
Note that the total for the first row is null in all cases. This is because there’s no previous value – the window is empty!
The different modes change the meaning of 1 preceding and the rows it includes:
rows between unbounded preceding and 1 preceding=> stop at the row immediately before the currentrange between unbounded preceding and 1 preceding=> stop one day before thehire_dateof the current row. Exclude any rows within one day of the currenthire_date.groups between unbounded preceding and 1 preceding=> stop at the previous value forhire_date. Exclude any rows with the same value forhire_dateas the current row.
Rows two to five have the same hire_date. So the groups and range frames for these rows only include the first row in their running totals. To make every row’s running total stop at the previous row, either use:
- the
rowsframe - the
groupsframe with the primary key at the end of the sort to ensure all values are unique
You can’t use a multicolumn sort and value offsets with range. You can only have more than one column in the window for range if its boundaries are unbounded or current row.
Other than this limitation, the difference between range and groups may be unclear. Changing the frame to a sliding window makes this obvious.

Calculate moving averages with SQL
So far all calculations start at the first row in the data set. Sometimes you may want the frame to “move” with the data, aka a sliding window. For example, to get the three-day moving average.
You can get the moving average with a window like:
<frame_mode> between 1 preceding and 1 following
This includes data on either side of the current row. Again, exactly which rows depend on the frame units:
rows=> the previous, current, and next rows onlyrange=> all rows that fall betweensort_val – 1 <= current_sort_val <= sort_val + 1groups=> the previous, current, and next distinct values for the sort columns
The window can be any size. For example, this includes rows five units before and two after the current:
<frame_mode> between 5 preceding and 2 following
The SQL query below calculates the moving average of employee salaries for each frame mode. It also counts how many rows were included in this calculation:
The window clause was added in Oracle Database 21c. This enables you to define a window once and reuse it in the query.
Now the number of rows in each window is different.
Using rows, the window is limited to at most three rows. So to use it to calculate three-day averages, you need to ensure there can be at most one row per day. For example, by grouping the data first.
With range, the total includes the days on either side of the current. The first employee was hired on 13th Jan 2001. The three-day average is calculated over the dates 12th-14th Jan 2001.
But groups include all the rows for the previous and next dates people were hired – however far in the past or future! So the three-day average for the first employee includes the four people hired on 7th Jun 2001.
This difference between range and groups is important if there can be gaps in the data. For example, if your business closes at the weekend and thus receives no orders on these days. Check whether you want to cover calendar days (range) or trading days (groups).
So far all examples assume you want the cumulative sum across all rows in the results. But what if you want to split the data and get separate sums for each? For example, total salaries per department.
Get the running total per group using SQL (over partition by)
Besides the overall cumulative sum, you might want to get running totals within a group. For example, cumulative salaries per department.
To do this add the partition by clause before the sort, like so:
You can still use all the windowing clauses above after the order by. So you can get cumulative sums, moving averages, etc. for each group.
You can also omit order by and use partition by on its own. If you do this gives the overall total for each group.
To see how partition by works, here’s another 60-second explainer:
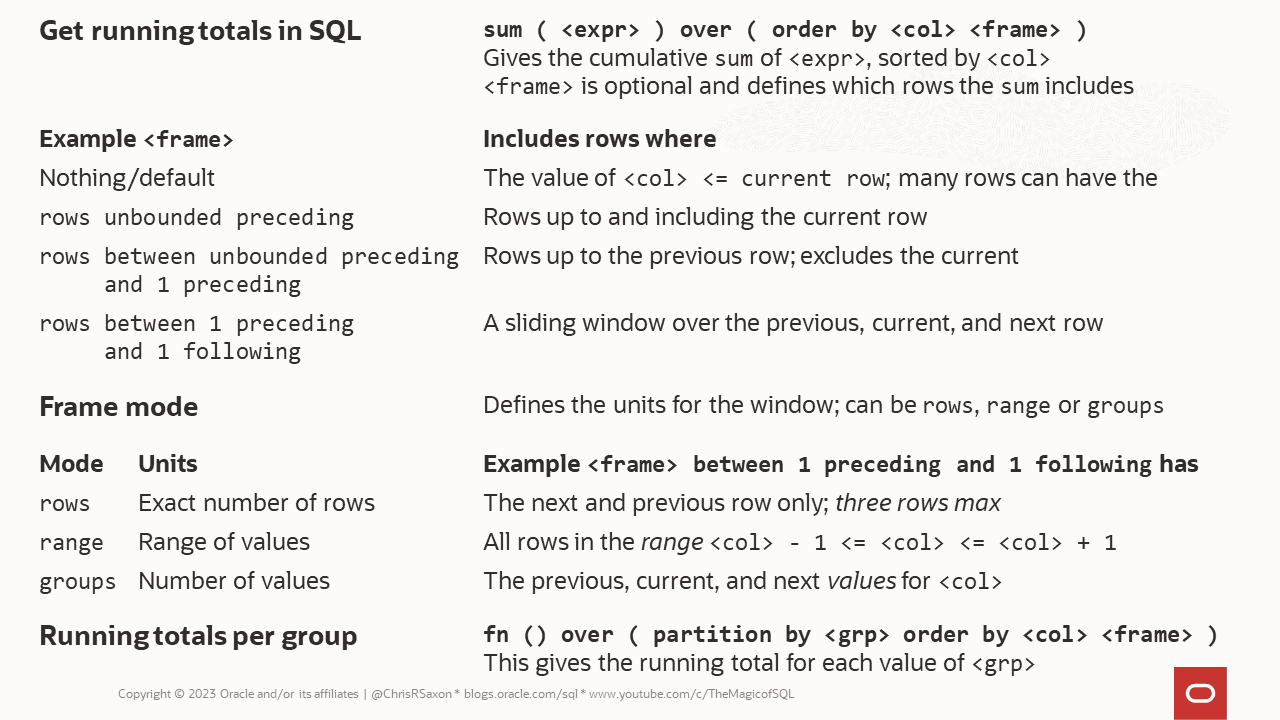
Running totals in SQL cheat sheet
Here’s a cheat sheet recapping ways to calculate running totals in SQL
Want to learn more about window functions? Take our free class Analytic SQL for Developers from Connor McDonald.
To learn more about new SQL features in Oracle Database, head to:
- 21c New Features tutorial on Live Labs
- Free Oracle Database 21c quizzes on Oracle Dev Gym.