The book the 4 Disciplines of Execution: Achieving Your Wildest Goals written by Chris McChesney, Sean Covey, and Jim Huling is one of my favorite leadership books. Per the publisher, the 4 Disciplines of Execution (4DX) is “a simple, relatable, and proven formula for executing your most important strategic priorities in the midst of the whirlwind”. For me, it validated and clarified so much of my own experiences in organizational transformation.
One of the four disciplines is to “keep a compelling scoreboard”. The premise is that people are motivated when they know if they are “winning” or not. The authors use an anecdote of a high school football game where the scoreboard goes out, and the fans are unable to see the score throughout the game. The energy in the stands is noticeably muted. Though play on the field continued as usual, the enthusiasm and engagement from those watching was not there. The authors use that anecdote to assert that in every strategic endeavor we need to see the score to know if we are winning or not. When we know what winning looks like for a strategic goal and we have ready access to a scoreboard that displays our progress toward the goal, we are much more likely to succeed.
I have written before about my time playing basketball. That experience of playing shaped me in innumerable ways. One way is my own clarity for my need to know what “winning” looks like. The anecdote of the football game without the scoreboard hit me in a somewhat visceral way. I could see images in my mind of the scoreboards in the various gyms in which I played. I could remember examples from games and practices where I looked desperately to the score to see either the current points, the number of fouls committed by either team, or the minutes left in the period. I can remember the feeling of determination to keep giving it my all, or the elation of knowing we had the game in the bag. The premise of 4DX resonated so deeply with me because I had felt the impact of knowing what winning looked like in some situations and conversely experiencing the discomfort of not knowing in other contexts.
People tend to gravitate towards the easy to measure when talking about success. And why not? Numbers associated with sales of licenses, dollars in revenue, units of waste in production are excellent data points for understanding how well a business is doing. Building dashboards to display these measures of organizational strength and performance are, as the authors of 4DX say, not only helpful for leaders who are responsible for steering the strategic direction but for those working every day to produce those numbers. Those numbers validate that the effort is worth it. Those numbers validate that strategic choices were correct and that future outcomes are promising.
But what are the metrics of digital adoption? The easiest answers to produce (in fact the ones we use for demonstrating our value to the market) are measures such as software value realization, reduction in help desk tickets, reduction in time to develop, deliver, and maintain training materials, etc. These are quantifiable. These make excellent scoreboards for leaders to assess the correctness of the strategic choice to embrace digital transformation.
Still, are those all the metrics that matter when leaning into the work of digital adoption? People will say that qualitative aspects of change are always hard to measure. “Engagement”, “buy-in”, “confidence”, “trust” are the metrics for which we do not have tidy dashboards. Tools meant to measure these things, such as surveys and focus groups, are good but they have limitations. And these tools can be difficult to deploy, synthesize, and analyze. So where does that leave us when we see the value of the scoreboard, but capturing the data to display is either prohibitively difficult or not at all possible?
For someone like me who gravitates toward the qualitative, people-centric data, Oracle Guided Learning is an excellent solution for a digital adoption scoreboard. Not only is OGL content simple and fast to deploy, the Analytics dashboards provide insight into the hard-to-measure degrees of success of your digital transformation efforts. Below are some ways you can measure “winning” with your OGL content:
- Consumption trends over time. When deploying OGL, the smart organizations play for the whole season, not just the first game. When you are thinking about digital adoption, you can tell if your strategy is focused too heavily on go-live to the detriment of every-day points of need for your users. Your dashboard for that can be measures of daily consumption over time
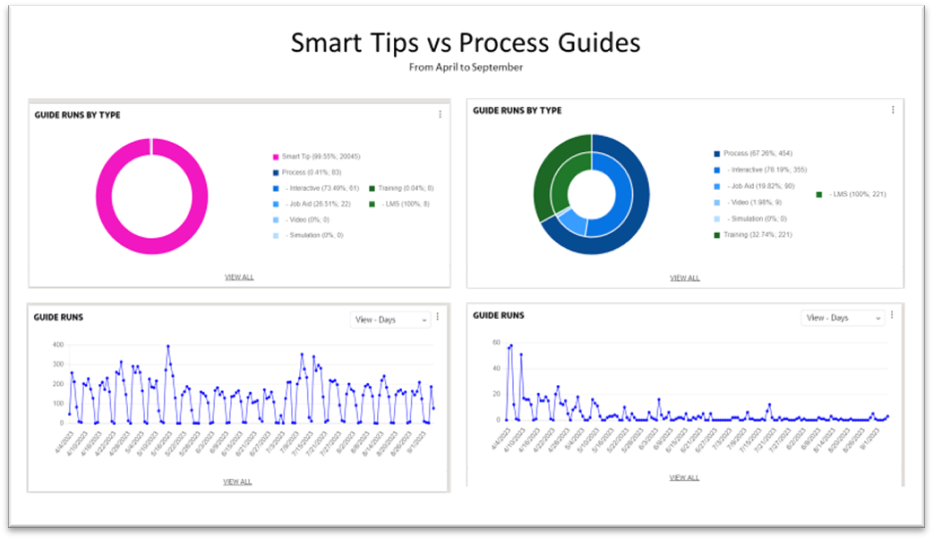
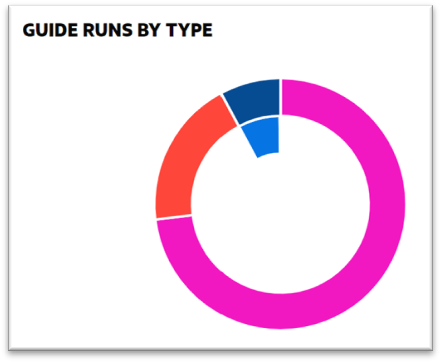
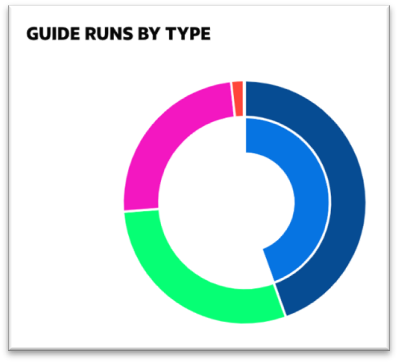
- Distribution of content types. The mark of a great conversation is a noticeable balance between talking and listening. When you see a robust distribution of content types, you can see an organization thoughtfully engaging their users in two-way communication using OGL. Some content types are like a helpful coach giving guidance (process guides, smart tips, messages). While some content types are like the chatter on the pitch amongst the players (surveys, hot spots, guide feedback).
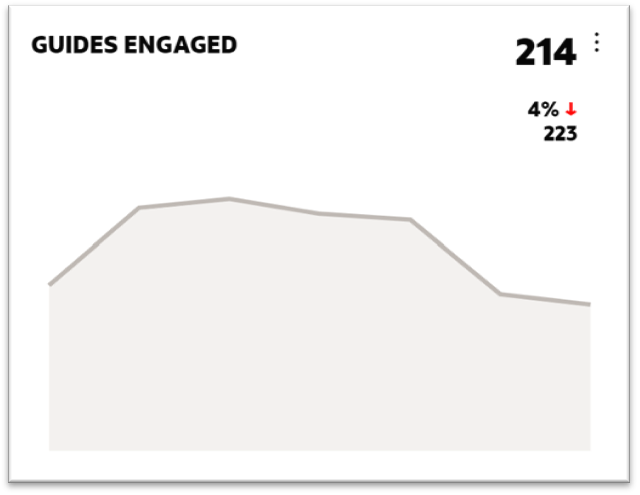
- Percentage of content consumed by users. While certainly some content will be deployed for particular events that might only occur one time a year (annual performance evaluations), there is so much opportunity to support users every day in ways that boost productivity. A good scoreboard for whether your content is meeting users where they need it is the percentage of content items with which users are interacting. This indicates you have thoughtfully deployed content items based on what you are hearing users need.
What it looks like to be winning will be determined by your strategic goals. OGL not only helps you achieve your strategic goals for digital transformation, but it helps you see the scoreboard in the midst of the all the action.