Stack Monitoring continues to rapidly release support for new resource types and new features. With this release, Stack Monitoring has released support for Service Oriented Architecture (SOA) and Oracle Cloud Infrastructure (OCI) Tags. Stack Monitoring makes monitoring your SOA application quick and simple.
Monitoring an SOA-based application environment is particularly challenging due to the number of components involved and their relationships. Application administrators often lack a complete picture of the application and have trouble pinpointing the root causes of issues. Stack Monitoring solves these problems by:
- Automatically discovering all SOA applications deployed on a Weblogic domain
- Automatically discovering SOA components and the underlying stack
- Providing out-of-the-box metrics and homepages where insight about health and performance can be easily viewed
- Providing easy drill-downs and cross-stack troubleshooting of issues
Discovering SOA and its underlying tech stack
Discovering a SOA application and its underlying tech stack is easy. The first step in monitoring an SOA application is to promote the underlying hosts to full monitoring. Promoting a host to full monitoring provides additional metrics (e.g. file ysystem monitoring) and finer-grained metric collection than comes standard with an OCI Compute Instance. With the SOA application hosts now being monitored, the next step is discovering the SOA application and its WebLogic servers. Stack Monitoring will automatically discover the SOA application when performing a WebLogic Domain discovery. In environments where WebLogic is already monitored by Stack Monitoring, complete the steps to Refresh a WebLogic Domain. From the discovery UI, select WebLogic Domain from the list of supported resources. Simply fill in the required blanks such as hostname, administrator server port, and username and password. Organizing and assigning resources to an infrastructure environment is easy with Stack Monitoring. With all the discovery fields completed, select Show advanced options, to assign the appropriate tag(s).
Oracle provides several tags out-of-the-box, alternatively, custom tags may be created to fit the needs of your organization. Associating this SOA application to a Prod environment is easy. Begin by selecting “Oracle-Standard” from the Tag namespace. With the namespace defined, the list of available tag keys is populated, choose Environment. Next, select Prod from the list of available environment tags. Finally, select Discover New Resource to submit the discovery job.
Once the discovery job has been completed, Stack Monitoring immediately begins collecting metrics on the SOA application, WebLogic Cluster, and WebLogic servers. With the SOA metrics now being collected, Stack Monitoring makes creating alarms for these resources easy, with a set of alarm best practices. In addition to the metric collection, Stack Monitoring will create the topology between these discovered resources. Stack Monitoring’s topology can be used to quickly identify and then navigate to the WebLogic domain associated with the SOA application.
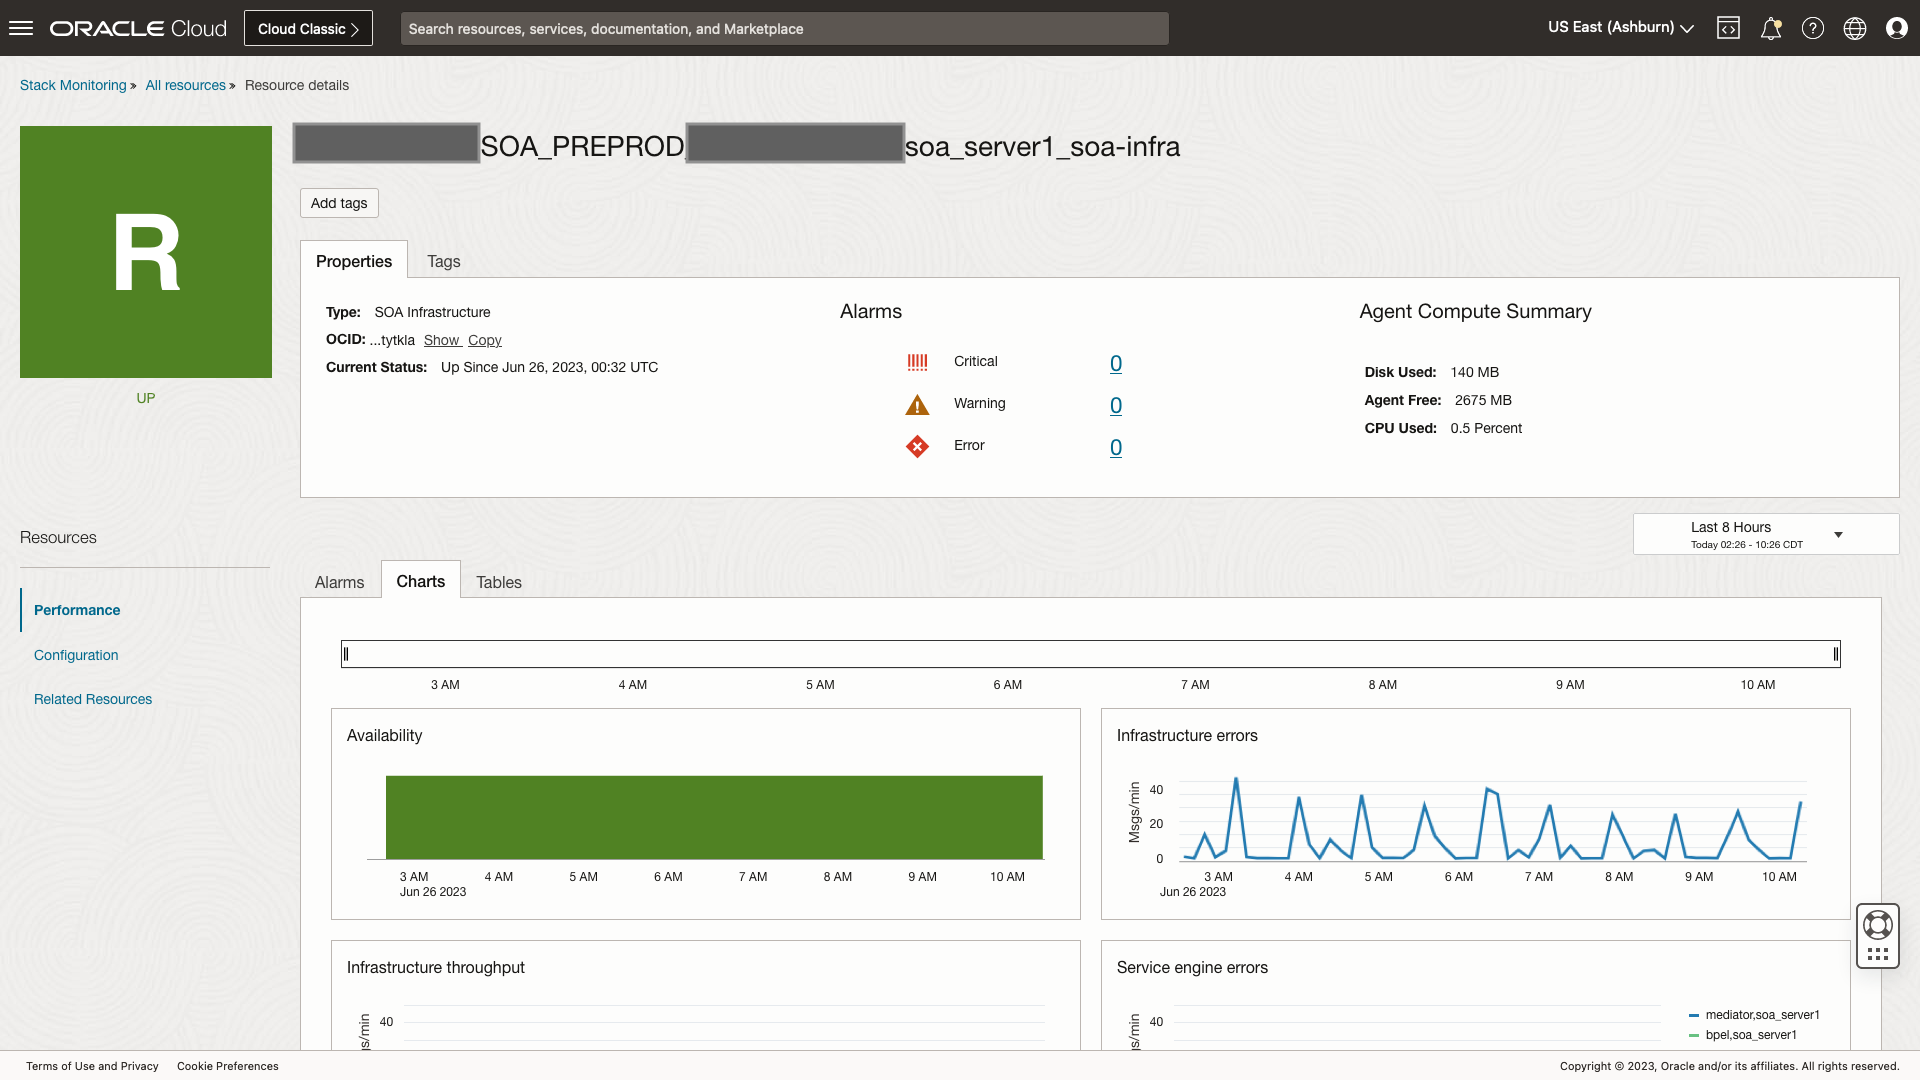
Homepages provide insight into the health and performance of the SOA Application
Stack Monitoring homepages provide critical information for understanding the performance and availability of the SOA application. Begin by easily identifying any open alarms or availability issues within the SOA application.
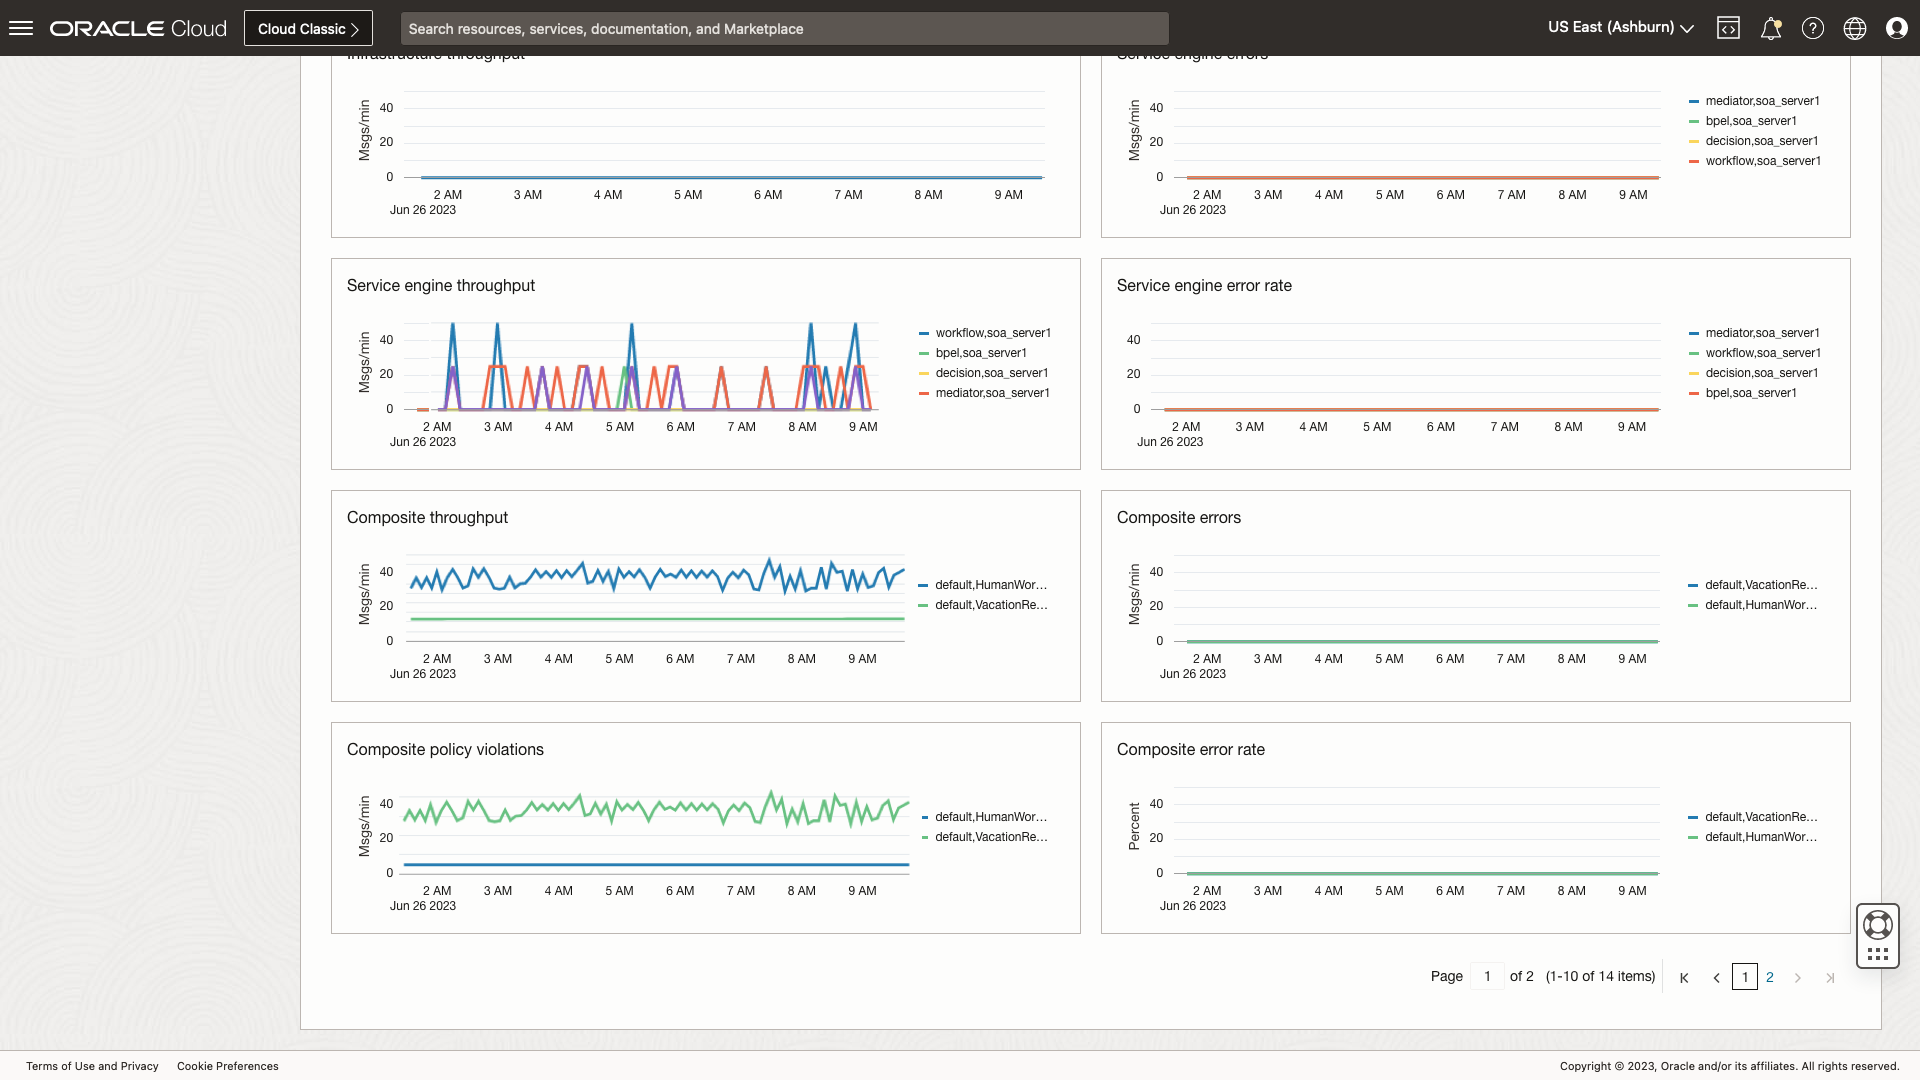
Should there be an area of concern, leverage the out-of-the-box performance charts such as composite sync / aysnc response time, to identify if SOA is taking longer than expected to process transactions. Or leverage the Composite / Service Engine error rates to determine if SOA transactions are producing errors. Figure 3 reports that while the message rates appear consistent, SOA is not generating any errors, this allows the user to rule out errors as contributing to any performance issue.
When troubleshooting application performance problems many times the issue may be related to the underlying tech stack. Identifying the related WebLogic server is easy using Stack Monitoring’s topology. Simply navigate to the Related Resources tab and select the WebLogic Server to investigate the performance and availability of the WebLogic Server.
OCI Tags make finding your resources easy
Applying a tag to a parent resource, such as a WebLogic Domain, will propagate the tag to all the child resources using the Stack Monitoring topology. This propagation occurs when applying a tag either through the Stack Monitoring homepage or during a resource discovery. For instance, in the example above, when the Prod tag was applied to the WebLogic Domain during the discovery, the WebLogic Domain, WebLogic Cluster, WebLogic Servers, and the SOA application will be assigned the same Prod tag.
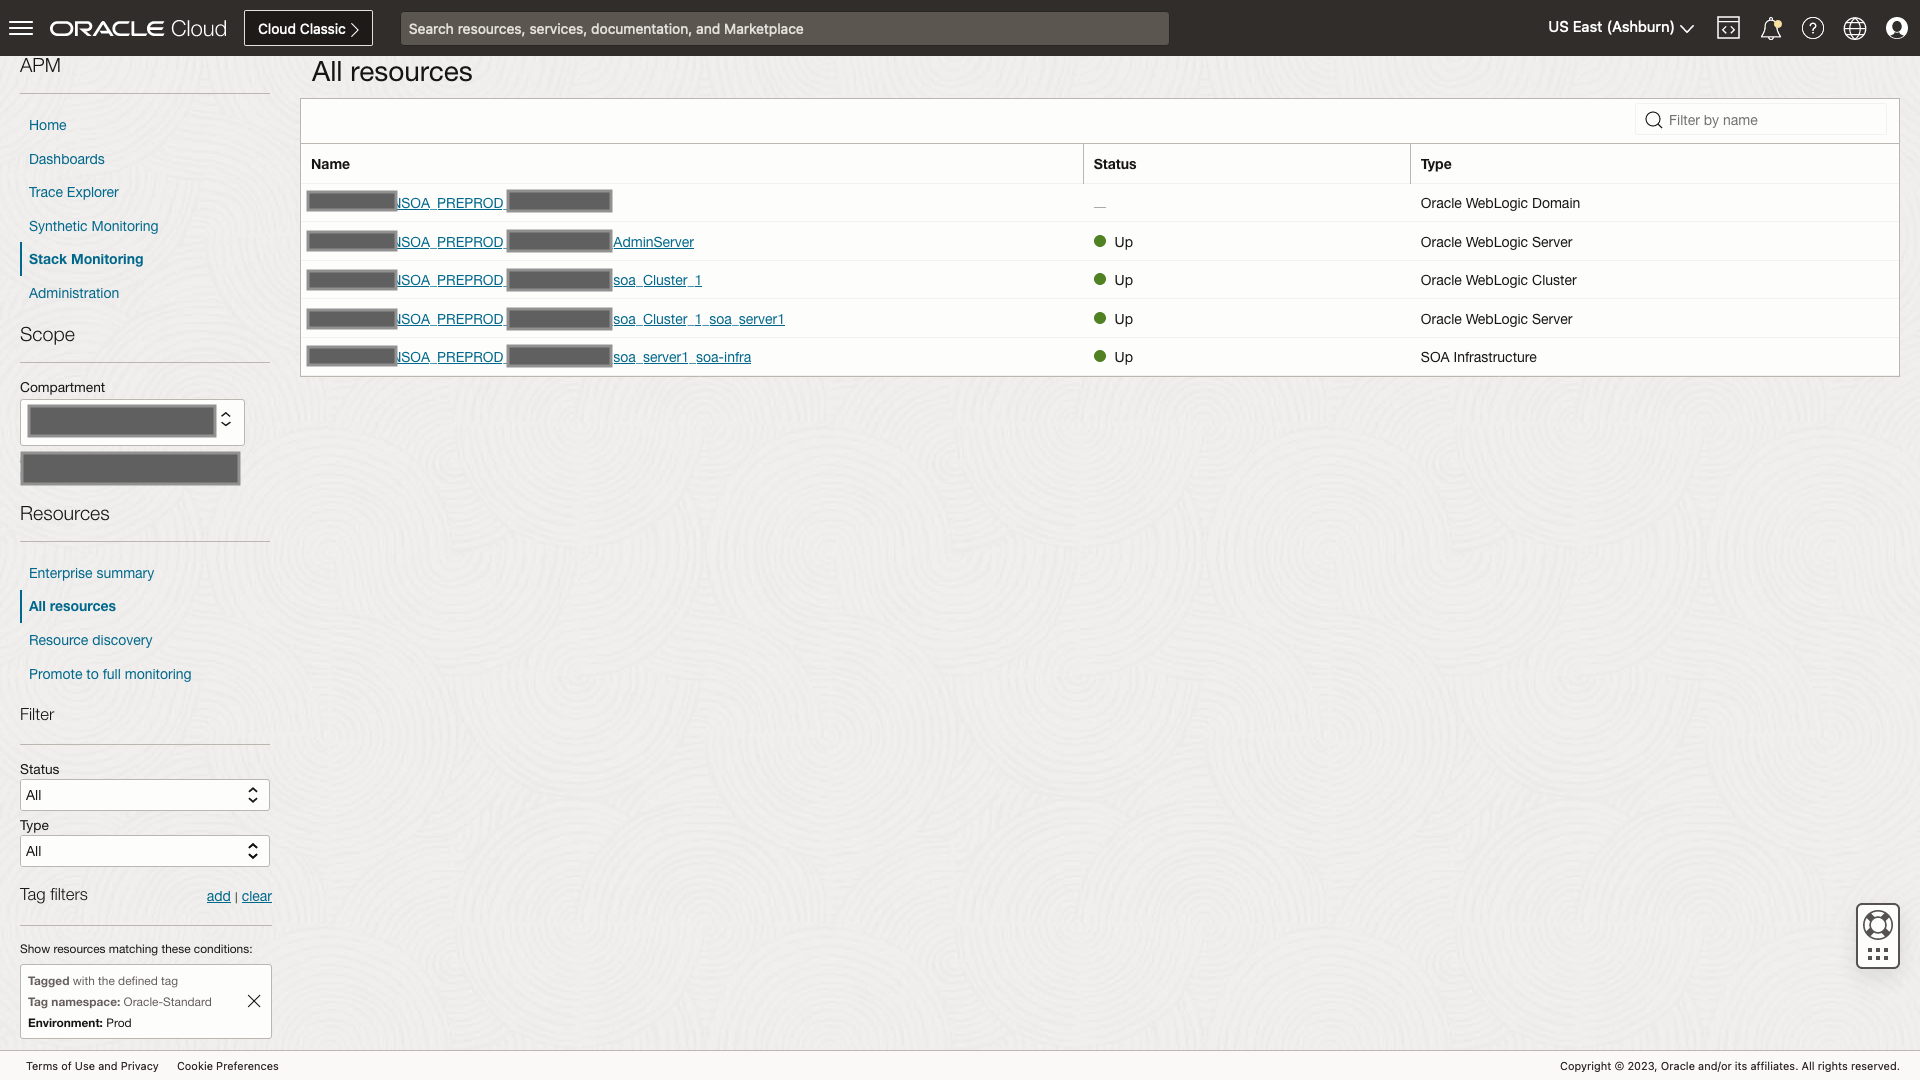
An example of how OCI Tags can be useful, from the Stack Monitoring All Resources page, apply the tag filter of Prod. Stack Monitoring will only show those resources designated as Prod, and filter out all others, for example, Sandbox or Testing.
Stack Monitoring provides quick time to value with an easy UI-driven discovery of SOA and its related tech stack, resource homepages, and out-of-the-box metrics. Stack Monitoring’s auto-discovered topology provides easy navigation up and down the application stack as well as makes applying OCI Tags simple. To get started monitoring your SOA application including its WebLogic Domain and servers see our documentation.
Happy Monitoring!
Getting Started with Stack Monitoring