I have some exciting news to share with you on our observability and management solutions. Please join me live January 25, 2023 at 9 AM PT/12 PM ET as I share an update on the most important innovations we have delivered recently. During this livestream event, I will demonstrate the new capabilities and answer your questions live with my team of architects, developers, and product managers.
We’ll provide examples on why Oracle should be considered as a strategic partner in your application, infrastructure management, and observability strategy.
Then, I will cover the key capabilities added to the platform, and finally what others are saying about our solution. I hope you enjoy this blog.
Why you should care about observability
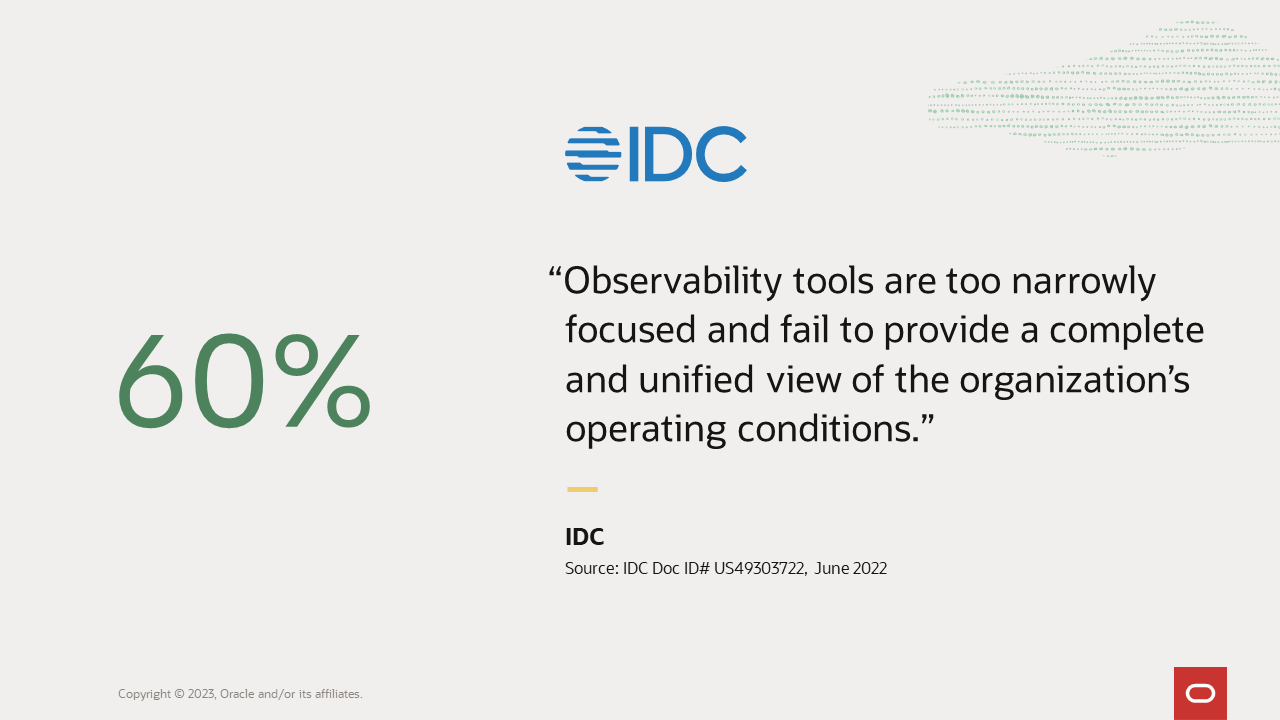
Most IT operations teams use more than a dozen monitoring and management tools because a single tool or tool suite doesn’t meet all their hybrid and multicloud requirements. In order to bridge this gap, many of these organizations write custom monitoring scripts that are maintained in-house. This approach was manageable for a very long time because application architectures changed infrequently. One could deploy a monitoring framework and get away with occasional updates to support changes in IT environment. This approach no longer works effectively as more and more applications are built on cloud-native technologies such as microservices and Kubernetes. The increase in the number of tools and added labor in maintaining custom scripts has created unmanageable complexity for IT operations and DevOps teams. If you are resorting to blocking application rollouts or even worse, putting up with monitoring tools that don’t fully support a new or updated application that’s going live, it is a matter of time before a disaster happens. You could be facing security breaches, frustrated users, or a slowdown of business activity. Here is what IDC says about this problem.
Why you should consider Oracle a strategic partner
Oracle is an applications, platform, and infrastructure provider and our technologies have been supporting business-critical applications for many years. We have supported customer data centers for over 40 years, managing our own hosting environments before Oracle Cloud existed, and now growing the Oracle Cloud to more than 40 data centers, dedicated regions, and Cloud@Customer in 60+ countries. Now with so many customers using a mix of these deployment choices, we remain vested in helping our customers ensure the best results for their Oracle investments no matter where their applications and infrastructure are deployed.
When it comes to observability and management, we have several advantages when compared with the conventional approach:
- We have extensive hands-on experience in DevOps for modern enterprise apps at cloud scale. Oracle operates the software industry’s largest SaaS portfolio of enterprise applications, and we have a deep appreciation of all the observability and management challenges since we have dealt with them directly for many years. In contrast, other conventional technologies, and cloud providers (AWS, Azure, and GCP) have limited experience with enterprise-grade application delivery and management.
- Oracle is a leading provider of the entire tech stack from OS to the database, middle-tier, applications, and hardware. As a result, we have deep knowledge of every layer of the software stack and know exactly what it takes to instrument, troubleshoot, and optimize each software component. We have rationalized the metrics and the data model for the collection of the telemetry. That eliminates the problem of overlapping point products that don’t integrate together collecting redundant metrics, impacting performance, and costing you more CPU, storage, and resources to run and maintain.
- This gives us a unique advantage in observability and management as the aim of these solutions is to build instrumentation that enables easy and accurate troubleshooting and optimization. In contrast, no other technology company provides the same breadth of software and hardware products as Oracle.
- We have deep experience in both on-premises and cloud software. We understand the differences in delivery models for cloud and on-premises software and understand how to provide seamless management that spans cloud, SaaS, and on-premises deployments. In comparison, cloud-native providers e.g., AWS or GCP have little expertise when it comes to on-premises technologies.
- Lastly, observability use cases are all about data mining and analytics. We are a leader in data management. We manage the most important and largest data sets of enterprises. Our observability and management solutions are beneficiaries of this leadership. We provide integrated data ingest and analysis with out-of-the-box insights. Our solutions incorporate curated machine learning algorithms designed for IT operations use cases. This makes us different from pure-play or specialized observability providers (Splunk, SumoLogic, Datadog, NewRelic, or AppDynamics) who leave this kind of data management to IT teams, often leading to challenges including the need for hard-to-find experts, added time and effort, and significant data storage and management costs.
The key pillars of Oracle’s innovation announcement
Since the introduction of the Oracle Cloud Observability and Management Platform in October 2020, we have been busy adding critical capabilities to the platform. We have over 150 patents relating to application management, we have added over 500 new high-impact features, and we have added over 4,700 customers. Figure 2 shows the breadth of capabilities we are investing in, and the list continues to grow.
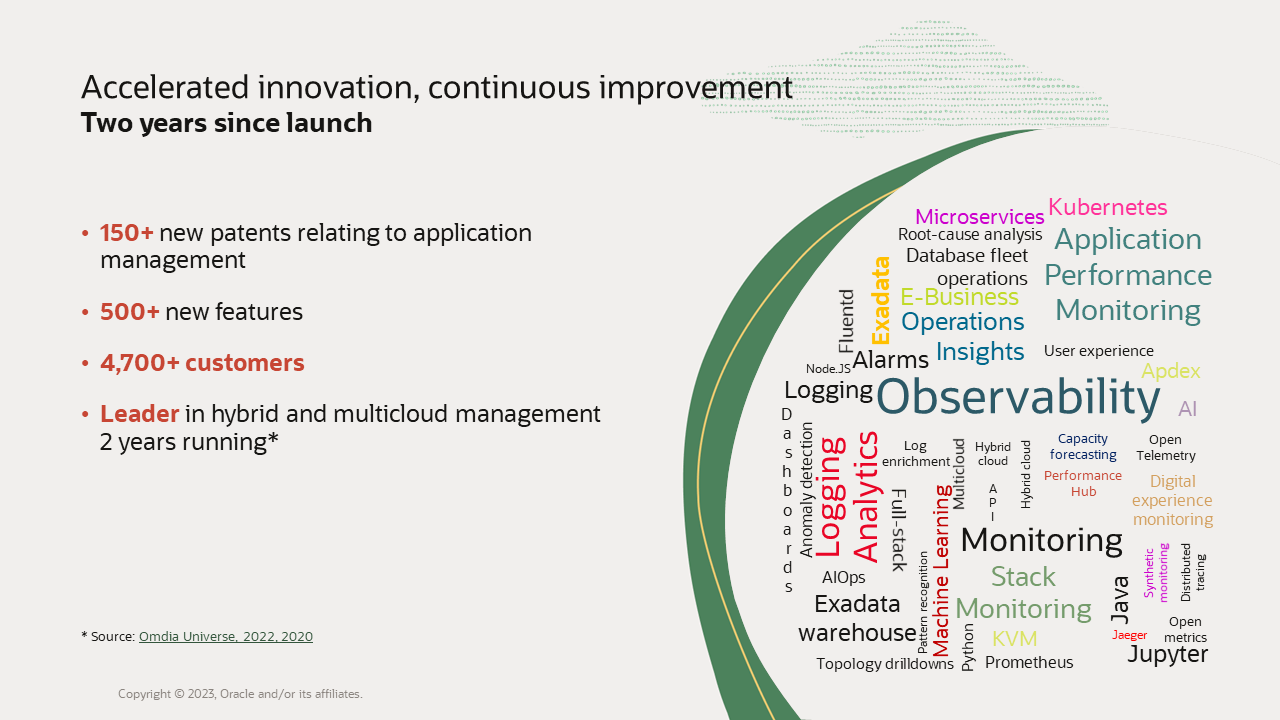
While we are investing in a broad range of technologies, the overall theme of our efforts is focused on three major areas:
- End-to-end application observability
- Improving efficiency for AI Operations
- Expanded database management
Let’s review each category.
End-to-end application observability
As I mentioned earlier, Oracle has a long history of developing enterprise applications and managing them on behalf of our customers. We have a deep appreciation for the need to maintain the health of legacy applications even as new applications are developed using cloud-native technologies. For this reason, we have projects that focus on capabilities for bespoke applications (such as those built on top of Oracle Database and MySQL), Oracle Packaged Applications, Oracle partner applications, as well as new cloud-native applications. Let’s review two important categories of cloud-native applications and Oracle Packaged Applications.
Cloud-native applications
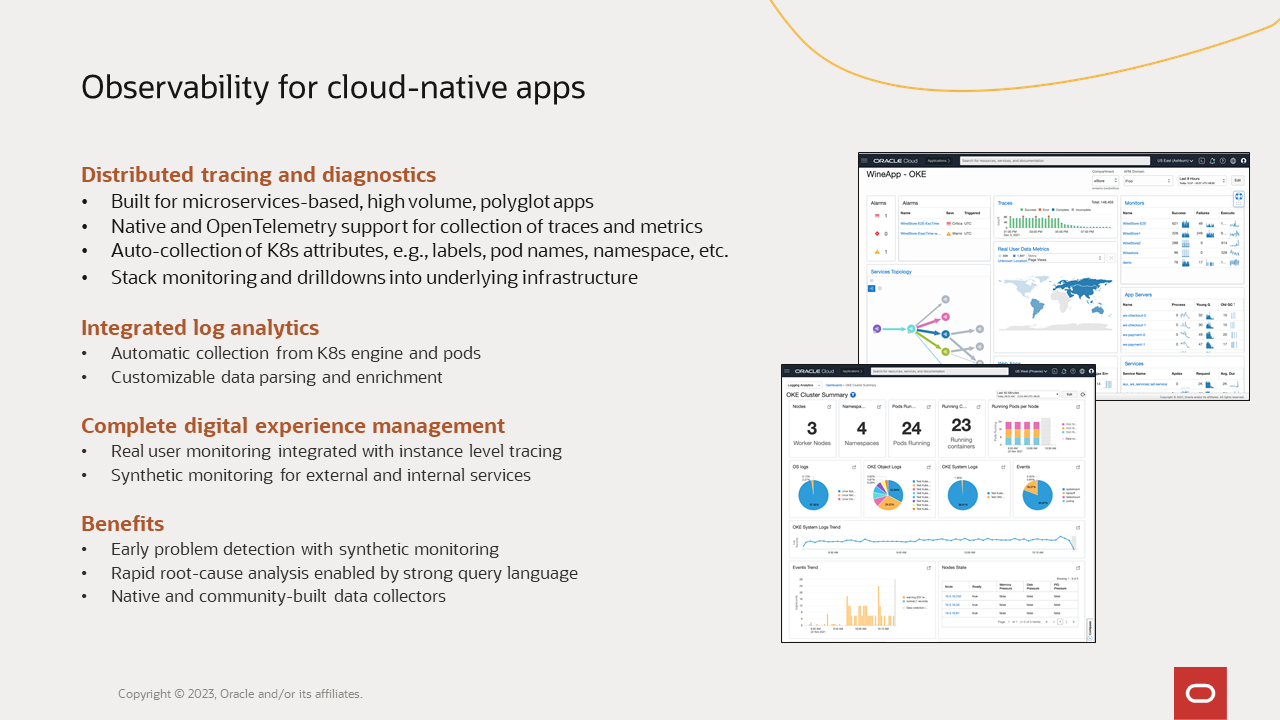
We built our observability and management platform from the ground up on modern cloud-native technologies. What this enables, is the monitoring of a variety of technologies and programming languages deployed in containers, managed by Kubernetes. Since the first release two years ago, we have added native support for the OpenTelemetry protocol, supporting both tracing and monitoring exporters. With integrated log analytics, we provide visibility into applications, the Kubernetes platform, and the underlying infrastructure for faster root-cause analysis, and monitoring with out-of-the-box dashboards. Kubernetes attributes and labels are automatically collected with traces, metrics, and logs, for more accurate alerting and richer dashboards.
Out-of-the-box log parsers and configurable data enrichment of logs and traces enable analysis and visualization of business and application KPIs. Browser activity, correlated with backend microservices tracing, provides rich real-user monitoring and reduces mean-time-to-recovery with instance-level transaction tracing.
The Oracle Cloud Infrastructure (OCI) compute environment includes our agent, so this provides zero-configuration infrastructure monitoring. Together with synthetic monitors, we provide reliable, complete, and accurate availability tracking, ensuring the monitored app meets its SLA.
So with the combination of end-user monitoring, synthetic monitoring, stack monitoring, and log analytics, you can quickly detect problems, do rapid root-cause analysis, and perform more advanced custom diagnostics using the strong query language we support.
Oracle Packaged Applications
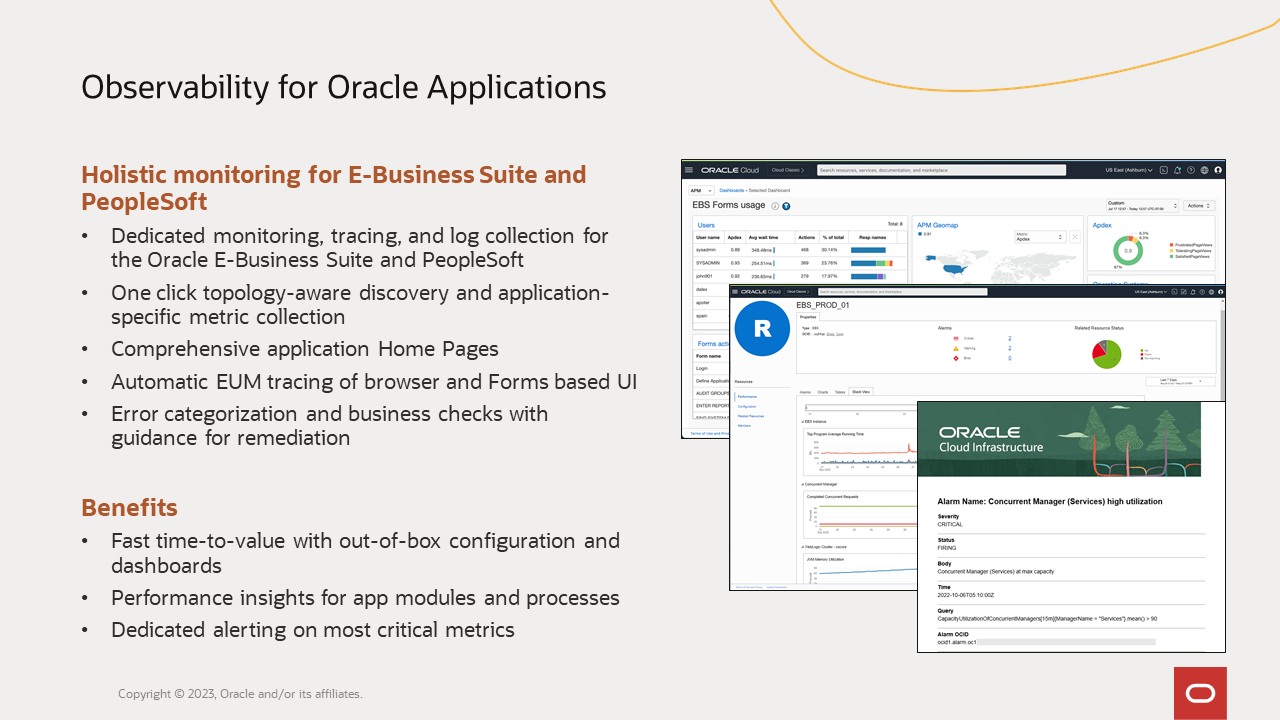
Oracle provides holistic monitoring for Oracle Applications such as E-Business Suite and PeopleSoft. With one click, you can discover all components of E-Business Suite and PeopleSoft, and automatically create the application topology along with the dependent WebLogic Servers and Oracle Database stack components. After discovery, a curated set of application metrics and logs are immediately collected for monitoring, troubleshooting, and visualizations through homepages and dashboards. Data collectors can be configured for application specific automatic instrumentation, enabling end-user monitoring across browsers and Oracle Forms-based UI.
We have application-specific home pages for monitoring the status, performance, and alarms across all components. Leveraging the application topology, you can troubleshoot performance issues across the stack by correlating the performance of the application with its underlying WebLogic Servers, Oracle Database, and host, with easy navigation to their respective home pages. Alarms can be configured to alert on outages, slow performance issues, and errors.
End-user monitoring for the browser and Forms-based UI provides insight into application hotspots, high-resource consumers, and performance anomalies. Instance-level end-to-end tracing enables quick resolution for problems ranging from client configuration to slow SQLs.
Extensive error categorization and over 300 business checks help ensure the functional health of E-Business Suite and PeopleSoft along with specific guidance from Oracle on how to fix those issues.
Application-specific dashboards provide a unified view of user experience, metrics, logs, and alarms across all application components. Business and IT managers can monitor the high-level KPIs, while DevOps engineers can drill down into data to troubleshoot.
Improving efficiency for AI Operations
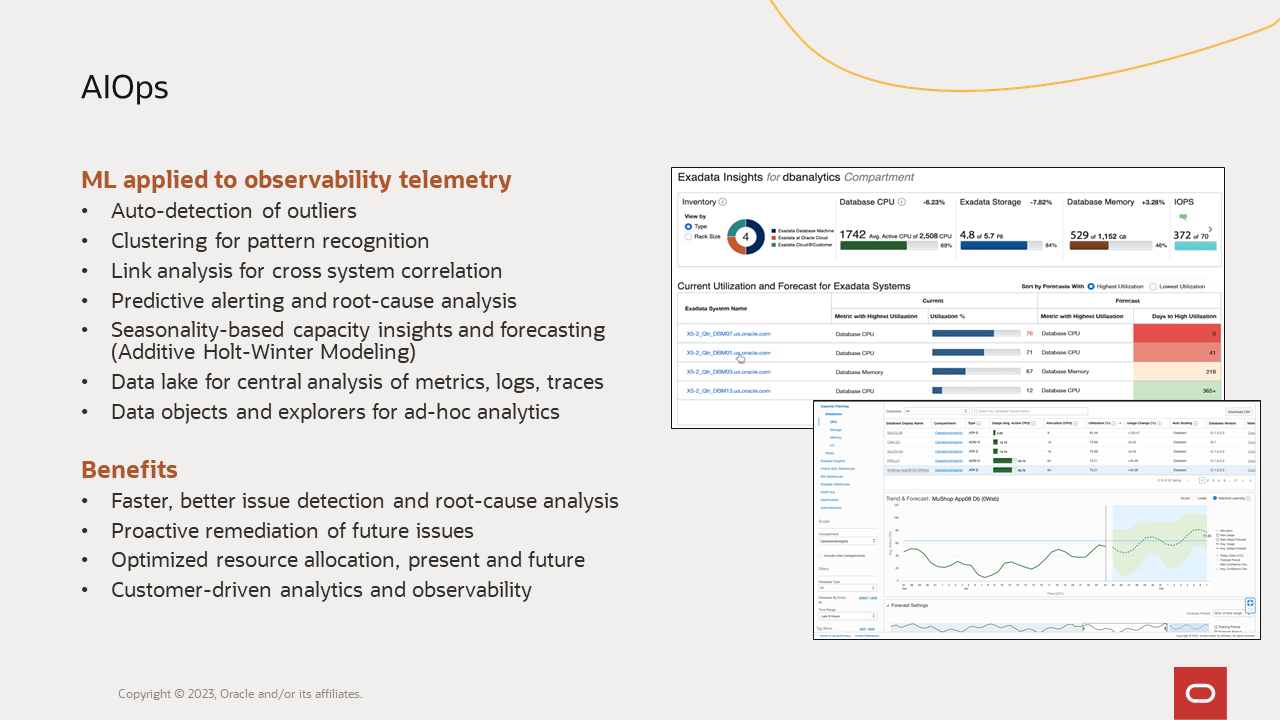
I mentioned earlier that observability use cases are all about analyzing data to provide timely and actionable insights and help avoid emergencies. This is only possible if you collect your monitoring data whether it be logs, metrics, or traces, in one place and then apply machine learning to your entire data set. Assuming you know a few things about machine learning algorithms for your specific use cases, you can get incredible intelligence about your environment. If you are a Splunk user, you know the challenges of maintaining large volumes of data and then trying to extract intelligence from it. We don’t expect our users to be analytics experts or have tons of storage and compute power lying around for this kind of analytics. We securely bring all your data to OCI where our data lake can store limitless volumes of your data for long periods at a highly economical cost. We then use curated machine learning to analyze the data and identify meaningful patterns that provide insights to support proactive responses which include:
- Detection of anomalies and outliers
- Using clustering algorithms for pattern recognition to detect incidents, their leading indicators, or probable root causes
- Link analysis for correlating metrics or logs across different components such as storage and database or follow a transaction ID across all the logs in an application stack
- Optimize resource utilization by detecting workload seasonality using Additive Holt Winter Modeling and can forecast non-linear, seasonal workloads
- Support creating a data lake of metrics, logs, and traces for doing custom analytics using your analytic tool of choice
- If you are a DBA and SQL is your language of choice for analytics, we provide data objects and data explorers for SQL-based analysis.
With our AIOps capabilities, you can consume metrics, logs, and traces in real time and apply machine learning on historical data for predictive capabilities and react faster to changing requirements.
Expanded database management capabilities
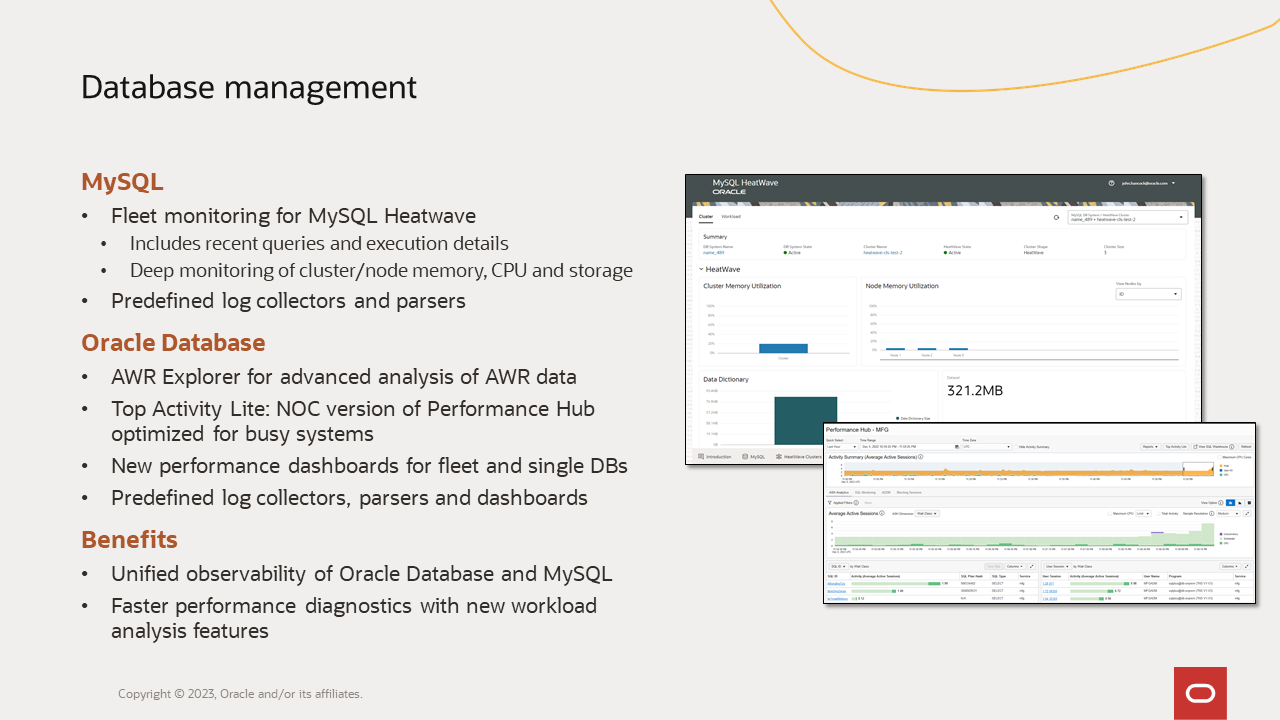
We have a very high bar when it comes to observability for your data management environment. I am hoping we will impress and aid all you DBAs out there being asked to manage more! In the area of database management, we now support MySQL Heatwave. You can monitor your MySQL fleet, look at recent queries that ran in the system and drill-down in their execution details as needed. We provide deep monitoring of cluster memory, node memory, CPU, and storage.
We also have predefined log collectors and parsers for MySQL, and our Logging Analytics service fully supports ingestion and analysis of MySQL logs.
For Oracle Database we now have AWR Explorer, an interactive visualization tool for analyzing AWR data for expert DBAs. Top Activity Lite feature, a Network Operations Center (NOC) version of Performance Hub is a capability you can use as a NOC tool in your data center to monitor your critical databases. It is optimized for quick response under heavy loads and provides the right level performance information for analysis of Oracle Databases.
We continue to add predefined log collectors, parsers, and dashboards for both MySQL and Oracle Databases.
This was a quick rundown of our key new innovations. More importantly, I would like to share what others are saying about our efforts from industry analyst leaders to customers and partners who are using our solutions.
Validation of Oracle’s solution
Leading Industry Analysts
Roy Illsley of Omdia Research has developed Omdia Universe for Hybrid and Multicloud Management, a comprehensive framework for evaluating hybrid and multicloud management solutions. My team has participated in Roy’s research since 2020 when we first introduced our solution. I’m delighted to share that Oracle has been ranked a leader in this Omdia Universe. You can read all about it in the latest report.
We have also been working with Holger Mueller of Constellation Research. Holger talks about the importance of eliminating data silos, having the ability to combine multiple components that are traditionally provided by different vendors.
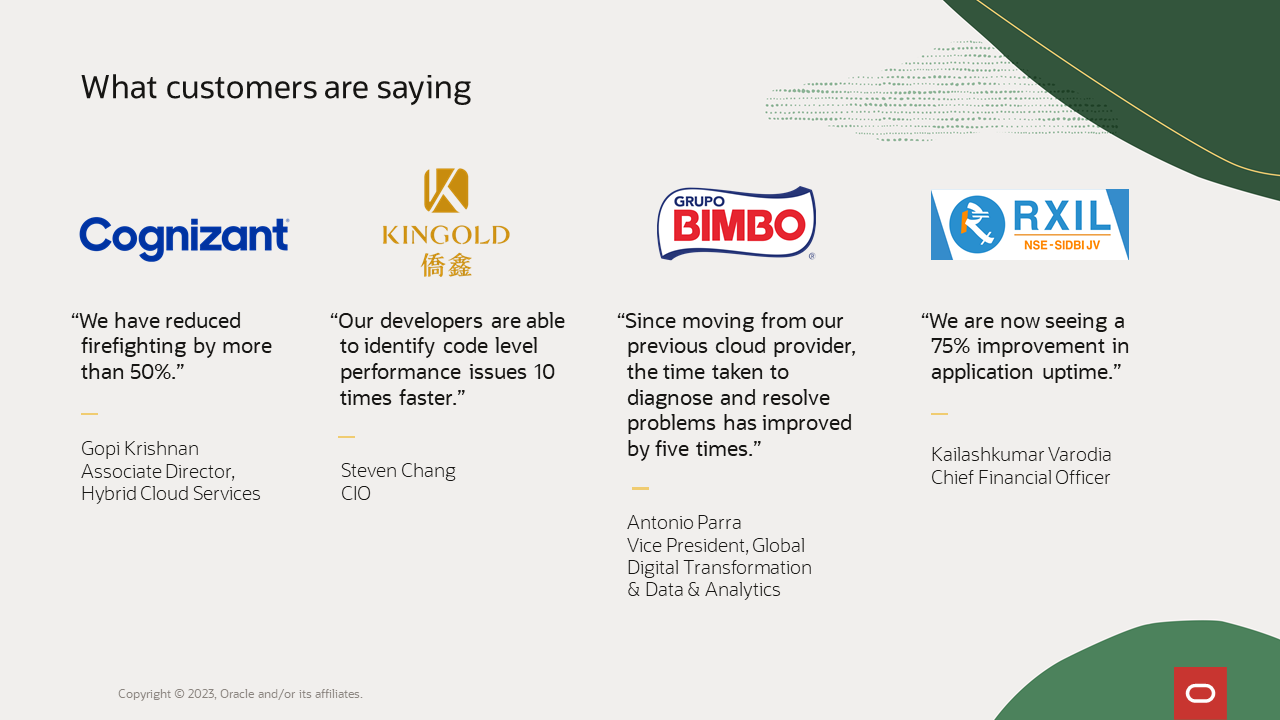
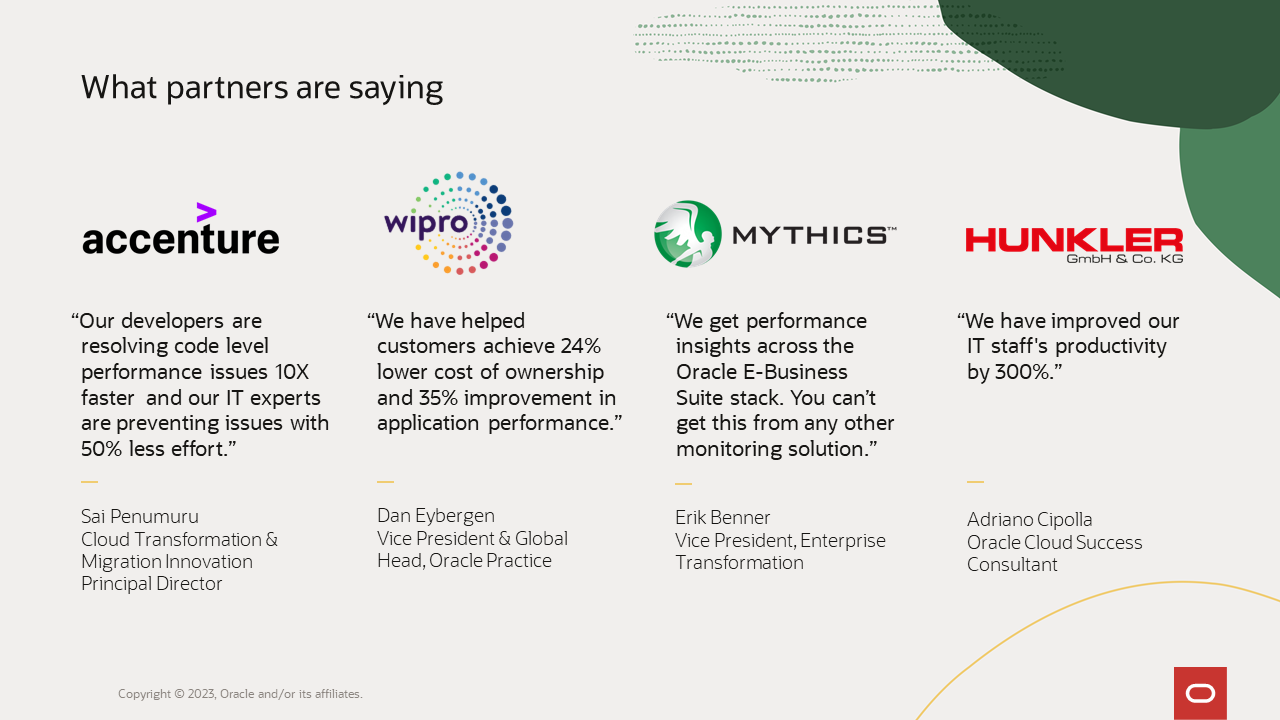
What customers and partners are saying
Oracle customers and partners across a broad range of industries including financial services, telecommunications, higher education, healthcare, retail, public sector, high tech, and manufacturing are using our solutions to improve application availability, increase customer satisfaction, and reduce costs. Below is a sampling of our customers and partners and what they have been able to achieve with our solutions.