Oracle Cloud Infrastructure (OCI) and services provide effective and manageable security that enables you to run mission-critical workloads and store your data with confidence. To achieve cloud security operational excellence, it is crucial to continuously monitor and improve the security posture of our customers’ OCI tenancy and adopt essential cyber hygiene practices. For our customers navigating the dynamic cloud security landscape without a dedicated Security Information and Event Management (SIEM) system, the Security Fundamentals Dashboards are set to support our customers in building and maintaining strong security observability and governance around the OCI cloud resources so that our customers can stay vigilant in an ever-evolving cyber landscape. The Security Fundamentals Dashboards proactively aggregate and analyze OCI logs related to security events by leveraging the advanced capabilities of OCI Logging Analytics, coupled with near real-time monitoring and alerting allows security operations teams to detect security risks faster, focus on the key information based upon the tuning of the systems, and take appropriate actions to mitigate the risks.
OCI Security Fundamentals Dashboard Artifacts
The first release of the Security Fundamentals Dashboards contains the following three dashboards:
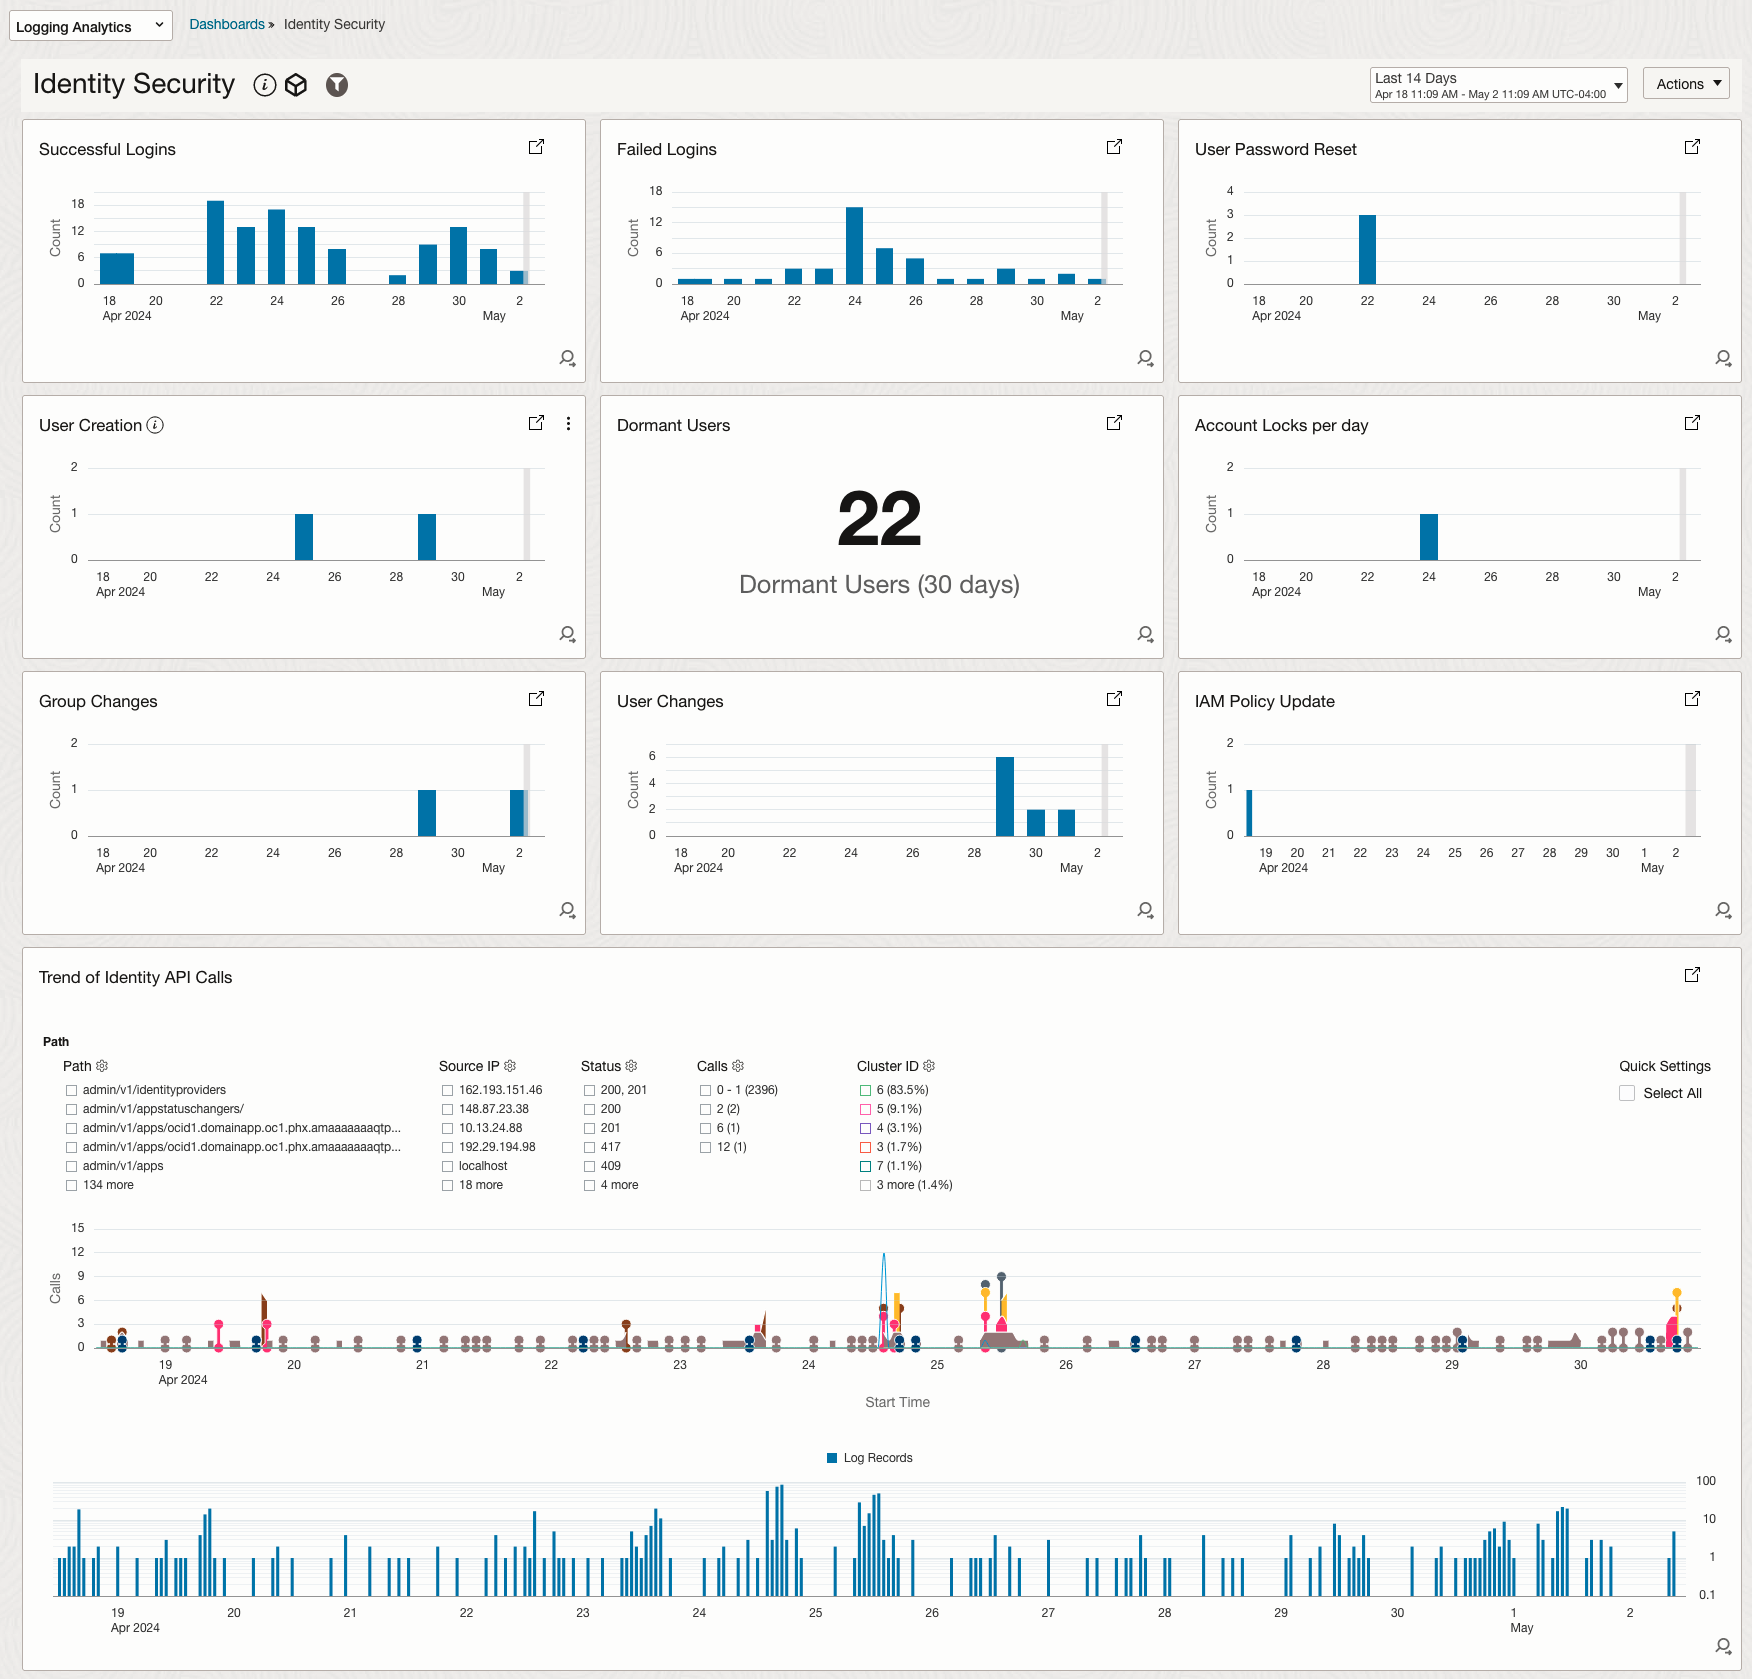
- Identity Security Dashboard
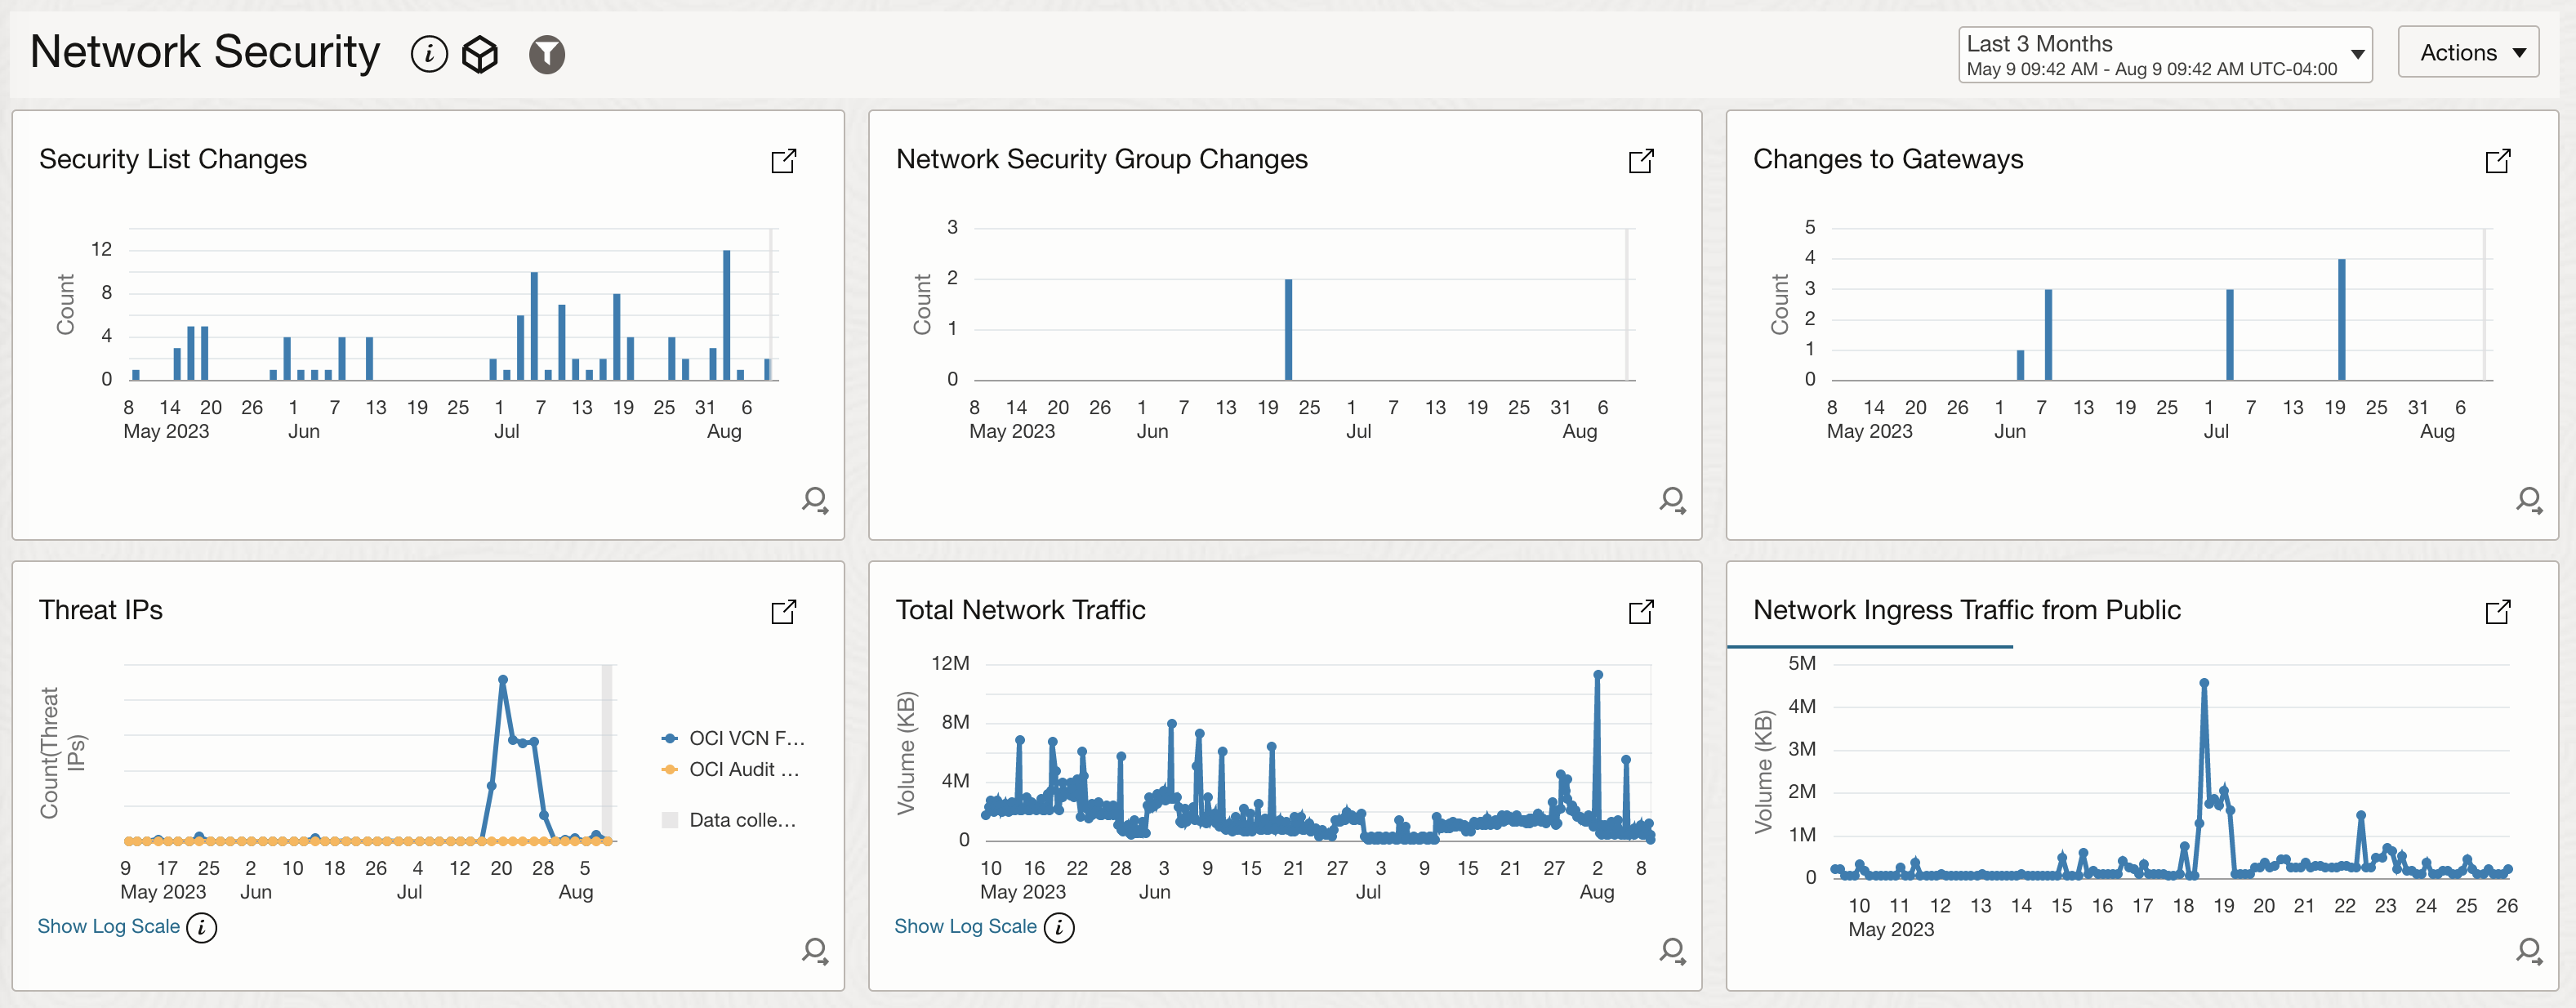
- Network Security Dashboard
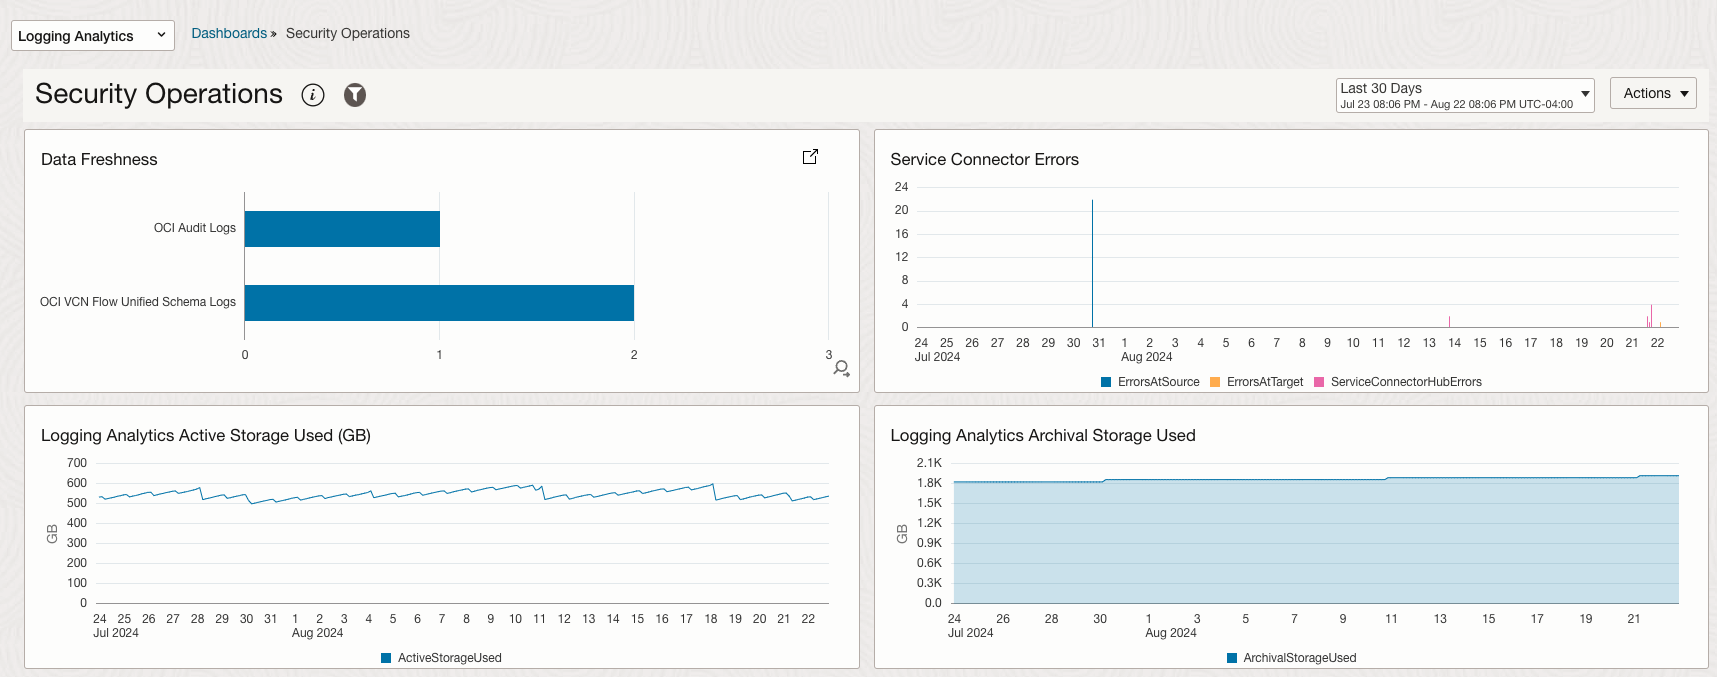
- Security Operations Dashboard
The code is available here and is provided as a sample code for reference. The sample code can be customized for additional enhancements.
OCI Security Fundamentals Dashboard Details
- Out-of-box dashboards for rapid security threat detection
- Designed for customers interested in observing critical security events in their tenancies
- Dashboards are based on Oracle security analytics and monitoring best practices
- The dashboards query data from the OCI native Audit and VCN Flow Logs for continuous Identity and Network security events monitoring
- Meets the Maturity Acceleration Program-Foundation (MAP-F) capabilities related to Logging Monitoring and Alerting and provides visibility into key security metrics
- Observability and Management Logging Analytics is the main service for the solution
- Consumption is based on the size and retention of the underlying logs
Note: OCI Maturity Acceleration Program-Foundation (MAP-F) is a collaborative customer engagement that seeks to help organizations in building, deploying, and maintaining their foundational security capabilities, to support secure operations in OCI.
Security Fundamentals Dashboards Widgets:
| Category |
Widgets |
Description |
| IAM |
Local User Password reset |
Bar Chart showing the count of successful Local Password resets aggregated over 1 day. |
| IAM |
Local User Creation |
Bar Chart showing the count of successful or unsuccessful Local User creations aggregated over 1 day. |
| IAM |
Local User Changes |
Bar Chart showing the count of successful or unsuccessful Local User changes aggregated over 1 day. This includes Deactivate User, Delete User, Update User, Update User Capabilities, Update User State, Update User Password via UI |
| IAM |
Local Dormant Users |
Tile showing the count of dormant users that haven’t successfully logged in to the OCI console within the last 30 days |
| IAM |
Local Group Changes |
Bar Chart showing count of successful or unsuccessful Local group changes aggregated over 1 day. This includes “Add user to group” and “Remove user from group” |
| IAM |
IAM Policy Update |
Bar Chart showing the count of successful or unsuccessful IAM policy changes across the tenancy aggregated over 1 day. This includes Create Policy, Update Policy, and Delete Policy. |
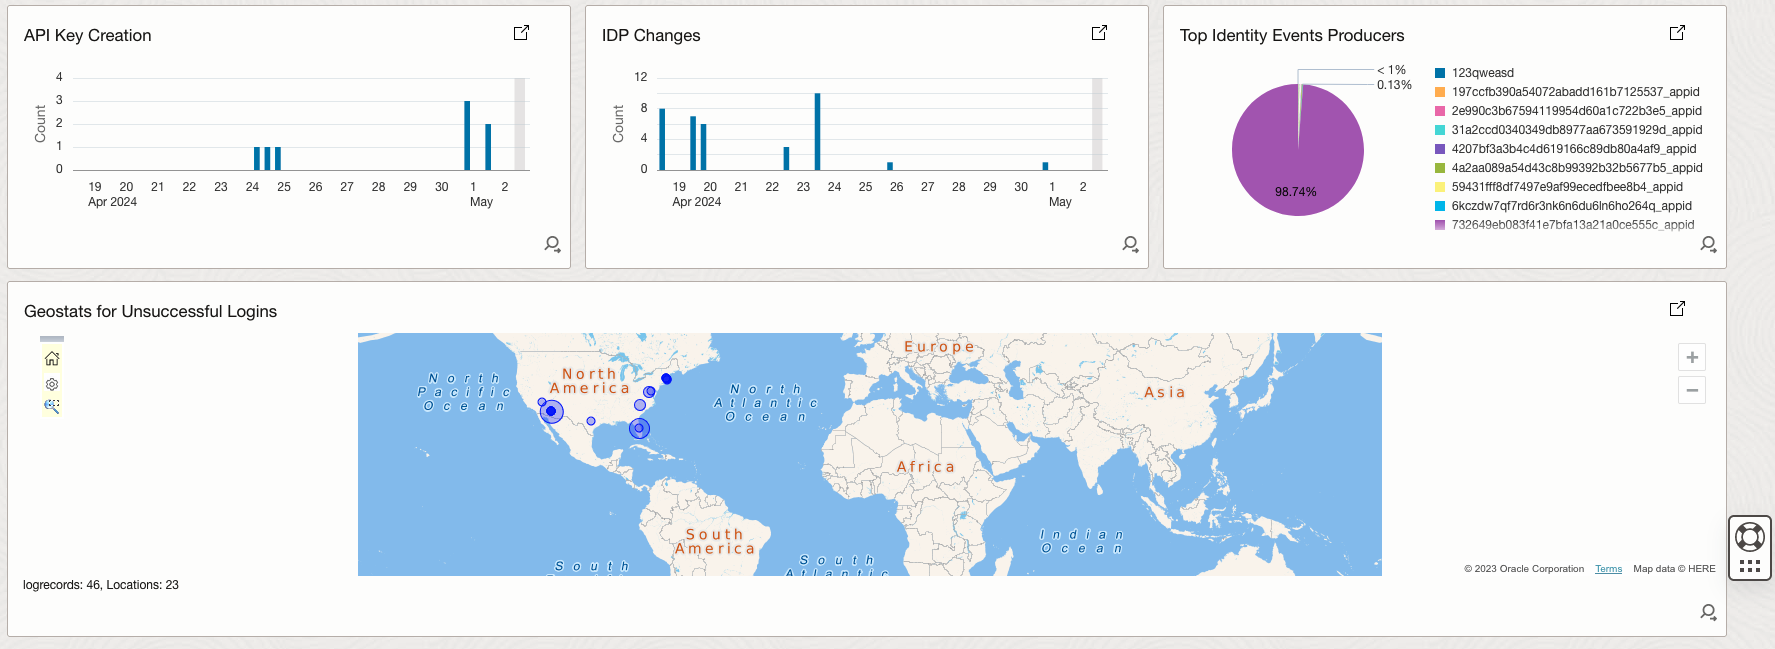
| IAM |
IDP Group mapping update |
Bar Chart showing the count of successful or unsuccessful IDP group mapping change across the tenancy aggregated over 1 day. This includes “Add user to idpgroup”, “Remove user from idpgroup”, “Create idpgroup mapping”, “Delete idpgroup mapping, “Update idpgroup mapping” |
| IAM |
IDP Changes |
Bar Chart showing the count of successful or unsuccessful Identity Provider changes across the tenancy aggregated over 1 day. This includes Creating, Updating, and deleting IDP. |
| IAM |
Local Successful Logins |
Bar Chart showing the count of successful Local Logins aggregated over 1 day. |
| IAM |
Local Failed Logins |
Bar Chart showing the count of unsuccessful Local Logins aggregated over 1 day. This includes failed login due to a wrong password or disabled user. |
| IAM |
API Key Creation |
Bar Chart showing the count of successful or unsuccessful API key creations (additions to a user) aggregated over 1 day. |
| IAM |
Top Identity Events Producers |
Pie Chart identifying the top producers of Identity-related audit events. Internal users and services have been filtered out. Otherwise, the result could be skewed heavily. |
| Network |
Total Network Traffic |
Graph showing the total network traffic across all VCN Flow logs. Aggregated over 5 mins spans and shown in KB. |
| Network |
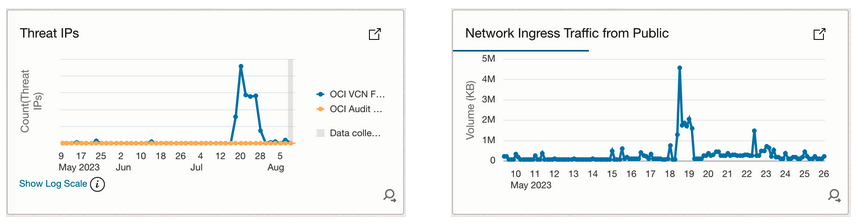
Network Ingress Traffic from Public |
Graph showing the total Ingress network traffic across all VCN Flow logs originating from a Public IP. Aggregated over 5 mins spans and shown in KB. |
| Network |
Security list changes |
Bar Chart showing any changes to Security Lists in the tenancy. This includes creating, deleting, and updating to security lists and rules. |
| Network |
NSG changes |
Bar Chart showing any changes to Network Security Groups in the tenancy. This includes creating, deleting, and updatingupdating Network Security Groups. |
| Network |
Changes to Gateways |
Bar Chart showing any changes to Gateways in the tenancy. This includes creating, updating, and deleting DRGs, NAT GW, IGW, SGW, and Peering Gateways |
| Network |
Threat IPs – Timeline |
Graph showing the count of Threat IPs over time across Flow logs and the OCI Audit log from both egress and ingress traffic. |
| Operations |
Data freshness |
Time stats showing the last collection time for Audit and Flowlogs. The number should be small typically < 3 mins. |
| Operations |
Service Connector errors |
Based on the Service Connector Hub metric namespace and showing errors related to reading from OCI Logging (Source), writing to Logging Analytics (Target), and Service Connector Errors. |
OCI Security Fundamentals Dashboards Onboarding
Logging Analytics should be set up in your tenancy
Configure Logging Analytics
- Configure Your Service
- Prerequisite IAM Policies
- Enable Access to Logging Analytics and Its Resources
Audit and Network Logs Ingestion
- Ingest OCI VCN Flow Logs into OCI Logging Analytics
- Ingest OCI Audit logs into OCI Logging Analytics
Logging Analytics is integrated with Oracle Threat Intelligence to automatically receive the threat feed as the logs are ingested. The feature is available for all the log sources in the regions where both Logging Analytics and Oracle Threat Intelligence services are enabled. The Threat IPs widget makes use of this feature, which is not enabled by default.
To enable:
- In OCI console, Navigate to Observability and Management -> Logging Analytics -> Administration
- Click on Sources. in search box in the top right, search for “vcn”. You should get 2 sources: OCI VCN Flow Logs and OCI VCN Flow Unified Schema Logs
- Edit each source. On the Edit screen, click the Field Enrichment tab. Ensure the Enabled checkbox is checked for the Geo location function
- Edit the Geo location function by clicking the three dots, and check Threat Intelligence Enrichment checkbox.
- If it is not, check the checkbox and click Save Changes
- Repeat above 5 steps for OCI Network Firewall Traffic Logs, OCI Network Firewall Threat Logs, OCI Load Balancer Access Logs, OCI Load Balancer Error Logs, OCI WAF Logs, OCI Audit Logs Sources.
Security Fundamentals Dashboards Deployment using OCI Marketplace App
Security Fundamentals Dashboards (SFD) OCI Marketplace App offers a seamless, one-click solution for customers to effortlessly deploy SFD dashboards and automate the collection of essential security-related logs in Logging Analytics. This streamlined approach simplifies the setup of comprehensive security monitoring across OCI environments, empowering customers to enhance their cloud security posture with minimal effort.
To launch the Marketplace app:
- In OCI console, Navigate to Marketplace -> All Applications
- Search “Security Fundamentals Dashboards”
- Check I have reviewed and accept the Oracle standard Terms and Restrictions.
- Click Launch Stack
-
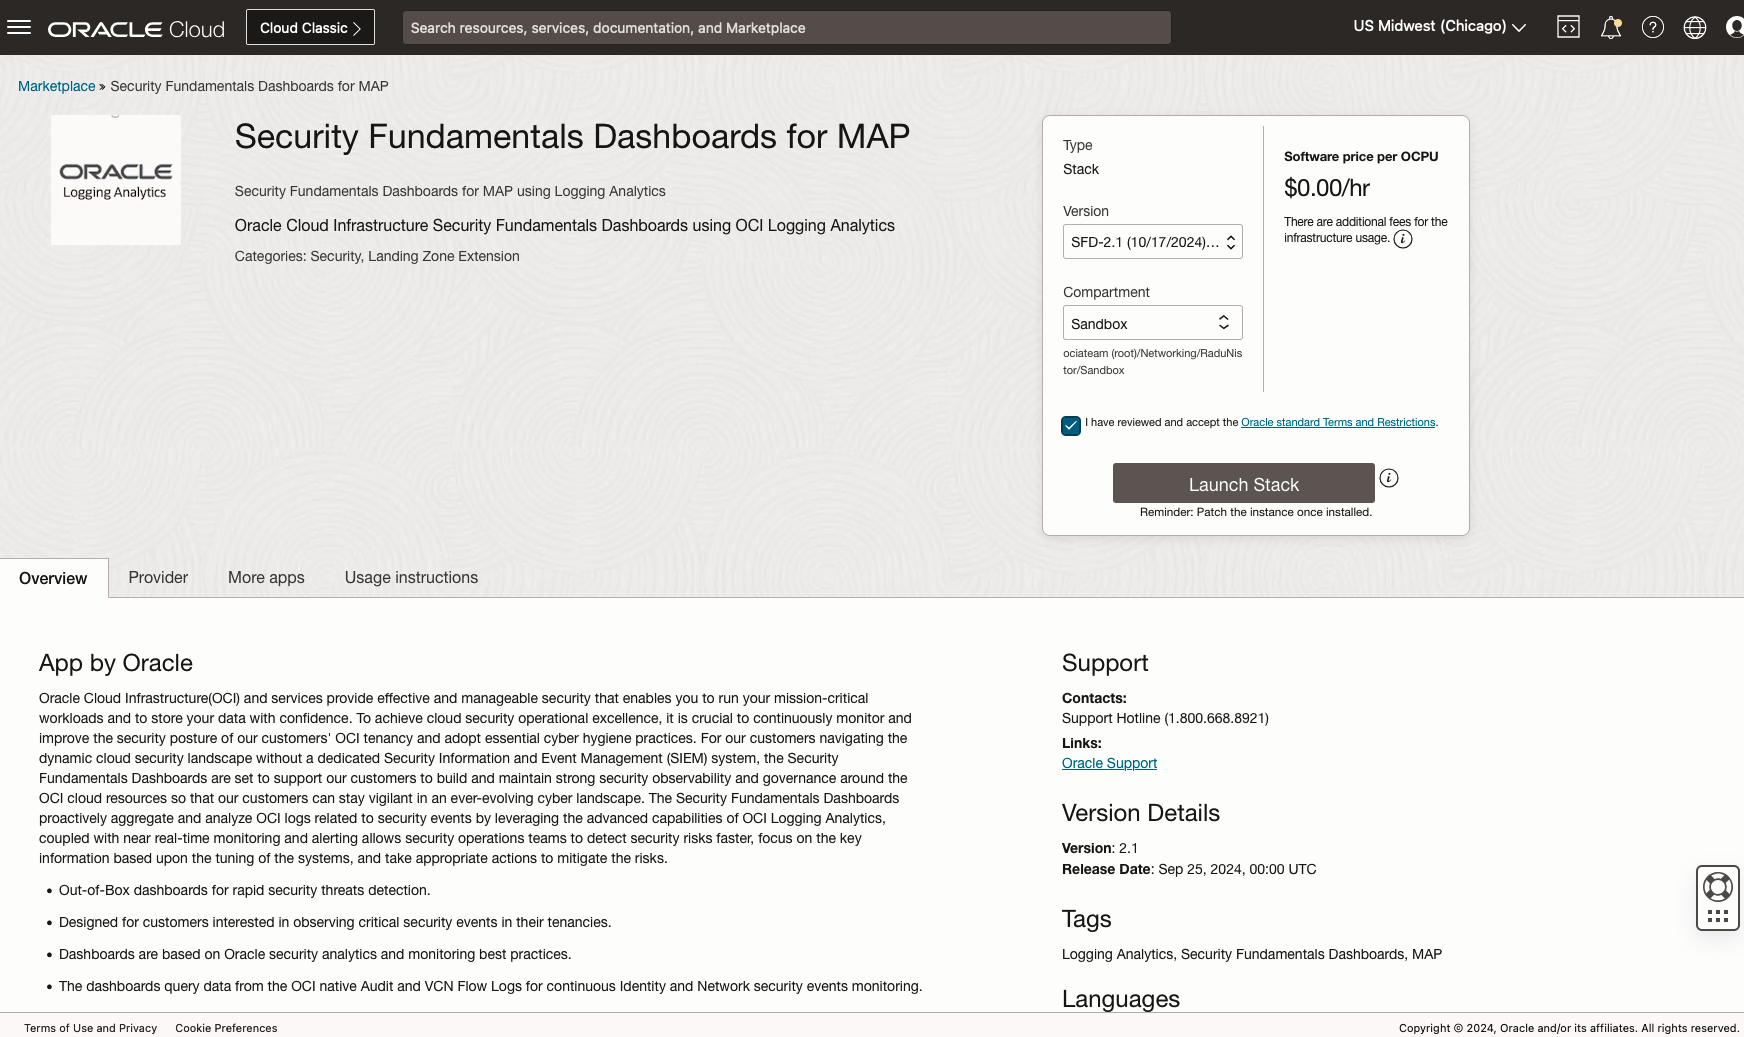
Figure 5. Security Fundamentals Dashboards Marketplace App - Review the Stack Information and Click Next
- Select the Dashboard Compartment from the dropdown to deploy the dashboards
- Check Create Service Connector for IAM Identity Domain Audit?
- Update the Logging Analytics Log Group Name if needed
- Switch Service Connector Hub State from INACTIVE to ACTIVE
- Check Include Network Related Logs? checkbox
- Add the Logging service Network related logs Log Group OCIDs
- Click Next for the final Review, Click Create to run the stack
-
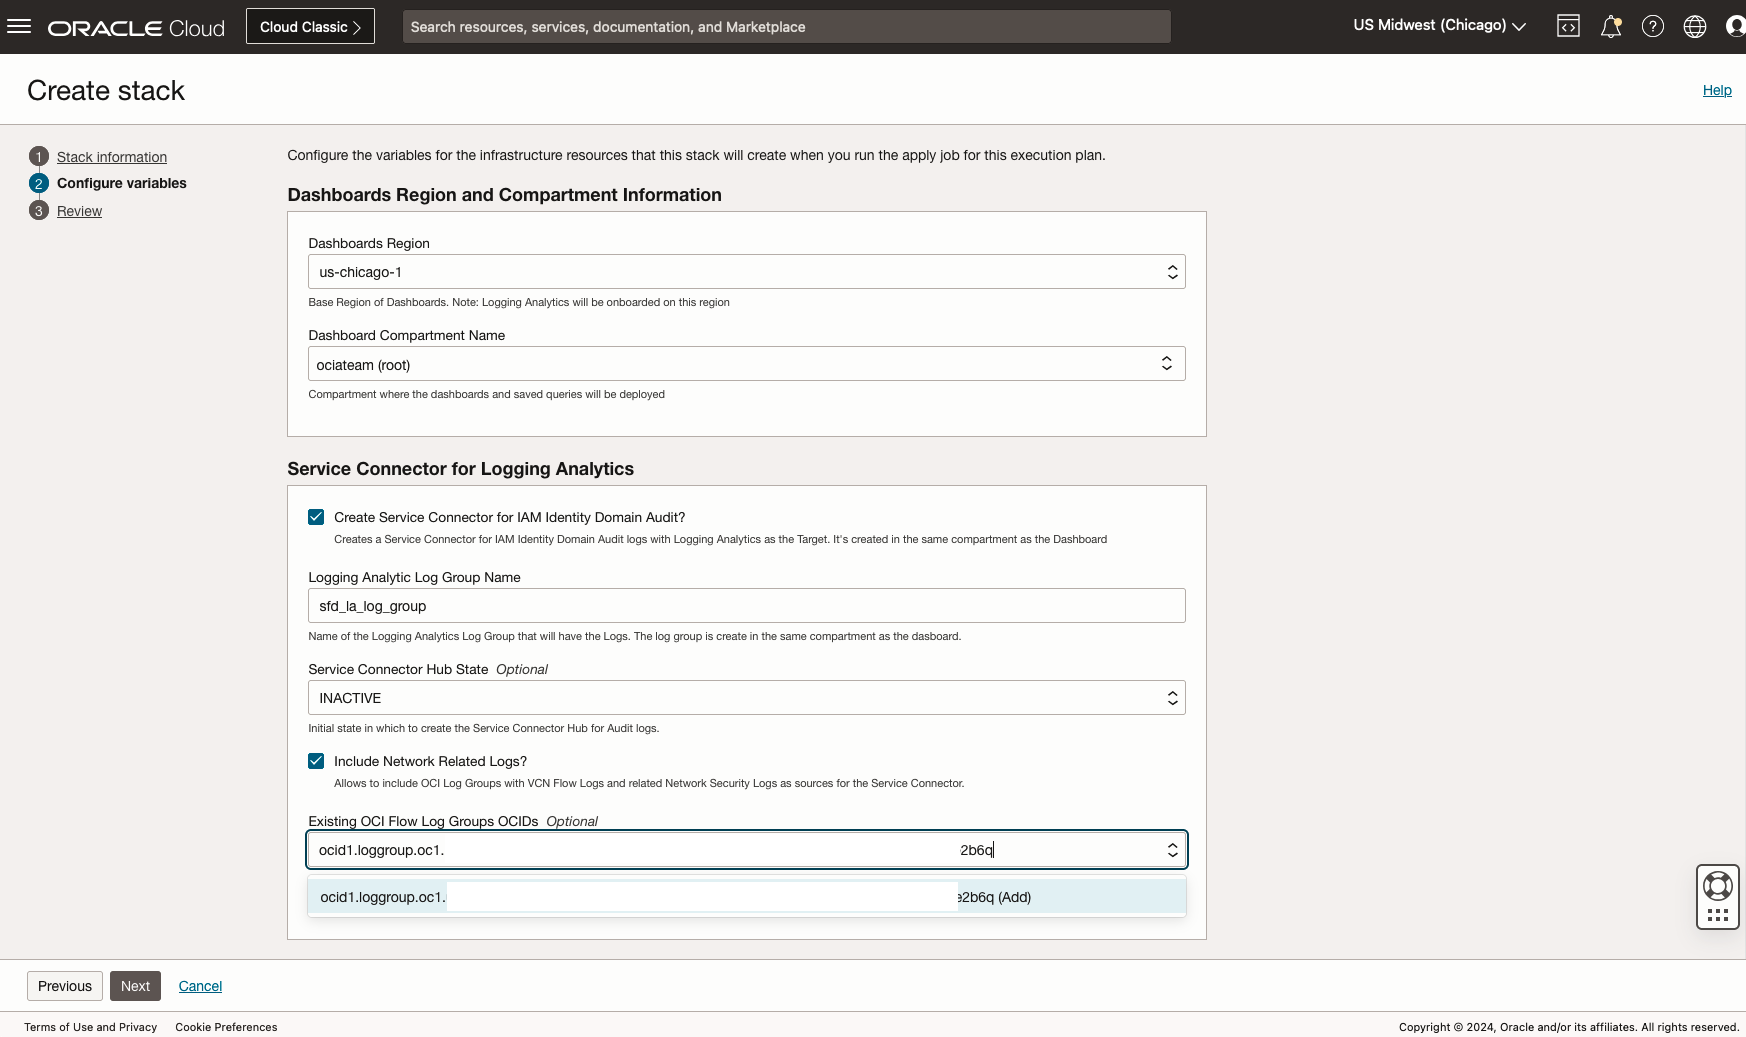
Figure 6. Security Fundamentals Dashboards Launch the Stack
Manual Deployment of OCI Security Fundamentals Dashboards
The required files for the Security Fundamentals Dashboards are stored in the following GitHub repo:
Download the files to your local workstation. There are 3 files with the “.json” extension corresponding to the 3 security dashboards
- Identity Security: Identity Security.json
- Network Security: Network Security.json
- Security Operations: Security Operations.json
Follow these steps to import the JSON files:
- Login to tenancy
- Navigate to LA Dashboards Console -> Observability & Management -> Logging Analytics -> Dashboards
- Click on “Import Dashboards”
- Navigate to the folder containing dashboards and select the first dashboard JSON file
- Select “Specify a compartment for all dashboards” and choose a compartment
- Select “Specify a compartment for all saved searches” and choose a compartment
- Click on “Import”
- Repeat steps 3-7 for the second JSON file
- (Optional) Follow the above steps to enable the Threat Intelligence service integration with Logging Analytics
It may take some time for the data to start flowing into the dashboard. You will not see any data unless there are activities on the target system(s) that would be picked up by the corresponding widget/query.
OCI Security Fundamentals Dashboards Visualization
Security Fundamentals Dashboards now detects security threats and issues in your OCI tenancy. For example, Threat IPs detected in VCN Flow Logs accessing OCI cloud resources or spikes detected in Network Ingress Traffic from Public IPs need further investigation from the security teams to mitigate security risks across your tenancy.
Conclusion
Security Fundamentals Dashboards provide a great starting point to monitor security events using Network logs and Audit logs via Logging Analytics for our OCI customers. By leveraging these OCI features, organizations can gain valuable insights into their OCI security posture and make informed decisions to secure and manage cloud resources.
Sign up for an Oracle Cloud Infrastructure free trial account today to try out new Oracle Cloud Infrastructure features!
Resources
- Elevating Network Security: Introducing New SFD Network Security Dashboard
- Enable Logs for VCN Flow Logs
- Enable Logs for OCI Network Firewall Traffic Logs and Threat Logs
- Enable Logs for OCI Load Balancer Access Logs and Error Logs
- Enable Logs for OCI Web Application Firewall
- Monitoring OCI Web Application Firewall (WAF) with Logging Analytics
- Logging Analytics – Configure Your Service
- Logging Analytics – Prerequisite IAM Policies
- Logging Analytics – Enable Access to Logging Analytics and Its Resources