Most companies have multiple IT environments spread across their enterprise and now also on the cloud. The management of those environments is rapidly changing, with groups managing hybrid infrastructures and responsibilities split across partner, customer, and provider. Customer and user satisfaction is paramount so high system availability is essential.
Oracle Cloud Infrastructure (OCI) Observability and Management (O&M) services enable you to monitor cloud and on-premises environments while offering a 360° view of assets. When contemplating which tool to replace, use, or the extra monitoring capabilities to enable, use cases help guide the decision-making process.
When starting a new project in a new environment or moving a workload to a cloud provider, one of the first questions asked is how to monitor it. As many companies find that the tools they have relied on for years do not support modern applications and architectures that can span on-premises and cloud environments (hybrid) or across different vendor cloud environments (multi-cloud). Oracle Cloud was built for modern applications and the Oracle Cloud Observability and Management platform helps businesses facilitate their transition to the cloud with the latest technology, best practices, tutorials, and enablement tools. OCI O&M services are available globally and compliant with the highest industry standards.
When you move or start an OCI project, you have a choice to use the tools you are familiar with (should they support modern application architectures), replace them with OCI native Observability services, or use a combination to improve your visibility. When contemplating how to proceed, here are some general questions tol guide you:
- Does the tool manage across hybrid and multi-cloud environments?
- What is the cost of integrating the existing tool with OCI?
- Is my current monitor tool enabling you to prevent issues versus reacting to them?
- Does the tool tell you how much impact there has been on users or just that there was an impact like something is down or unavailable?
- Does the tool provide full vision of applications and their infrastructure or just a piece of them or specific technology?
If your current tool doesn’t meet the latest environment requirements for your business or you don’t want to spend time performing installation, integration, upkeep, and the management of tools on-premises, this blog outlines new considerations and choices of O&M services available from the Oracle Cloud.
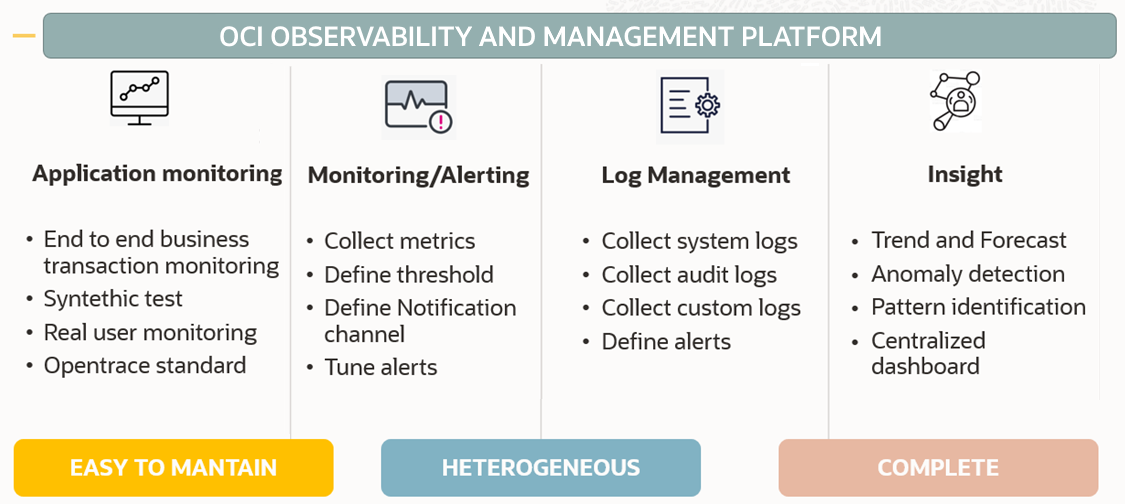
An Observability framework generally includes four main areas:
- Application monitoring – ability to track down the application user experience
- Monitoring – a single place where metrics and alerts are collected and defined
- Log Management – a single place where logs and events are collected and analyzed
- Insight – apply machine-learning algorithms to process collected data, identify anomalies and pinpoint root cause
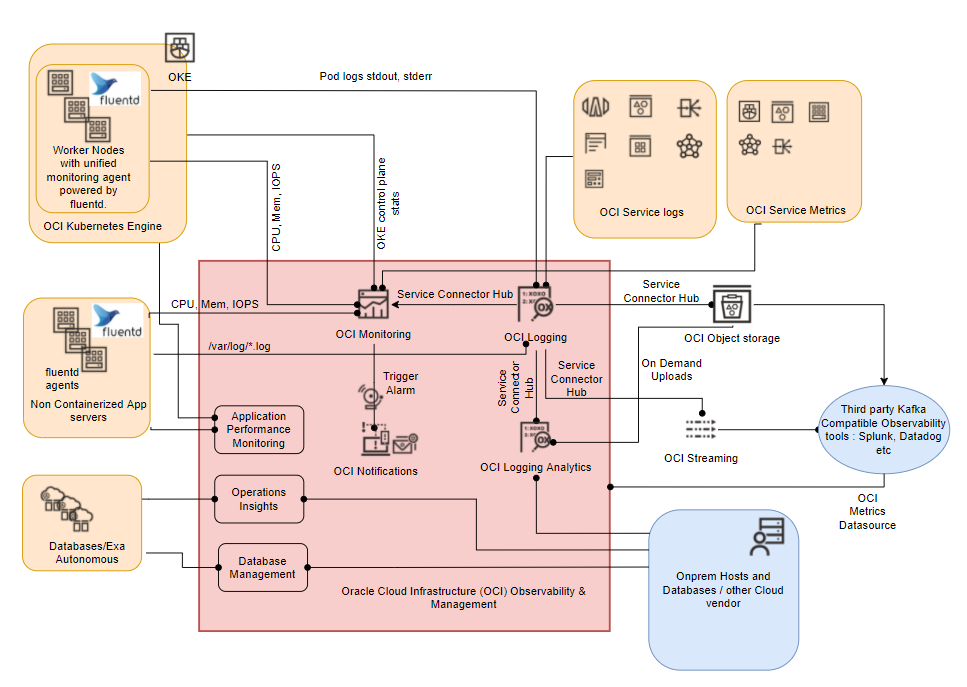
Foundational OCI services collect the data and send logs and metrics into OCI Monitoring and Logging services. If you want to apply machine-learning capabilities and perform analysis, you can send the data to the Logging Analytics service. For example, you want to use OCI Logging Analytics to collect logs coming from on-premises or the cloud and analyze for audit or security reasons or feed information onto an external SIEM, Connector Hub comes into play.
As OCI O&M is very flexible and offers you choices, it’s recommended that you define your monitor strategy when you start a project on OCI. Here are some simple steps to aid your decision-making process.
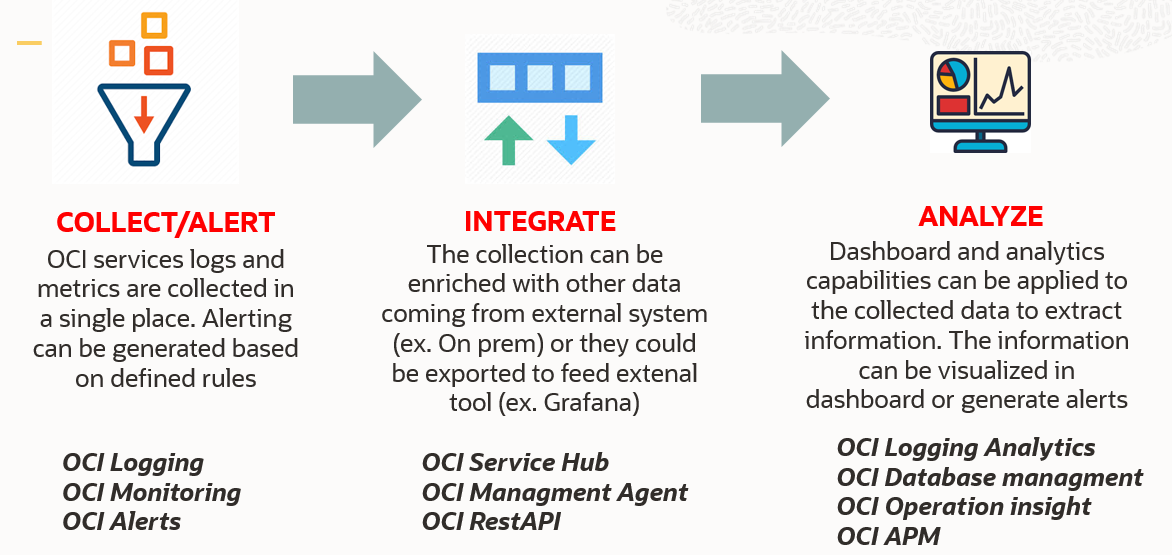
Collection
In Observability, the more data you collect the more information you will have to improve your decision.
Collection Checklist: Decide what you can get from logs, systems, and metrics
- Define the list of targets that are important to monitor (ex. VCN, Load Balancer, Compute, Application, Database, etc…)
- For each target, define the log/event and metrics you want to collect. Here you can find a list of OCI metrics pre-defined so you don’t have to create them yourself. Here you can find the log produced by the OCI services.
- Identify critical metrics/events and define alarms on them
Integration
Define the data flow to feed your choice. Using Oracle Cloud, Observability centralizes the collection, management, analysis, and display of the information for you.
Integration is the stage where you decide which tools you want to use, replace or augment.
There are two types of integration to consider:- Export: export data to feed an external tool. OCI supports several protocols. There are three ways to export data: Notification Channel, OCI Monitoring RestAPI, and Service Connector Hub. If a protocol is not supported or needs a customization, you can write your own Function
- Import: consolidate data coming from outside of OCI with the data you have in. For example, you want to use OCI Observability services to monitor on-premises databases or get logs from your on-premises application. In this case, feed OCI tools by RestAPI or Management agent.
Integration Checklist
- Make a list of monitoring tools you are using, the people that use these tools, what they support, the systems where these are used, and their cost (maintenance and license)
- Define for each of the Observability areas (APM, monitor, logs, insight) the tools you plan to use. Optimally, it would be one to collect and correlate across metrics and logs which further saves the cost of trying to integrate it yourself.
-
If a majority of the workload resides in OCI then consider replacing some of your existing tools with OCI Observability and Management services because they are cloud-native and pre-integrated, saving time and integration cost
-
If your infrastructure is distributed primarily across on-premises enterprises then, you could choose to keep an existing tool but then define for each tool you plan to keep using, what is the best protocol to feed it (ex. S3 Object Storage, RestAPI, Stream…). OCI provides support for the latest protocols available in the market
-
- If you are already using diagnostic tools like Oracle Enterprise Manager you can decide to keep using them and integrate their functionalities with O&M. Here you can see how to do it.
Analysis
Once you collected the data, decide what you want to do with it. Here are key capabilities to be practive:
- Ability to analyze and correlate across the metrics, logs, and events. Perform that on data from different systems, sources, and data formats. For example, you want to see how incremental usage of the application by users impacts database resource utilization.
- Monitor a baseline and have anomaly detection. Ability to detect what is normal and what is not. For example, you want to know which component is slower compared with a period of time or what a user/business is doing when something performed is not the daily norm.
- Capacity insight, and ability to forecast resources will be available. The ability to predict a lack of resources or a system will run out of capacity or processing power in the next 30 days so you can plan and prevent it from occurring and impacting business.
Analysis Checklist: Analyze data and extract information to make a difference between reactive and proactive
- Observability is for everybody. Each department or Line Of Business will want a different dashboard specific to their needs but if the data is in the same place and the analysis framework the same then the communication across the departments will be more effective. If troubleshooting is fact-driven, then everybody will agree on the root cause and the resolution will be quicker.
- A business transaction moves across different application servers and different datacenters. If you need the ability to track down the user, measure their satisfaction, and proactively identify the issue and where the cause is. OCI Application Performance Monitoring provides that functionality.
- If you are developing a new application, consider including it in the code OpenTelemetry span. That will make it easier to monitor it.
- Collect as much data as you can (using the cloud – you can collect as much as you want). Extend as much of what you collect for monitoring. Get logs/events and metrics from all the targets identified at the collection stage.
- Centralize the logs from all on-premises data centers/cloud environments into an analytics tool that has machine learning built in. OCI Logging Analytics has that capability.
- Verify if any logs contain sensitive data; and if they do, mask them
- Create custom dashboards by selecting the views most important to the user
- Whether or not you are already using Oracle Enterprise Manager or database management to monitor databases, consider extending the analysis of the data EM collects with Operations Insights to forecast resources and SQL performance degradation.
Get started with OCI Observability & Management
The best way to learn is to try it yourself. Oracle offers a Free Tier with no time limits on key observability services:
- 500 million monitoring ingestion datapoints, 1 billion retrieval datapoints
- 1000 tracing events per hour
- 10 GB log storage per month
- 1 million notifications through https per month, 1000 sent through email per month
- 2 service connectors
- A wide selection of additional OCI services
Try these services and find out how they work for your use cases. Or use our tutorials and any of our hands-on labs like:
- Using OpenTracing for Microservices
- Monitori E-Business Suite with OCI Logging Analytics
- Get started with OCI Database Management
- Using Events and Notifications