Contributors: Chris Gurley, Vamshidhar Pasham, Santiago Bravo
OCI Operations Insights, (OPSI), part of the Oracle Cloud Observability and Management platform, is a solution that helps you gather, analyze, and plan for enterprise growth. In essence, it helps perform data-driven capacity planning and performance management thereby reducing enterprise capital expenditure and improve applications throughput. As we continue to introduce more capabilities and improve the OPSI experience, this blog highlights key additions in the last few months.
SQL Insights – Historical workload analysis and applied observability
The SQL Insights component in OPSI, provides more comprehensive and accurate SQL-level application workload telemetry analysis. This enhanced telemetry is collected periodically throughout the day on every OPSI-enabled database. This workload history is archived and the data is mined for “insights” at the enterprise (fleet), database (workload), and SQL levels. The goal is to better observability informing you on trends or important incidents occuring in applications, specifically in the SQL performance area. This component focuses on three use-cases as described below:
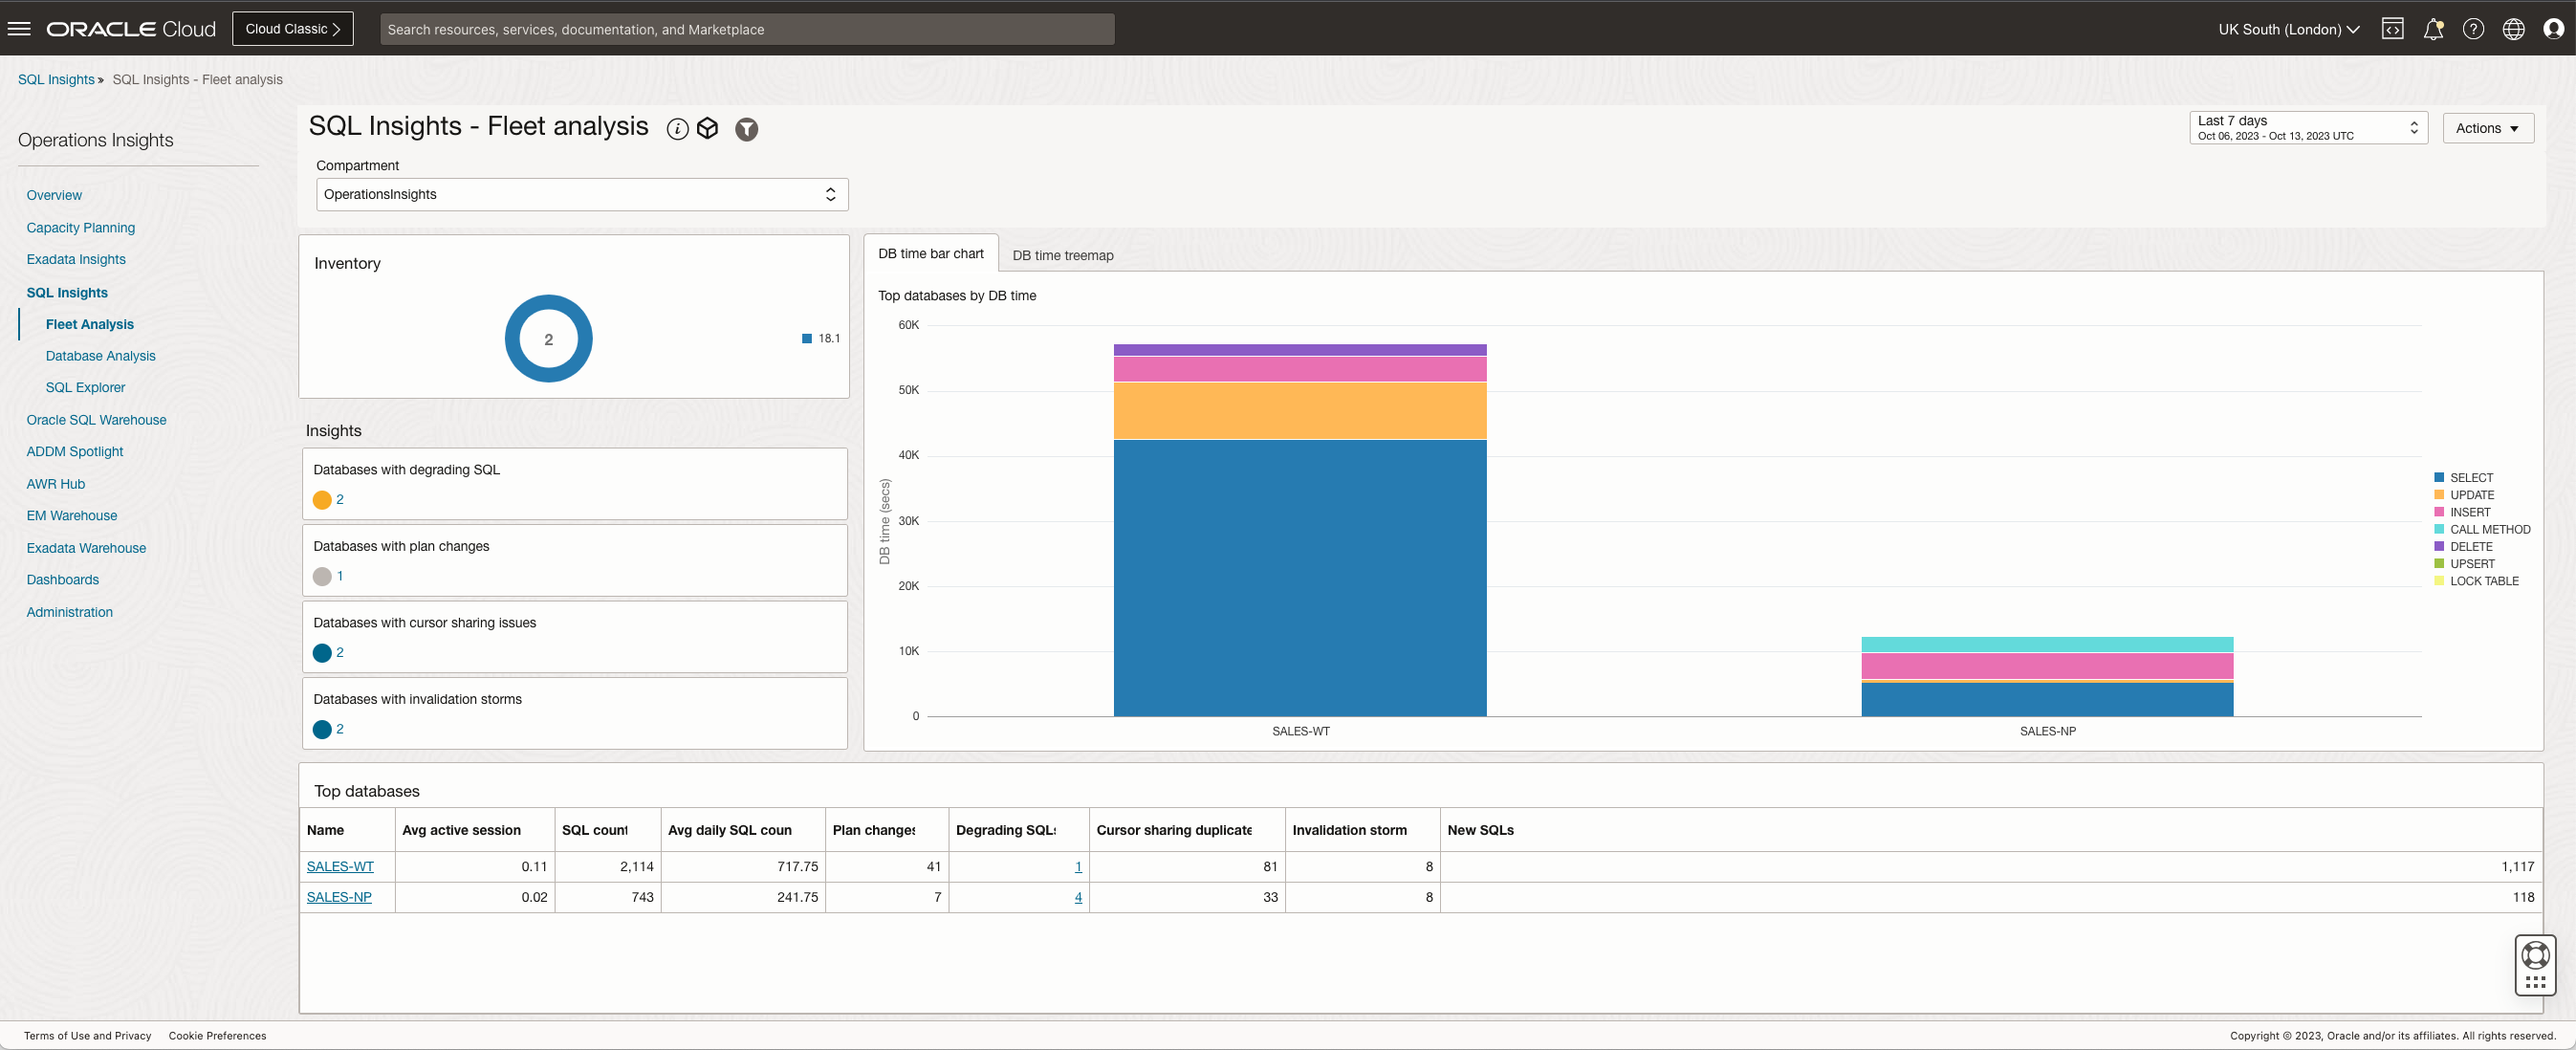
SQL Insights – Fleet analysis
The fleet analysis page presents a birds-eye view into the databases enabled for Operations Insights examining overall workload and gathering key insights for the entire fleet. Top databases by insights and SQL performance measures are displayed in a table format. Context-sensitive links enable you to drill-down from the fleet-level, to a specific database, to the individual SQL level.
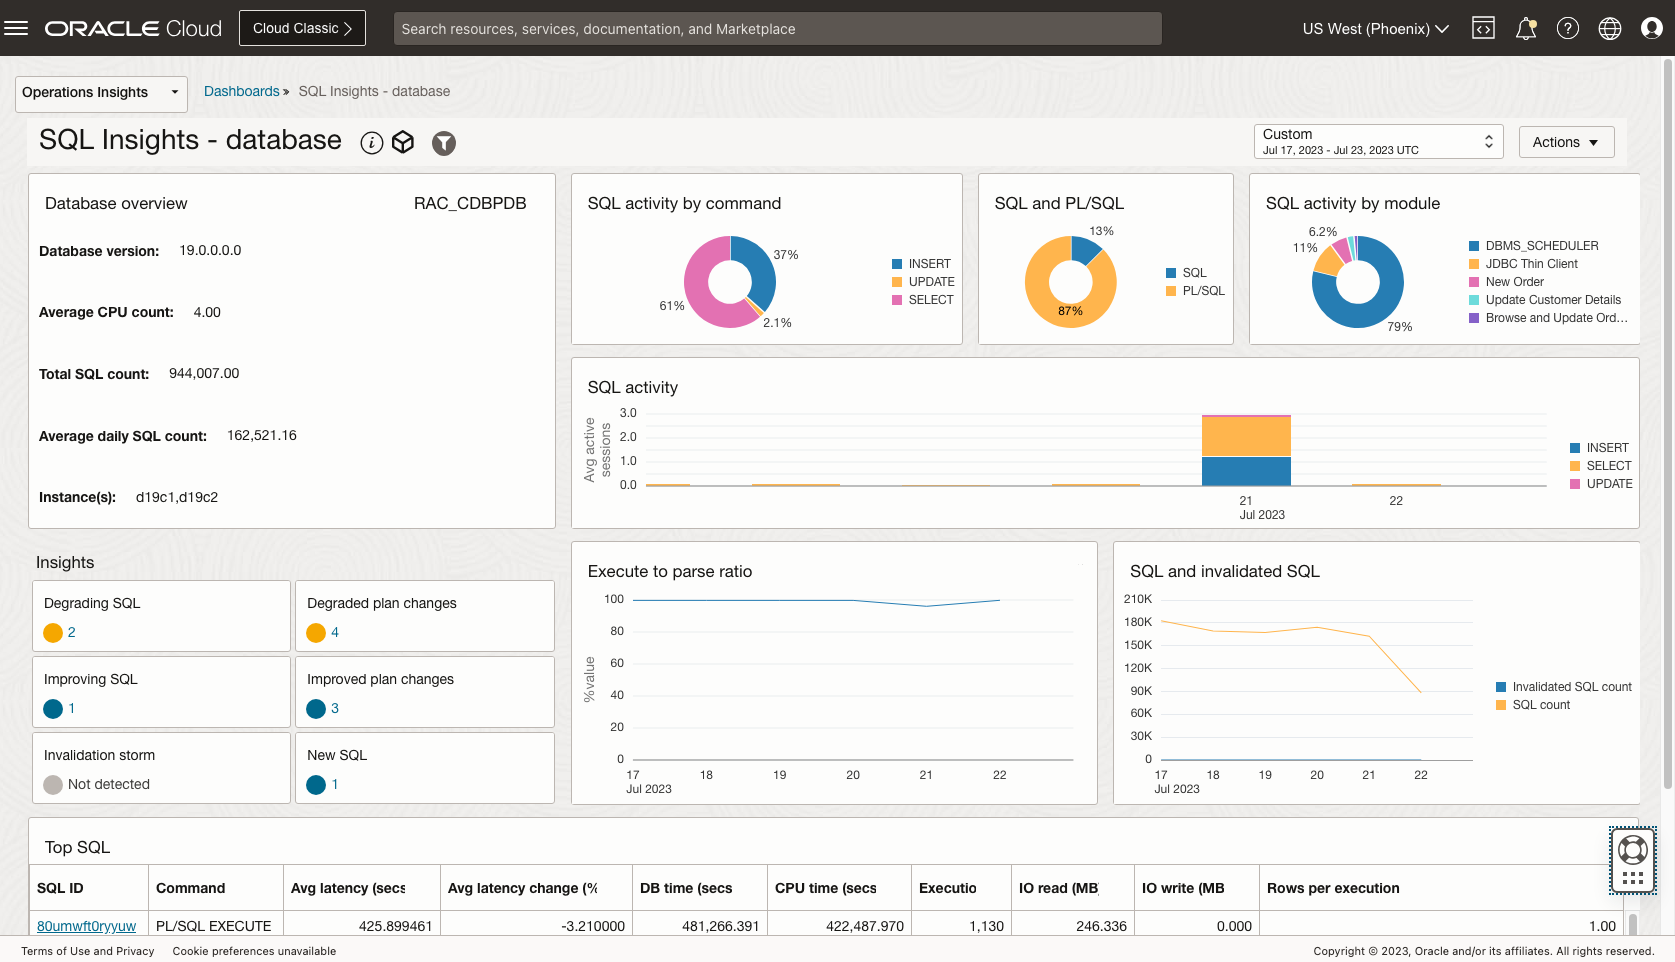
SQL Insights – Database analysis
The database analysis page presents a summary of the performance of all SQL collected from a database over a given time period. Widgets include SQL activity over time, broken down by command type and module, parsing and invalidations, and Top SQL by various key performance measures. Insights include aggregated impact of plan changes, degrading SQL, new SQL and invalidation storms.
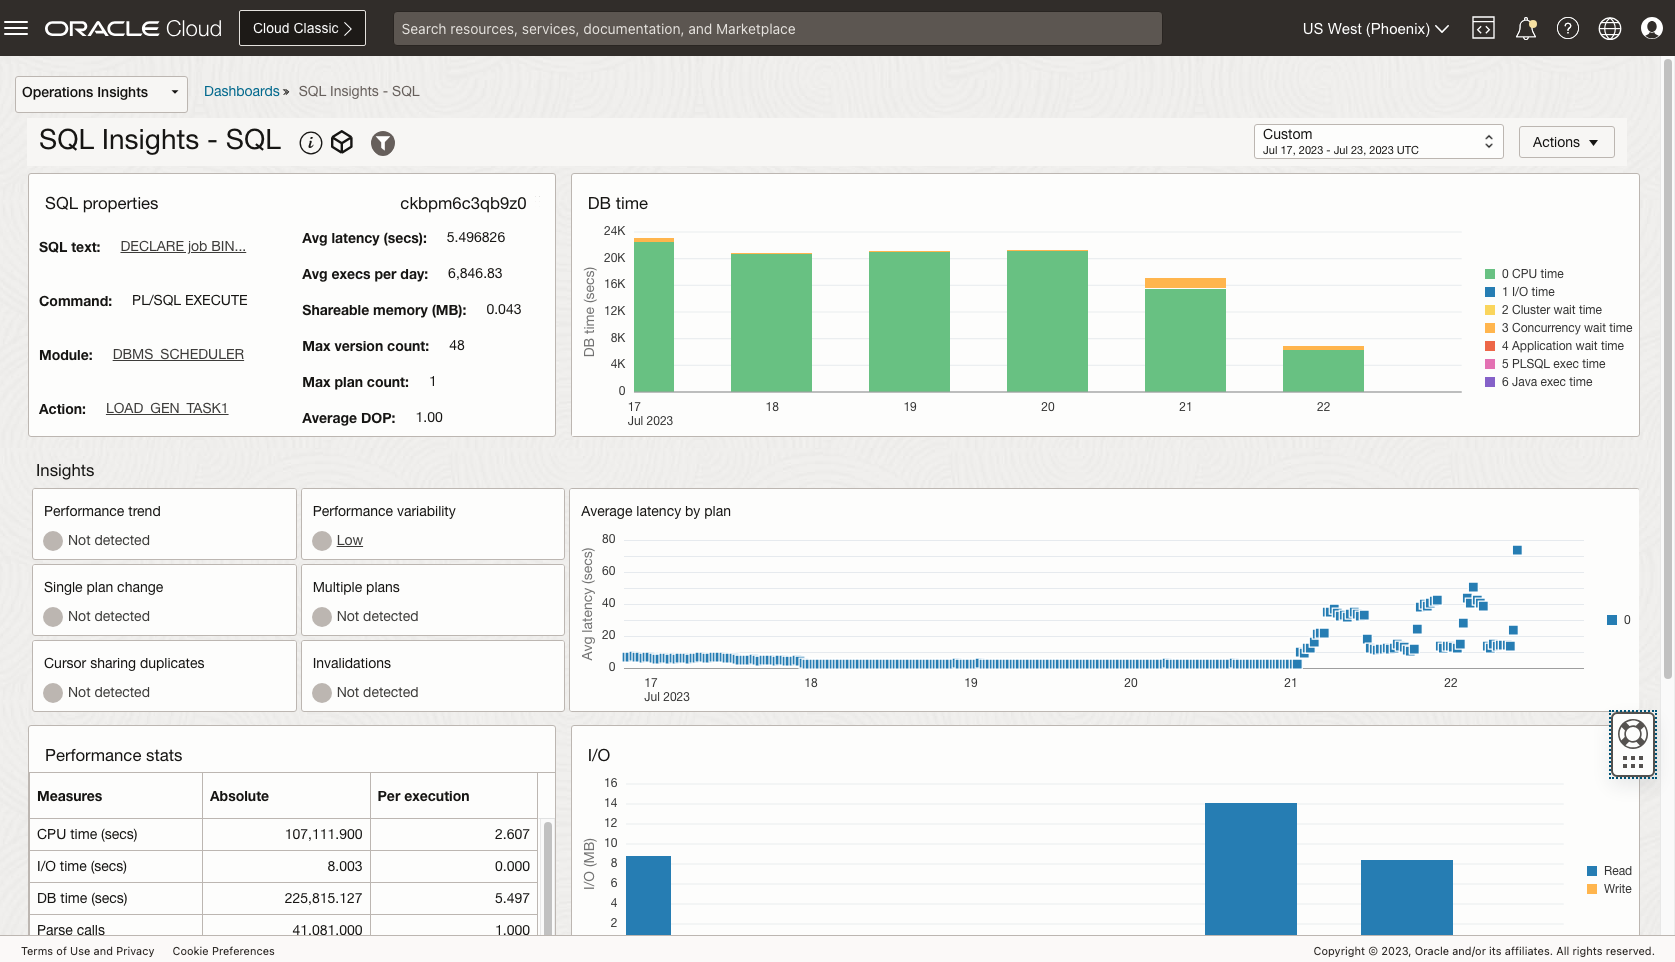
SQL Insights – SQL analysis
The SQL analysis page presents detailed insights and historical performance data for a given SQL executing on a given database. Performance measures include average latency, total database time, parsing activity, I/O, etc. Insights include detection of gradual performance degradation, plan change impacts, cursor sharing issues, and variable performance.
This analysis is available for all database types supported within Operations Insights. For Oracle Autonomous Databases, you subscribe to the “Full Feature” set for a given tenancy (serverless and dedicated infrastructures are both supported).
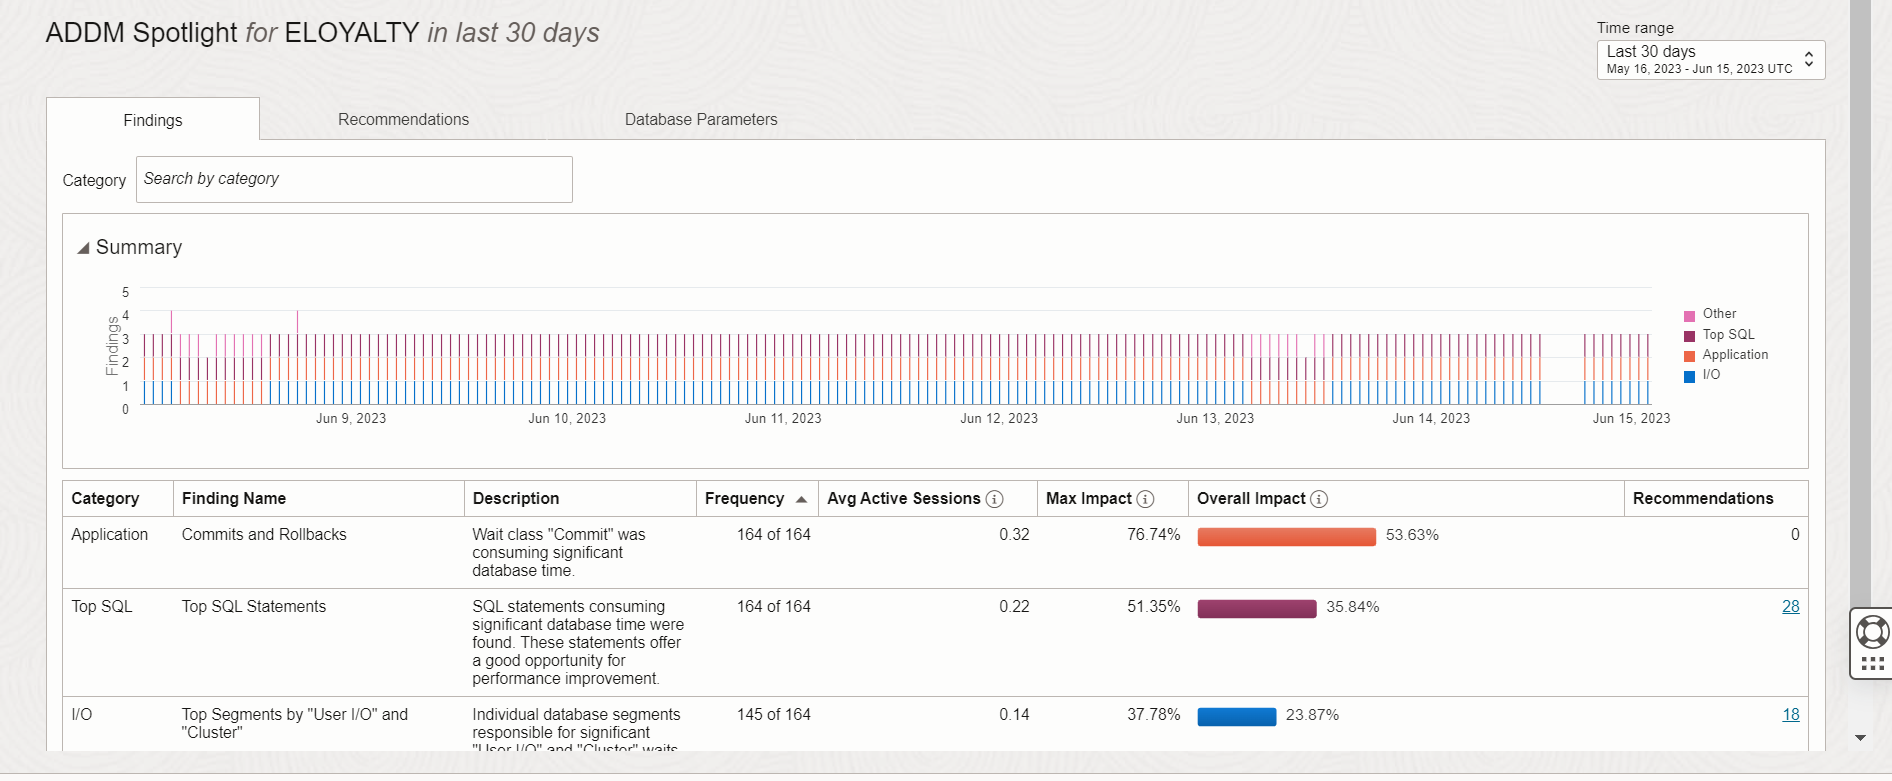
ADDM Spotlight visualizations for Autonomous Databases
ADDM Spotlight is now available for Autonomous databases via the “Full Feature” support (both serverless and dedicated infrastructures). ADDM Spotlight provides powerful visualizations of ADDM findings over time (as shown in the Figure 4 below). These capabilities help identify anomalies in database performance quickly and resolve resource bottlenecks faster. Use ADDM Spotlight to increase performance and reduce unplanned downtime.
OPSI Capacity and configuration dashboards
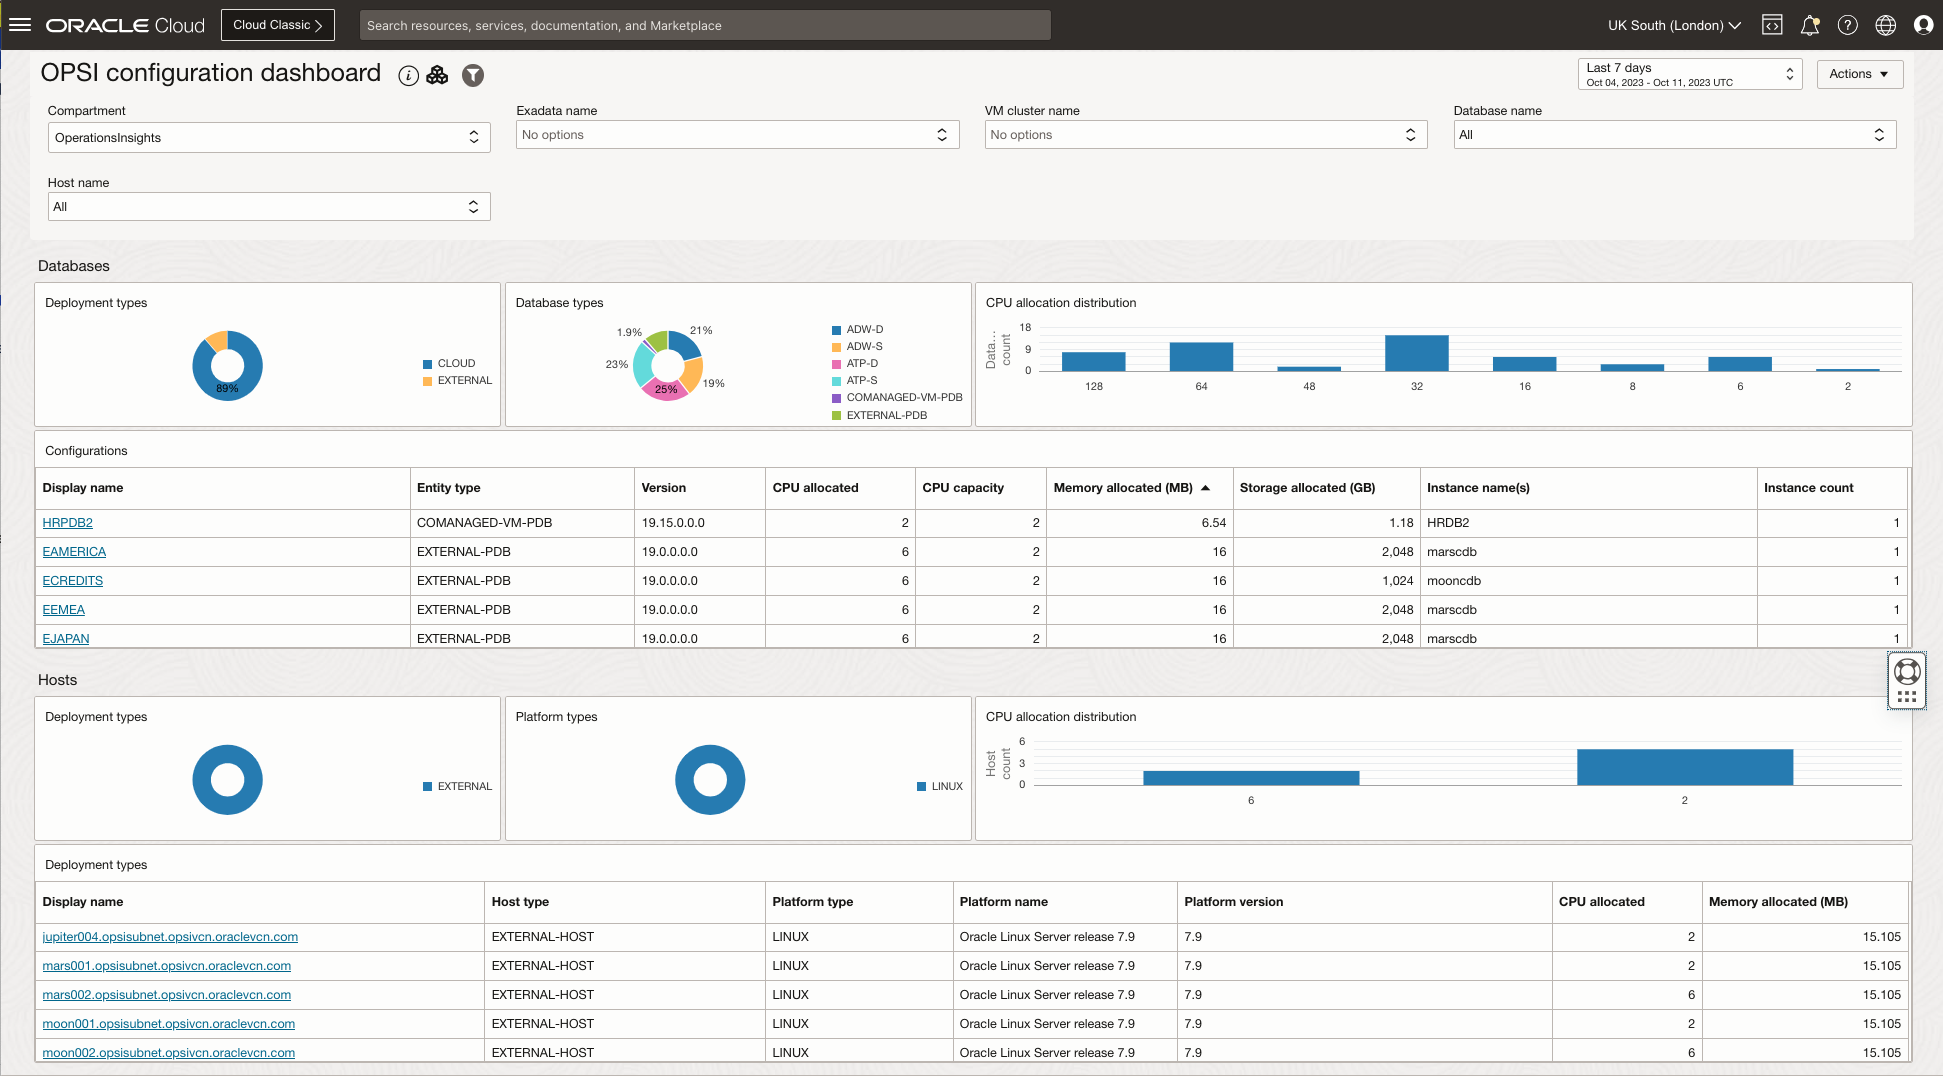
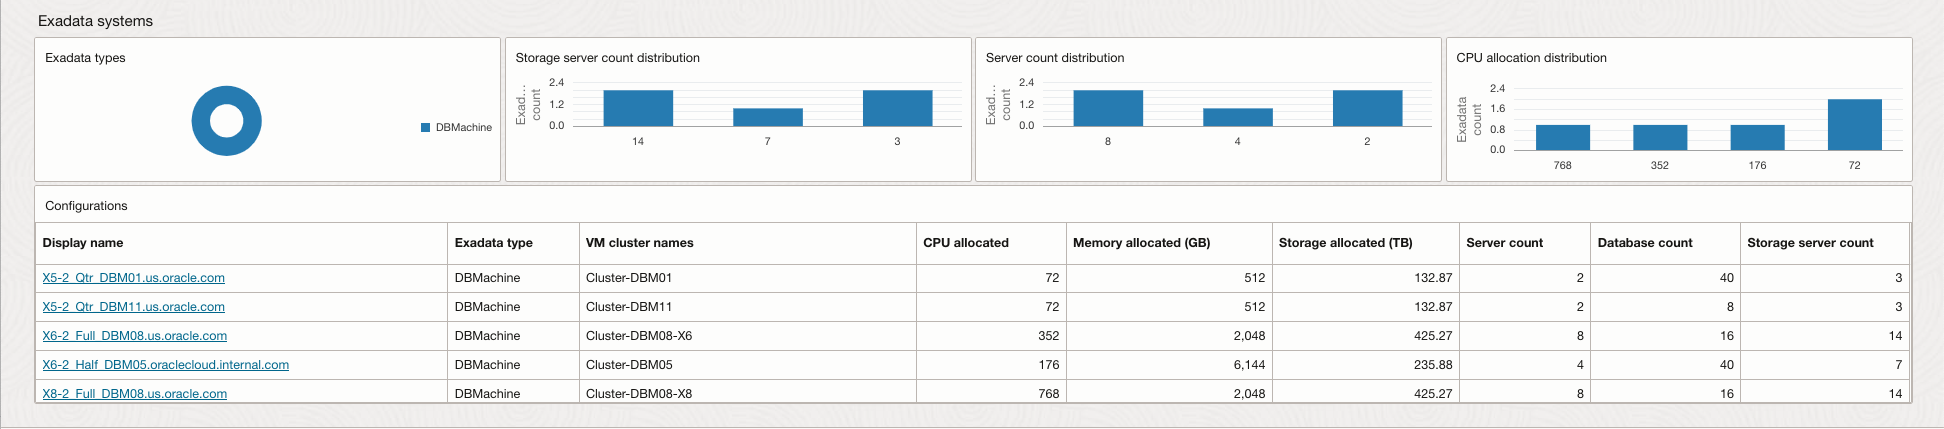
Dashboards are very powerful as they provide applied observability with key observability metrics and performance indicators are viewable at a glance, enabling you to prioritize your activities in real-time. New dashboards are now available for use within the OPSI service. The OPSI configuration dashboard provides a fleet-wide view of configurations across the Operations Insights enabled databases, hosts, and Exadata systems, including the CPU allocation distribution, the breakdown of cloud versus on-premises resources, platform types, and Exadata storage server and server counts. The screenshots below give you an idea of the layout and type of data included in these dashboards:
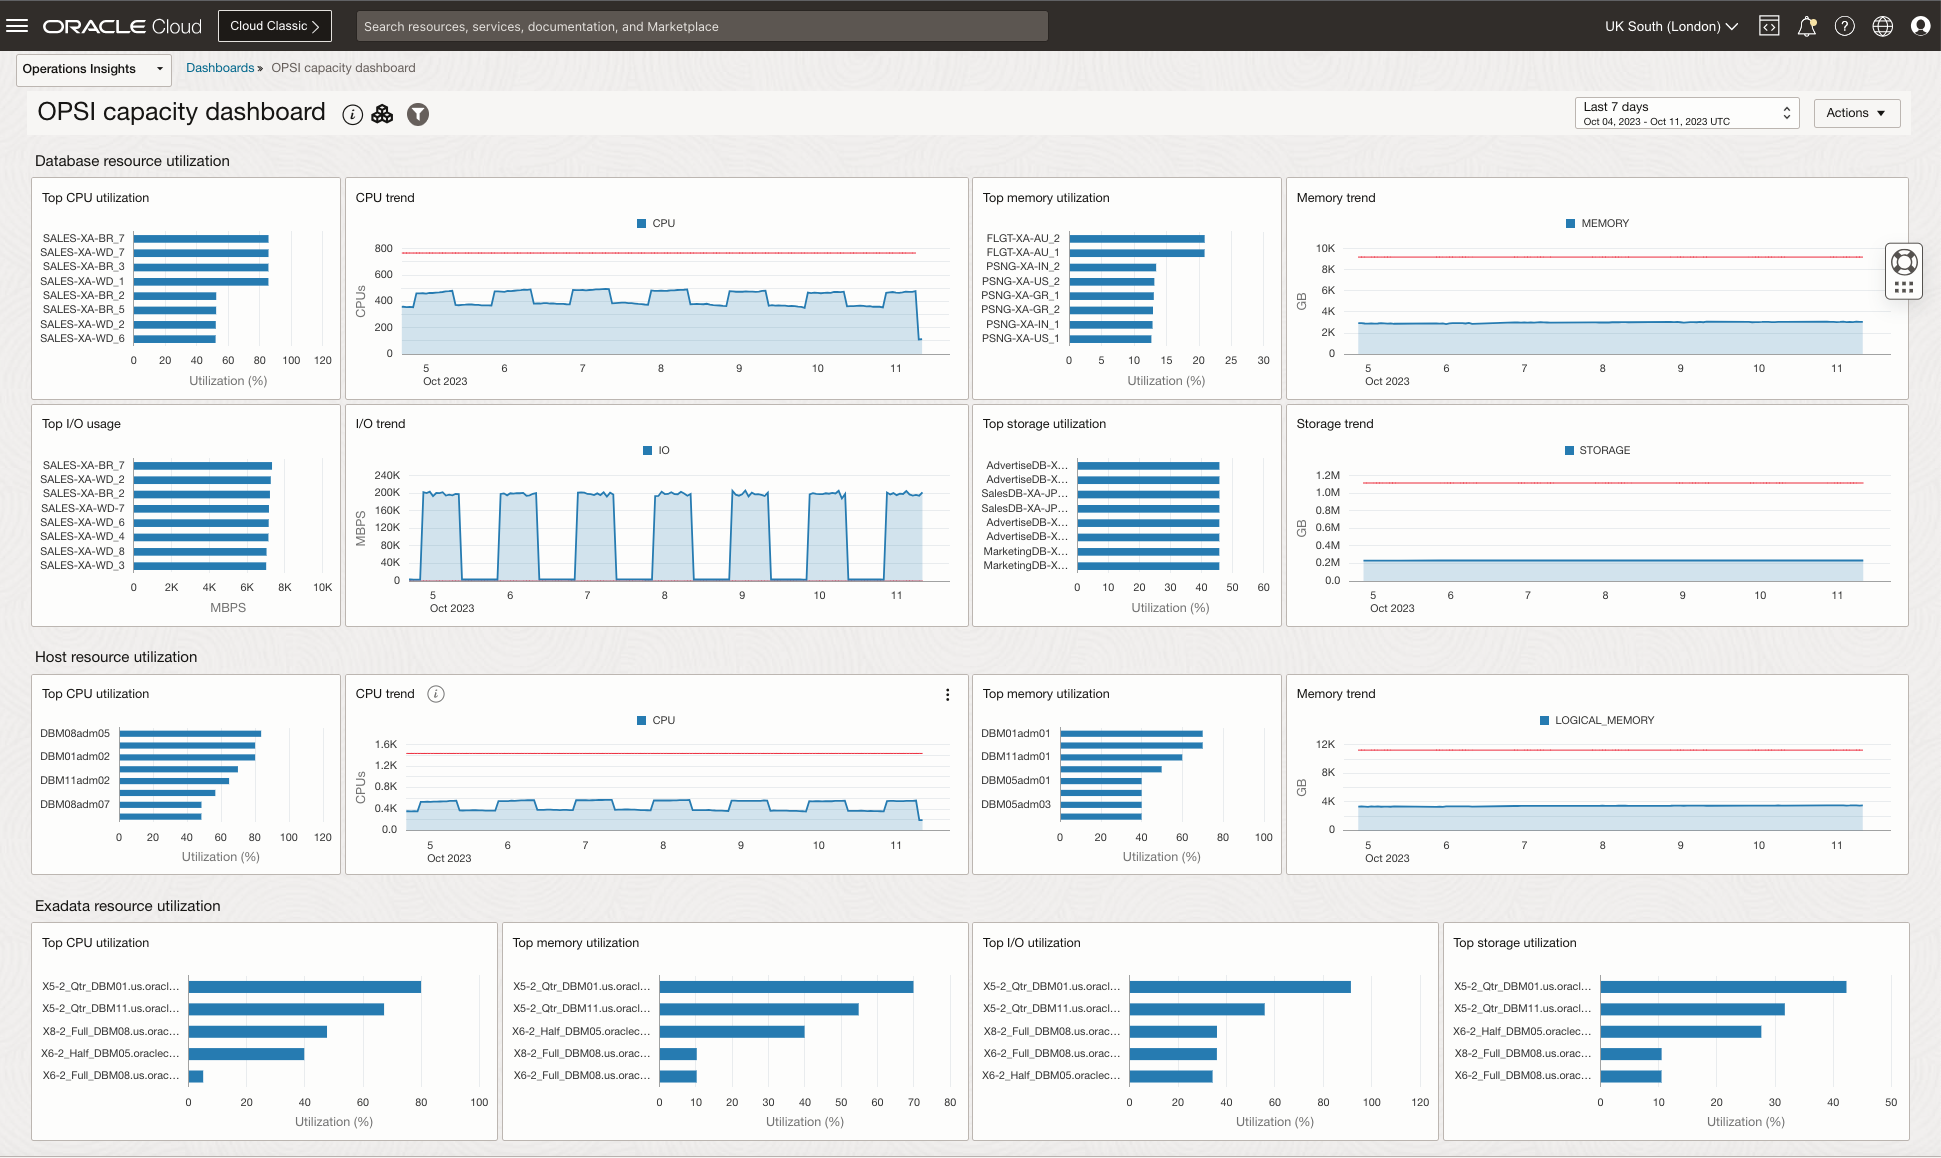
The OPSI capacity dashboard provides a fleet-wide view of top utilized databases, hosts, and Exadata Systems enabled for Operations Insights. The data can also be conveniently filtered by an Exadata system or VM Cluster, where applicable. View the dashboard below for an example and more details:
OPSI Cross-service dashboards
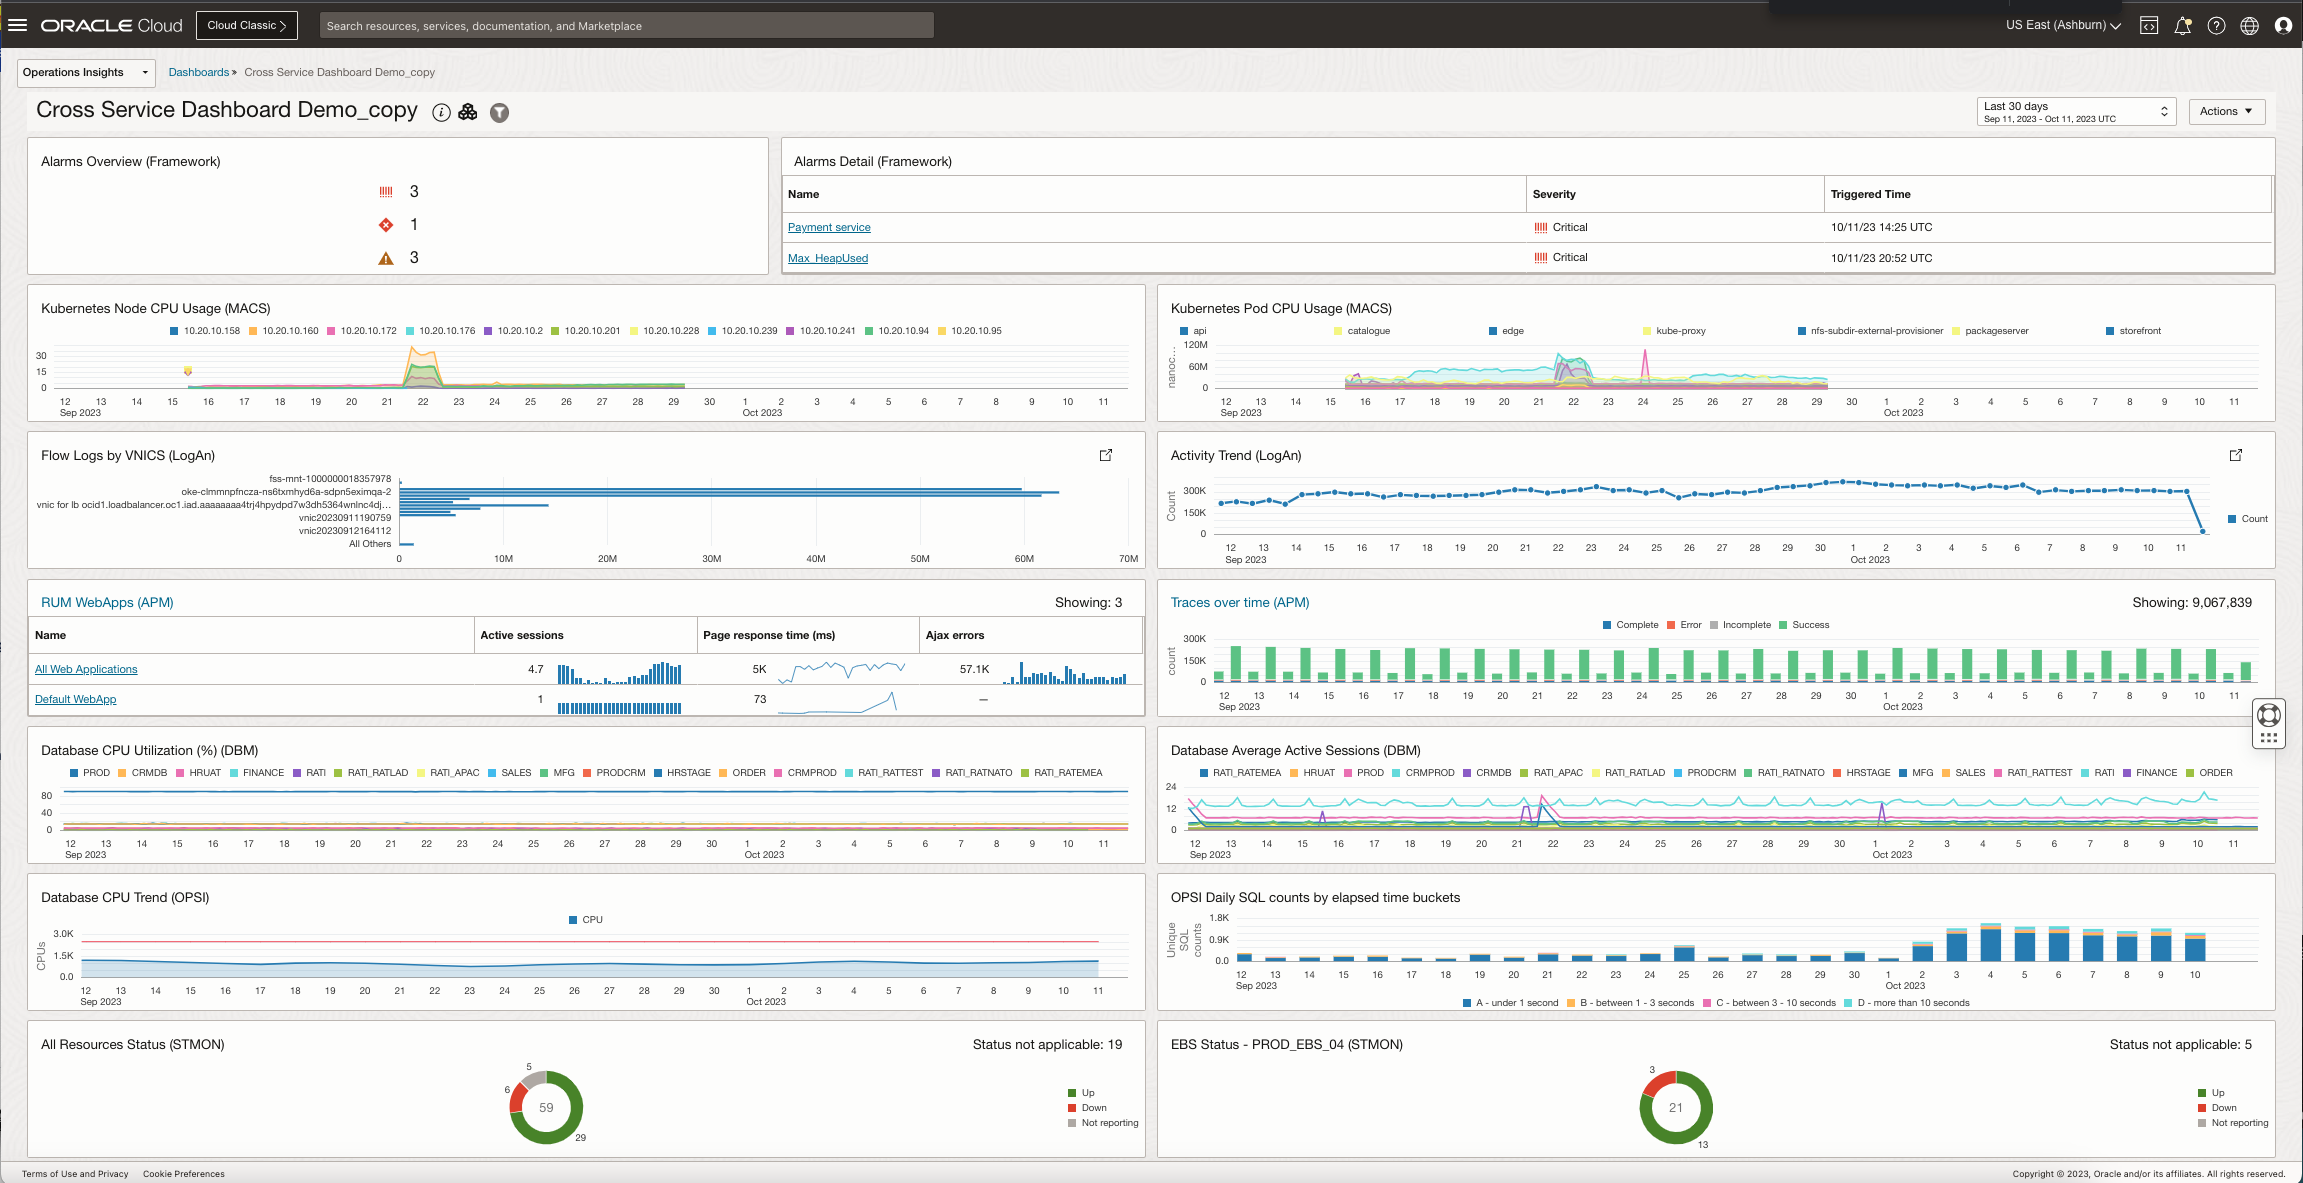
Dashboards and widgets created within other OCI Observability and Management services are now also visible in OPSI. For example, Database Management, Logging Analytics, or APM dashboards and widgets can also be viewed in OPSI. Here is a sample cross-service dashboard:
OPSI Dashboard enhancements
Data from all of the OPSI Data Explorers, for example SQL Explorer, can now be conveniently exported to a comma-separated-values (CSV) file. This can be done from the Data Explorer or, you can also export data in a CSV format directly from the dashboards.
Here is an example of exporting from the Data Explorer:

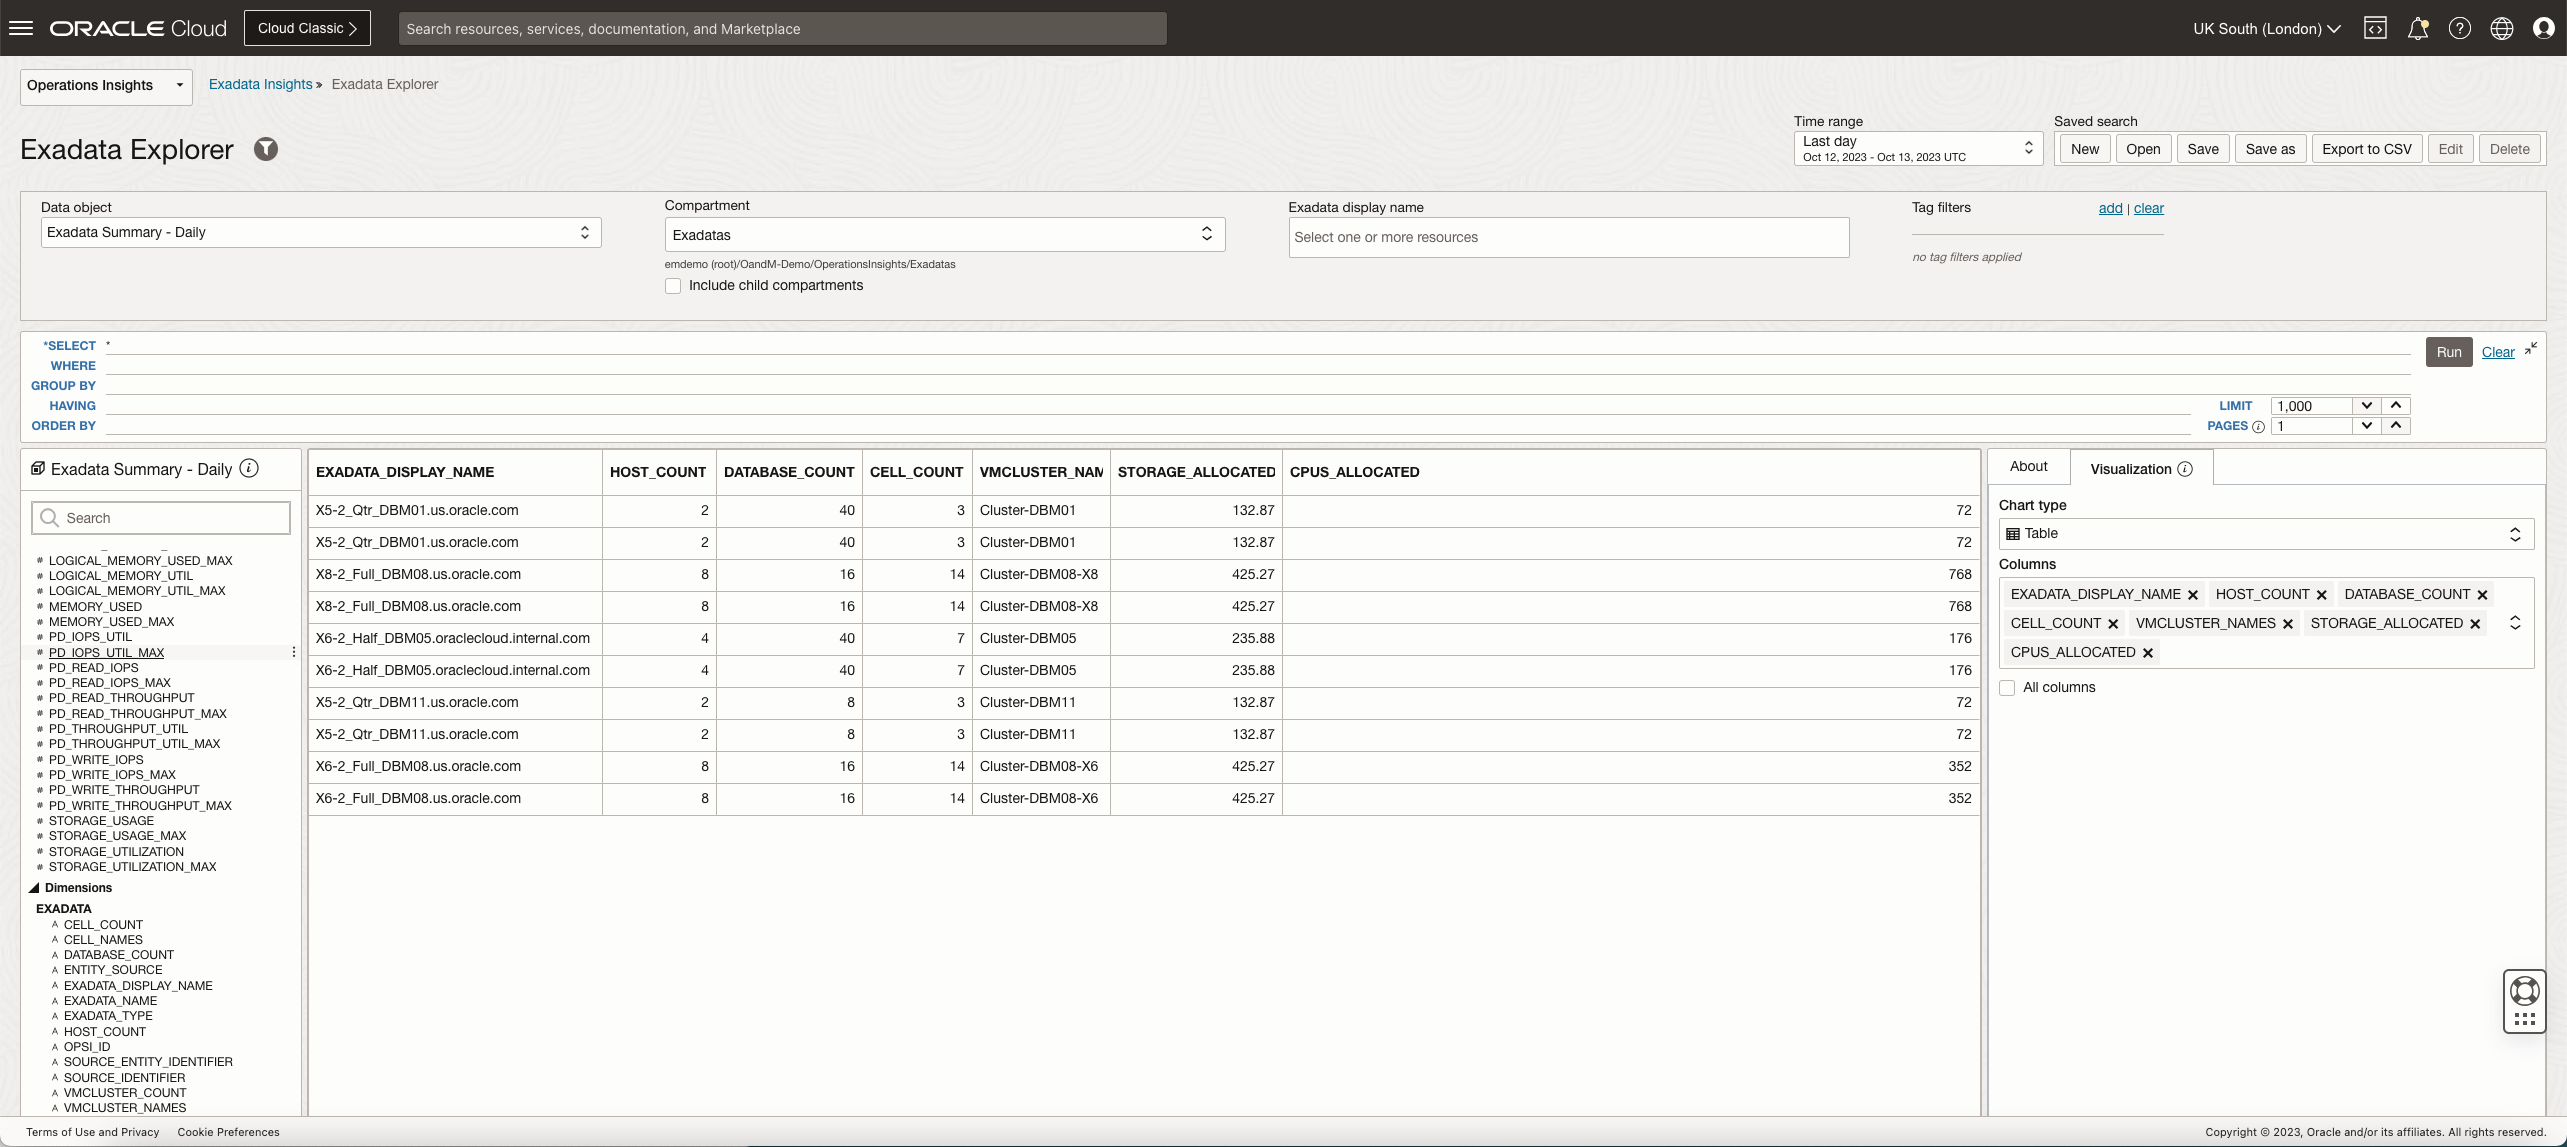
Exadata summary single view data object
Two new data objects, Exadata summary – daily and Exadata summary – hourly, have been added to encapsulate all of the Exadata system configuration settings and key performance metrics into a single view. These data objects allow for exploring dimensions such as the VM Cluster names and counts, storage server counts, server counts, database counts, CPUs allocation/usage/utilization, storage allocation/usage/utilization, among many more. See the example below for more details:
Host Capacity Planning for Ubuntu
Host Capacity Planning now supports the enabling and analysis of hosts running the Ubuntu operating system. Support is available for both external hosts via Management Agent and OCI Compute Instances via Oracle Cloud Agent.
New OCI cloud regions availability around the world
A region is a localized geographic area with one or more data centers located within a region. OCI has multiple cloud regions around the world to provide local access to cloud resources. The various OCI services are made available in various regions on a continuous basis. Operations Insights is now available in the below new regions:
| Realm | Region |
| OC1 | mx-monterrey-1 |
| OC19 | eu-madrid-2, eu-frankfurt-2 |
| OC10 | ap-dcc-canberra-1 |
New organization of technical resources
The landing page for all Operations Insights technical content has just gotten a new face lift! Note the new organization of the high level categories and easy access to all OPSI related resources. We have also introduced a brand new series of “How-to” videos with the new playlist Discover Oracle O&M: “How-to” Series, on the Oracle Cloud Observability and Management YouTube channel. Follow along and learn how to use key OPSI components and perform typical analysis tasks, among many others.
Additional Resources
For additional resources on these new features see:
- ADDM Spotlight provides strategic advice to optimize Oracle Database performance and how to enable full feature support for your Autonomous Databases
- Enable Cross-Service Dashboards.
- OCI Data Regions
Get started today!
Find OPSI under the Observability and Management menu in the Oracle Cloud Console. The service is accessible through the Console, CLI, and REST API and is already available in all commercial regions, with Government regions coming soon. OPSI is available to use with Autonomous Databases, external databases (Oracle Databases deployed on-premises), and Oracle Cloud Databases on bare metal, VMs, and Exadata Database Services on Dedicated Infrastructure and Exadata Cloud at Customer.
To test drive this feature and many other features in OPSI before even signing up for the service, try the demo mode or try it by signing up for Livelabs.
Not yet a customer? Sign up for an Oracle Cloud Infrastructure trial account!
To learn more about other Operations Insights capabilities, visit:
- Oracle Cloud Observability and Management Platform
- Explore Operations Insights
- Hands-on lab: Get Started with Oracle Cloud Infrastructure Operations Insights
- Operations Insights Videos
- Operations Insights Technical Content
- Integrating Enterprise Manager with OCI Services
- Pricing
- Oracle Cloud Observability and Management Platform
- OPSI Technical Content
For more blogs on OPSI, visit the Observability and Management – OPSI blog space.