Guest Authors:
Senior WAF engineer
Senior WAF engineer
We are happy to present a new way of getting additional security insights using two existing Oracle Cloud Infrastructure (OCI) services: OCI Web Application Firewall (WAF) enforcement on the flexible load balancer and OCI Logging Analytics. Combining these two OCI services will provide detailed traffic analysis of your web application and real-time information about triggered countermeasures to address the findings which you have setup in WAF.
Traffic Analysis for web applications and real-time information with OCU Web Application Firewall
Initial Setup
Create a WAF policy & attach it to OCI Load Balancer (LB). Be sure to have an up-to-date OCI command line interface (CLI) installed & fully configured on your machine. More information about the installation process can be found in the OCI CLI Quickstart guide.
Implementation & Flow Logic
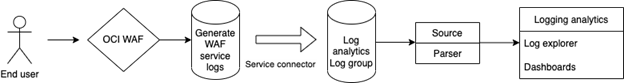
The diagram above represents how a request from an end user will end up being displayed in Logging Analytics. There are a few steps that need to be accomplished in order to send WAF service logs to Logging Analytics to better identify the findings you have set up in WAF:
- Manually enable the WAF service logs
- Create a Logging Analytics log group
- Create a service connector that will send WAF service logs to the Logging Analytics Log group, which includes a currently available parser.
Step by step setup
Here are the setup details:
1. Manually enable the WAF service logs.
To enable WAF service logs, you simply need to enable them under in the OCI WAF interface by following these steps:
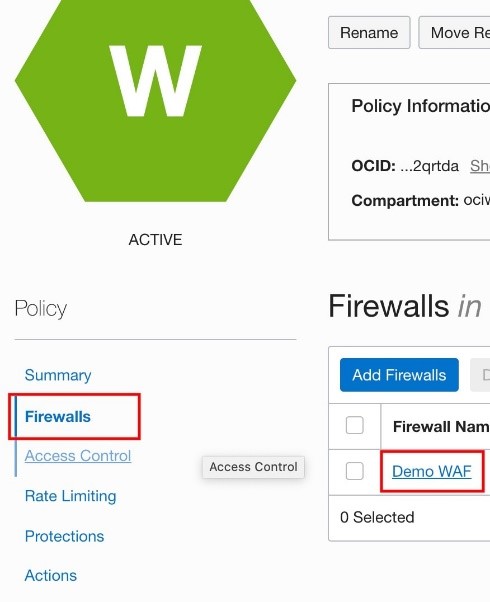
- Open your WAF policy.
- Click “Firewalls”.
- Open up your firewall by clicking on the name.
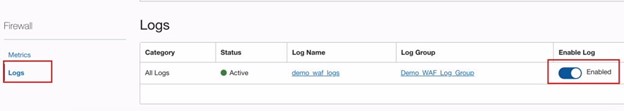
- Click on “Logs”.
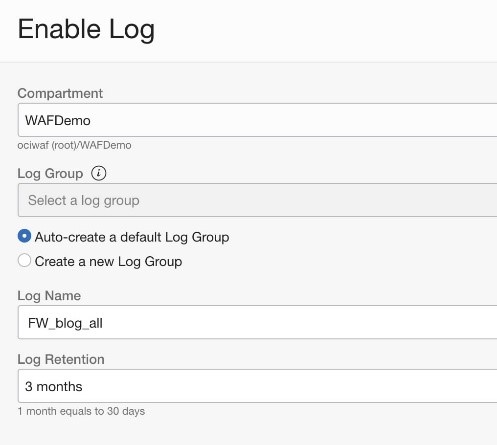
- Change state of “Enable Log”. It will ask to fill few details about the WAF service logs group including: Name, compartment, log retention period.
2. Create Logging Analytics log group.
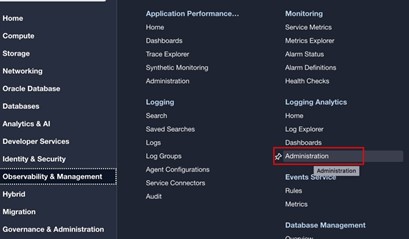
Next, you will need to set up the Logging Analytics log group to be able to store your WAF policy service logs. Logging Analytics is part of the Observability and Management section of OCI.
- From the main menu in OCI Console, navigate to Observability & Management → Logging Analytics → Administration
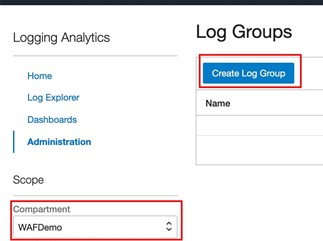
- On the left hand side under “Resources”, select “Log Group” and click on “Create a new Log Group”. Type a Name & Description (Optional). Make sure the Log Group is in the correct compartment.
3. Create a service connector which will send WAF service logs to Logging Analytics.
Once the OCI WAF and OCI Logging Analytics have been set up, a service connector is needed to transfer data (logs) between these two OCI services.
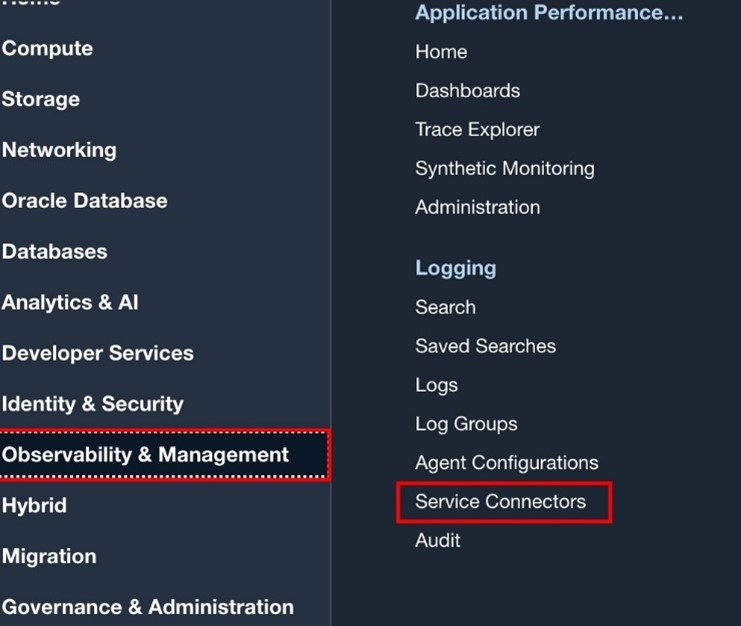
- From main menu in OCI Console, navigate to Observability & Management → Logging → Service connectors.
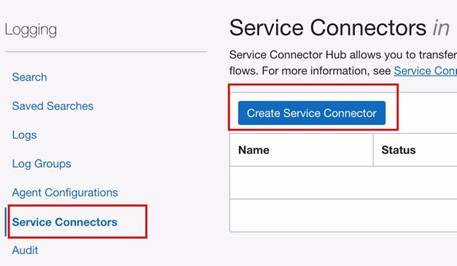
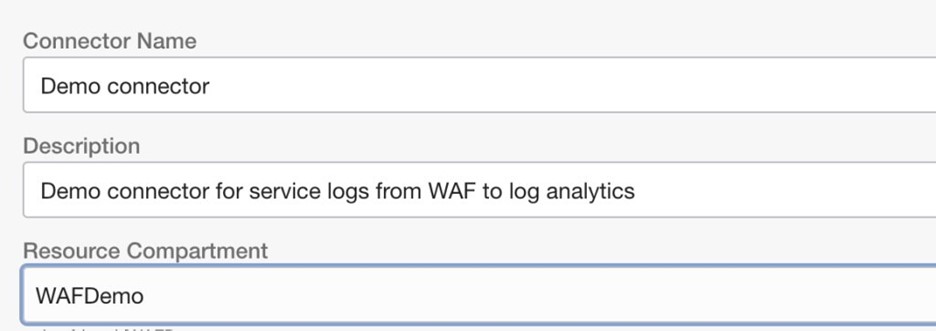
- Click “Create Service Connector.
- Fill in “Name”, “Description” & select required compartment.
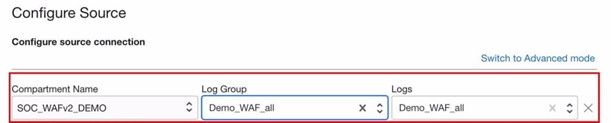
- Scroll down to “Configure Service Connector”. For “Source” select “Logging”. For “Target” select “Logging Analytics”.
- Scroll next until “Configure source”. Select compartment where we enabled WAF service logs in Step 1 along with Log group & Logs.
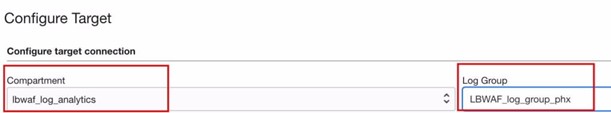
- Next is “Configure target”. Select the compartment where you created the Log Group for Logging Analytics (see Step 2)
Lastly, click “Create” for “Create default policy allowing this service connector to write to Logging Analytics in compartment”

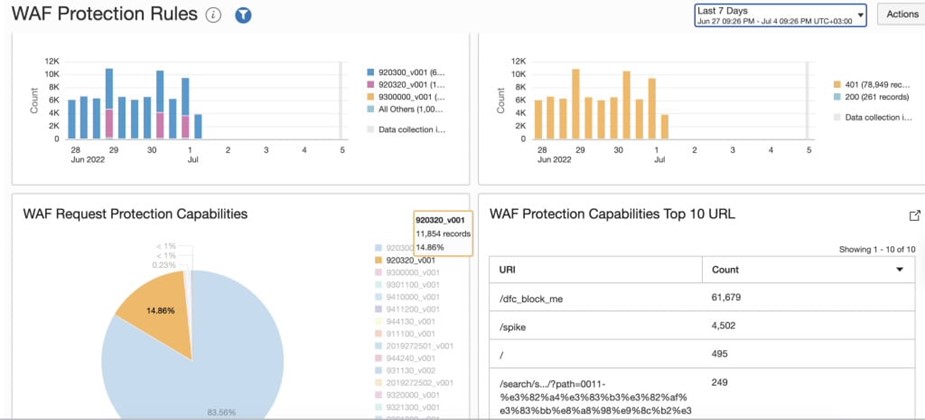
4. Use predefined WAF Dashboards.
To help visualize your data, take a look at some predefined dashboards. This set includes three pre-built dashboards for WAF Logging Analytics as follows:
- WAF Overview
- WAF Protection Rules
- WAF Access rules & Rate limiting
How do you import the predefined Dashboards?
- Save this zip file to your local system.
- Extract the content of ZIP archive & open each individual file, find all occurrences of “compartment-id”: “COMPARTMENT_ID” and replace “Compartment_ID” with your compartment ocid. In the end it should look like “compartment-id”: “ocid1.compartment.oc1..xxxxxxxxxx”
- Open up an OCI CLI and run:
oci management-dashboard dashboard import --from-json file://WAF_Access_rule_and_Rate_limiting.json
file:// represents the path to where the file is saved. If the current terminal is already in folder where the JSON files are, no need to provide the full path. Do the same for the other two JSON files by changing the file name. - If the import went without any errors, you should now be able to see three dashboards under Logging Analytics → Dashboards in your compartment. Here is how they should look like:
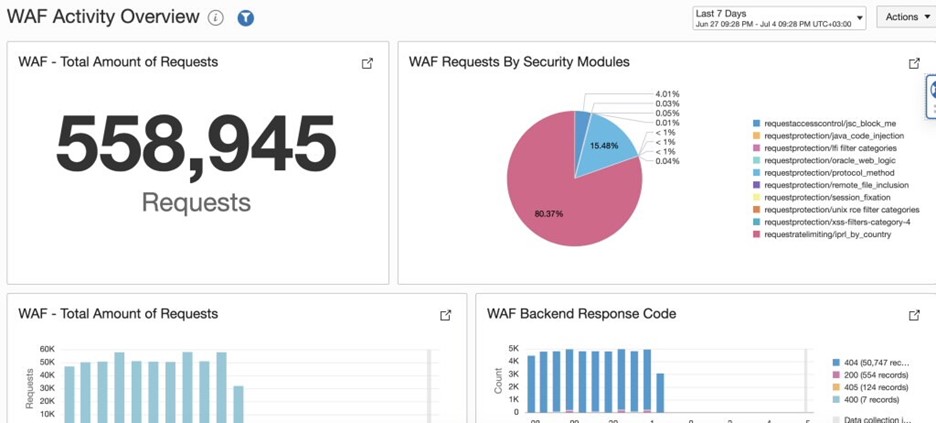
Now everything is in place & the WAF service logs are being sent to OCI Logging Analytics!
With the dashboards provided in this blog, you can take advantage of the features they provide and take a look at your traffic from different angles. Additionally, you can check which WAF rules are triggered the most, adjust protection capabilities based on summary and see potential malicious behavior with real-time feed. Lastly, not only WAF protection capabilities are monitored,but Access rules and rate limiting are monitored as well.
We strongly encourage you to take the opportunity and test it out yourself, either with your current account or the OCI free-tier.
Additional links:
- Oracle Cloud Infrastructure Web Application Firewall (OCI WAF)
- Oracle Cloud Infrastructure Logging Analytics
- Oracle Cloud Infrastructure Free Tier