The Oracle Cloud Infrastructure Application Performance Monitoring (APM) provides a comprehensive set of features to monitor applications and diagnose performance issues. The service provides deep visibility into the performance of applications and provides the ability to diagnose issues quickly in order to deliver a consistent level of service. This includes the monitoring of the multiple components and application logic spread across clients, third-party services, and back-end computing tiers, on-premises or on the cloud.
Here’s a diagram that provides an overview of the APM service in Oracle Cloud Infrastructure, its features and components, and the other Oracle Cloud Infrastructure services it works with:
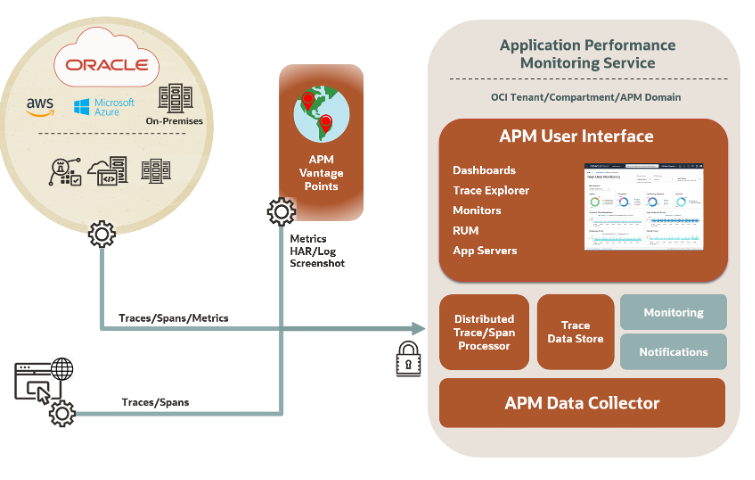
Figure 1: APM Monitoring Diagram
APM can be used not only to monitor cloud-native environments but can also be used to monitor applications running in Compute on Oracle Cloud Infrastructure, on-premises, or any other public cloud. In this blog post, we’ll discuss how to use APM to monitor JD Edwards environment running on-premises.
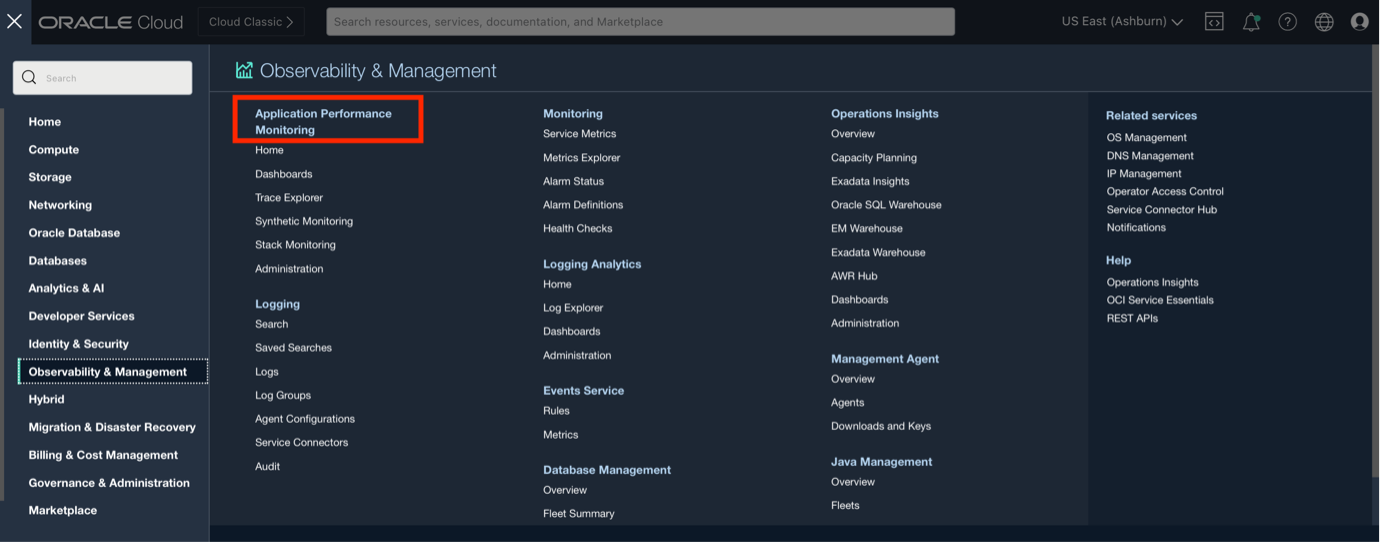
APM can be accessed from the Oracle Cloud Console under Observability and Management.
Here are the steps to enable APM for monitoring an application:
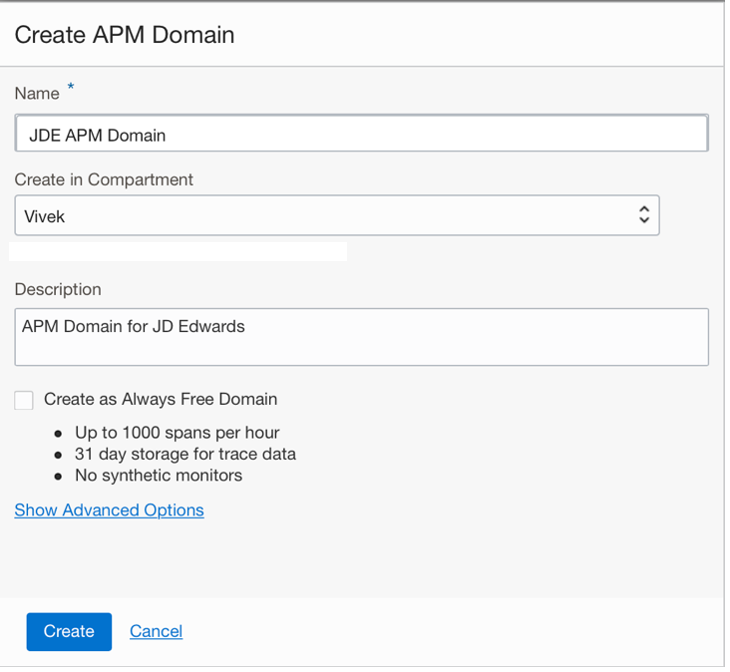
Create APM Domain to initiate monitoring in OCI
To start using Application Performance Monitoring create an APM Domain. An APM domain is an Oracle Cloud Infrastructure resource, which contains the systems being monitored by APM. To create an APM Domain, on the Administration page, in the left pane, select the compartment in which you want to create the APM domain. On the Create APM Domain page, click Create.
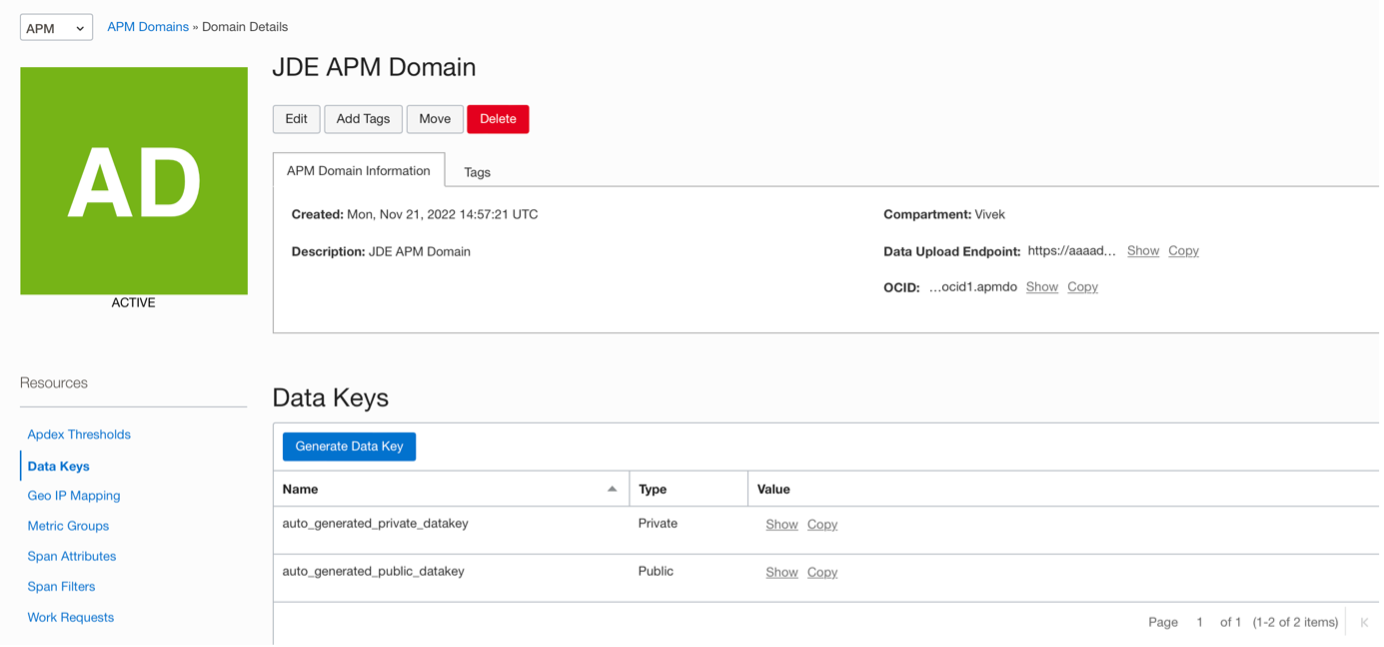
The APM domain is displayed on the APM Domains page and initially is in the Creating state. After the APM domain is created, the state changes to Active.
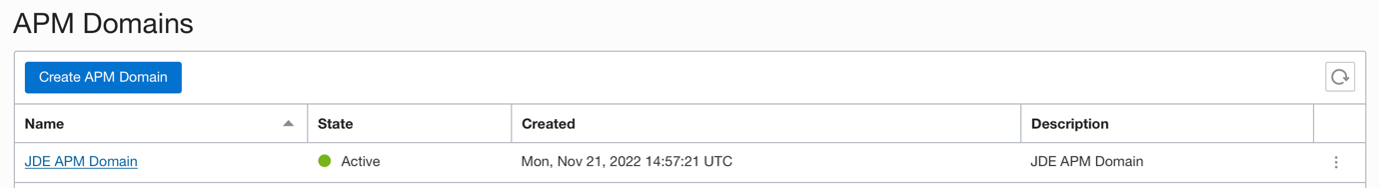
Once the APM Domain has been created, click on it to see the details:
Provision and Deploy APM Java Agents on Application Servers
The APM Java agent records application server spans and metrics from application servers or JVMs and sends them to Application Performance Monitoring. Download the APM Java Agent and install it on the Application Servers.
In our case, to deploy the agent on JDE Application Server, update the setDomainEnv.sh for WebLogic for JD Edwards. Edit the $JAVA_OPTIONS and set -javaagent option to the APM Java Agent install folder. For example:
export JAVA_OPTIONS=”$JAVA_OPTIONS -javaagent:/u01/apm_agent/oracle-apm-agent/bootstrap/ApmAgent.jar”
After updating setDomainEnv.sh, bounce the Weblogic Server.
Configure Automatic Injection in the APM Agent
After the APM Java agent is deployed, enable the automatic browser injection by doing the following:
Under the agent installation directory, update AgentConfig.properties file values
com.oracle.apm.agent.rum.enable.injection=true
com.oracle.apm.agent.public.data.key=<public_data_key>
com.oracle.apm.agent.rum.service.name=<JDE_Service_name>
For example:
com.oracle.apm.agent.rum.enable.injection=true
com.oracle.apm.agent.service.name=APM_JDE92
com.oracle.apm.agent.data.upload.endpoint=https://aaaadbe2wgnamaaaaaaaaabwo4.apm-agt.us-ashburn-1.oci.oraclecloud.com
com.oracle.apm.agent.private.data.key=EO2LCGQYJACAYLQSUSLKA7K3OIZSIJEV
com.oracle.apm.agent.public.data.key=6VA33CMBTCRJBICVUA4EY67VQSHA6CY7
APM Trace Explorer helps view traces and spans to identify performance issues
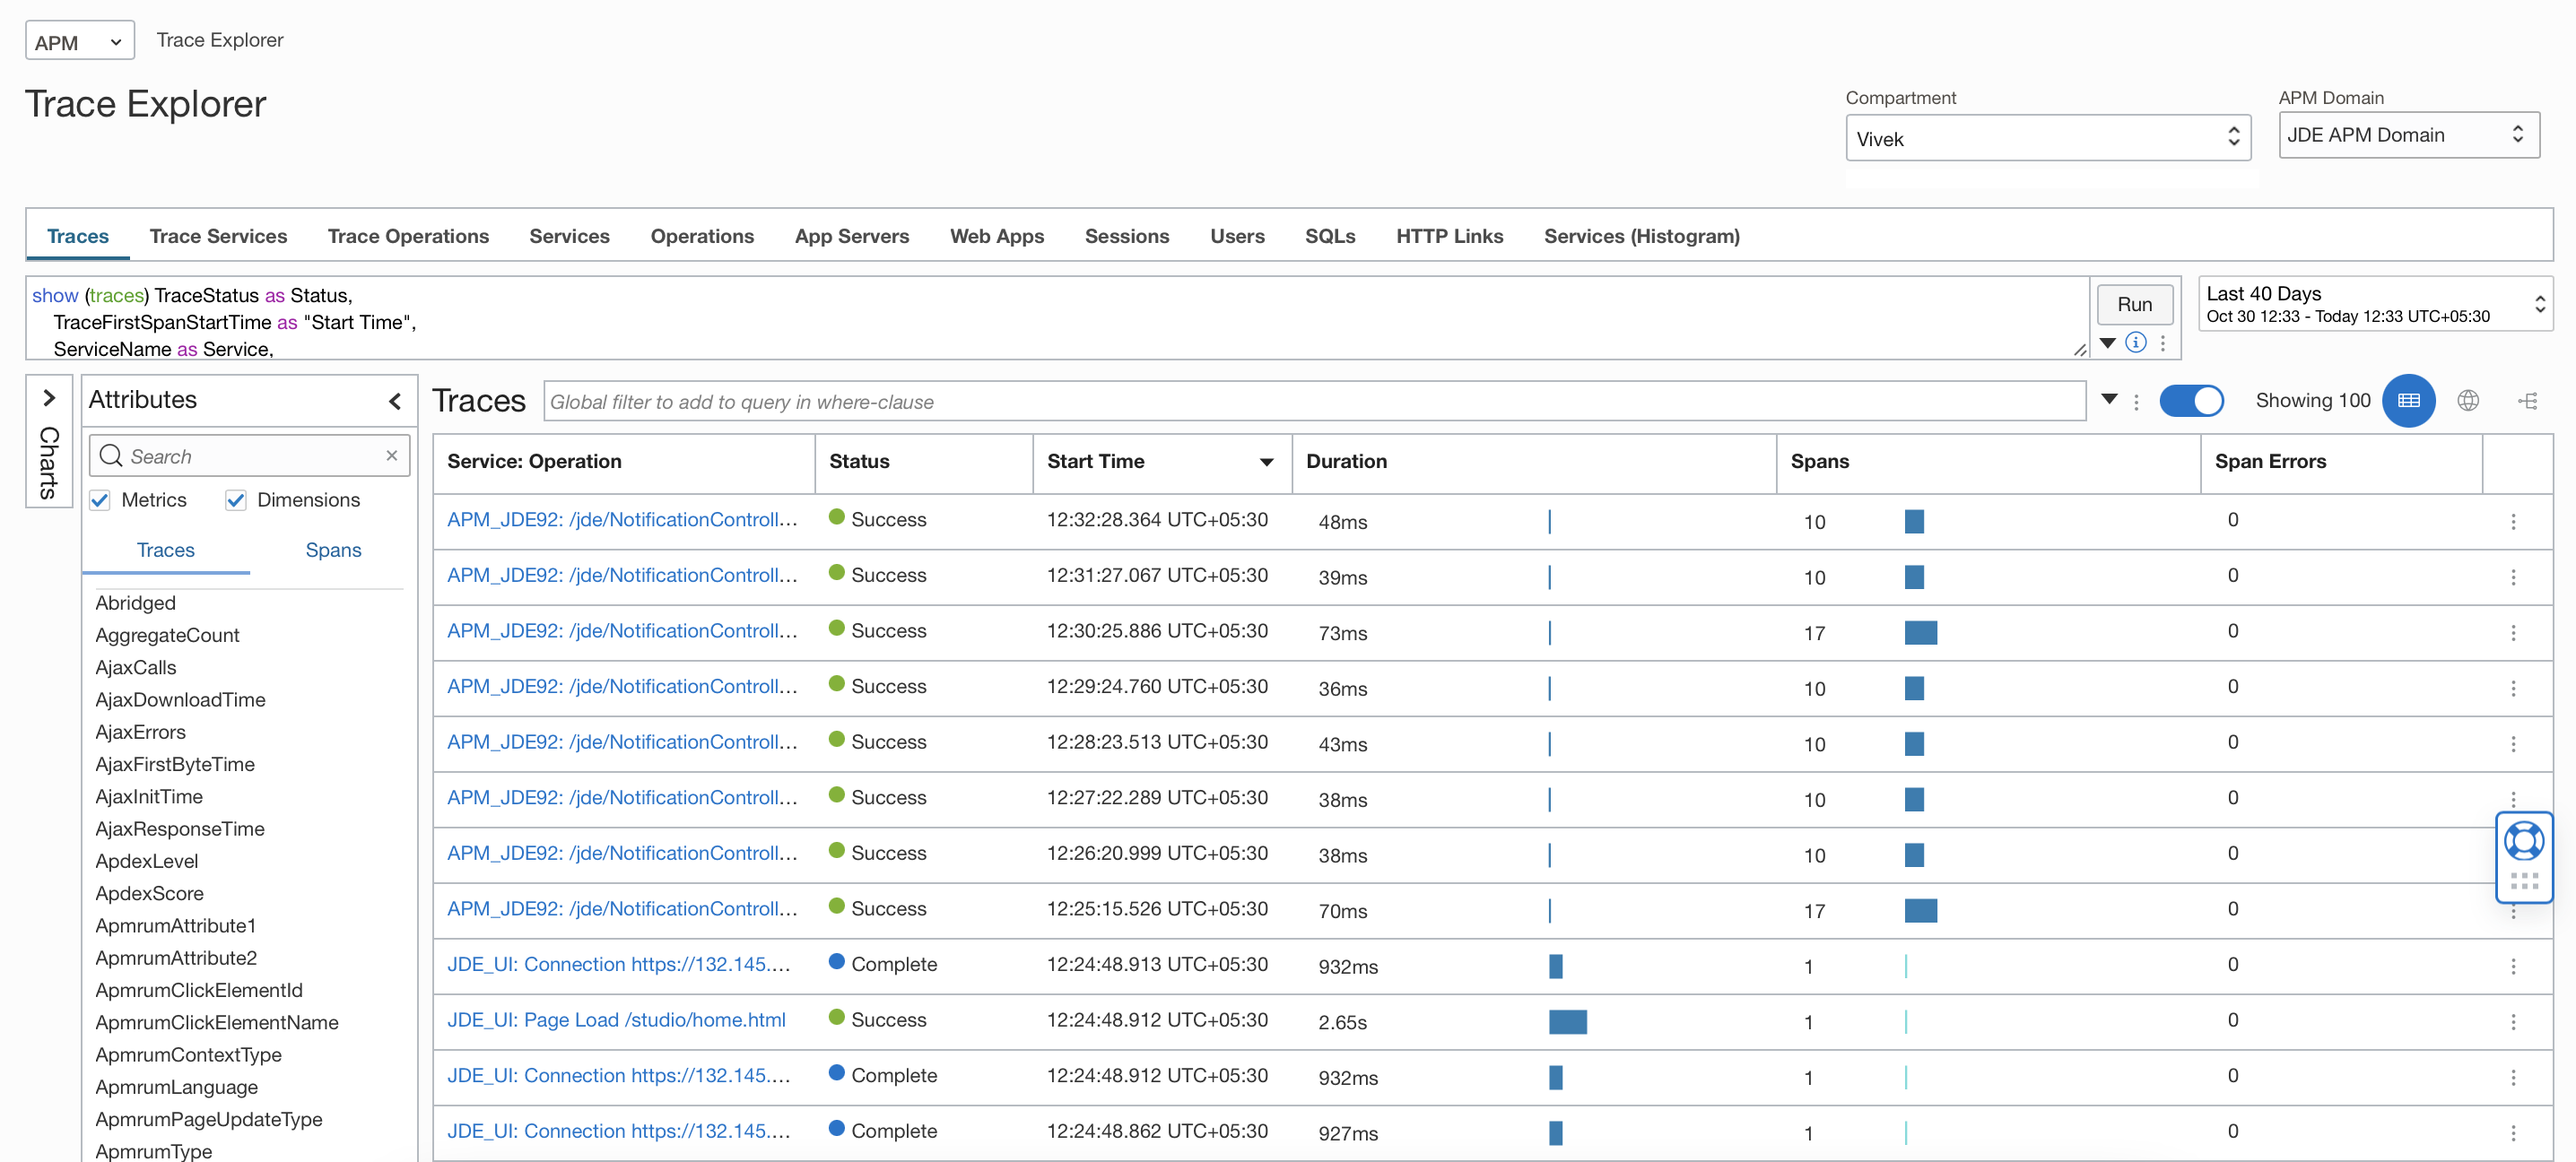
Trace Explorer can be used to view traces and spans and identify performance issues and bottlenecks in your monitored application, from browser to database.
After trace data is uploaded, Trace Explorer enables you to explore traces for diagnostics and ensures visibility into all spans in all traces at all times. It provides the use of a simple query language that enables you to find, sort, and group spans. You can use Trace Explorer to:
• Monitor individual traces, view their details, and analyze large sets of traces and spans to identify trends and anomalies.
• Detect slow traces, traces with errors, and those using a specific server or data source.
Drill down into specific spans, such as page loads and AJAX calls to isolate and identify issues:
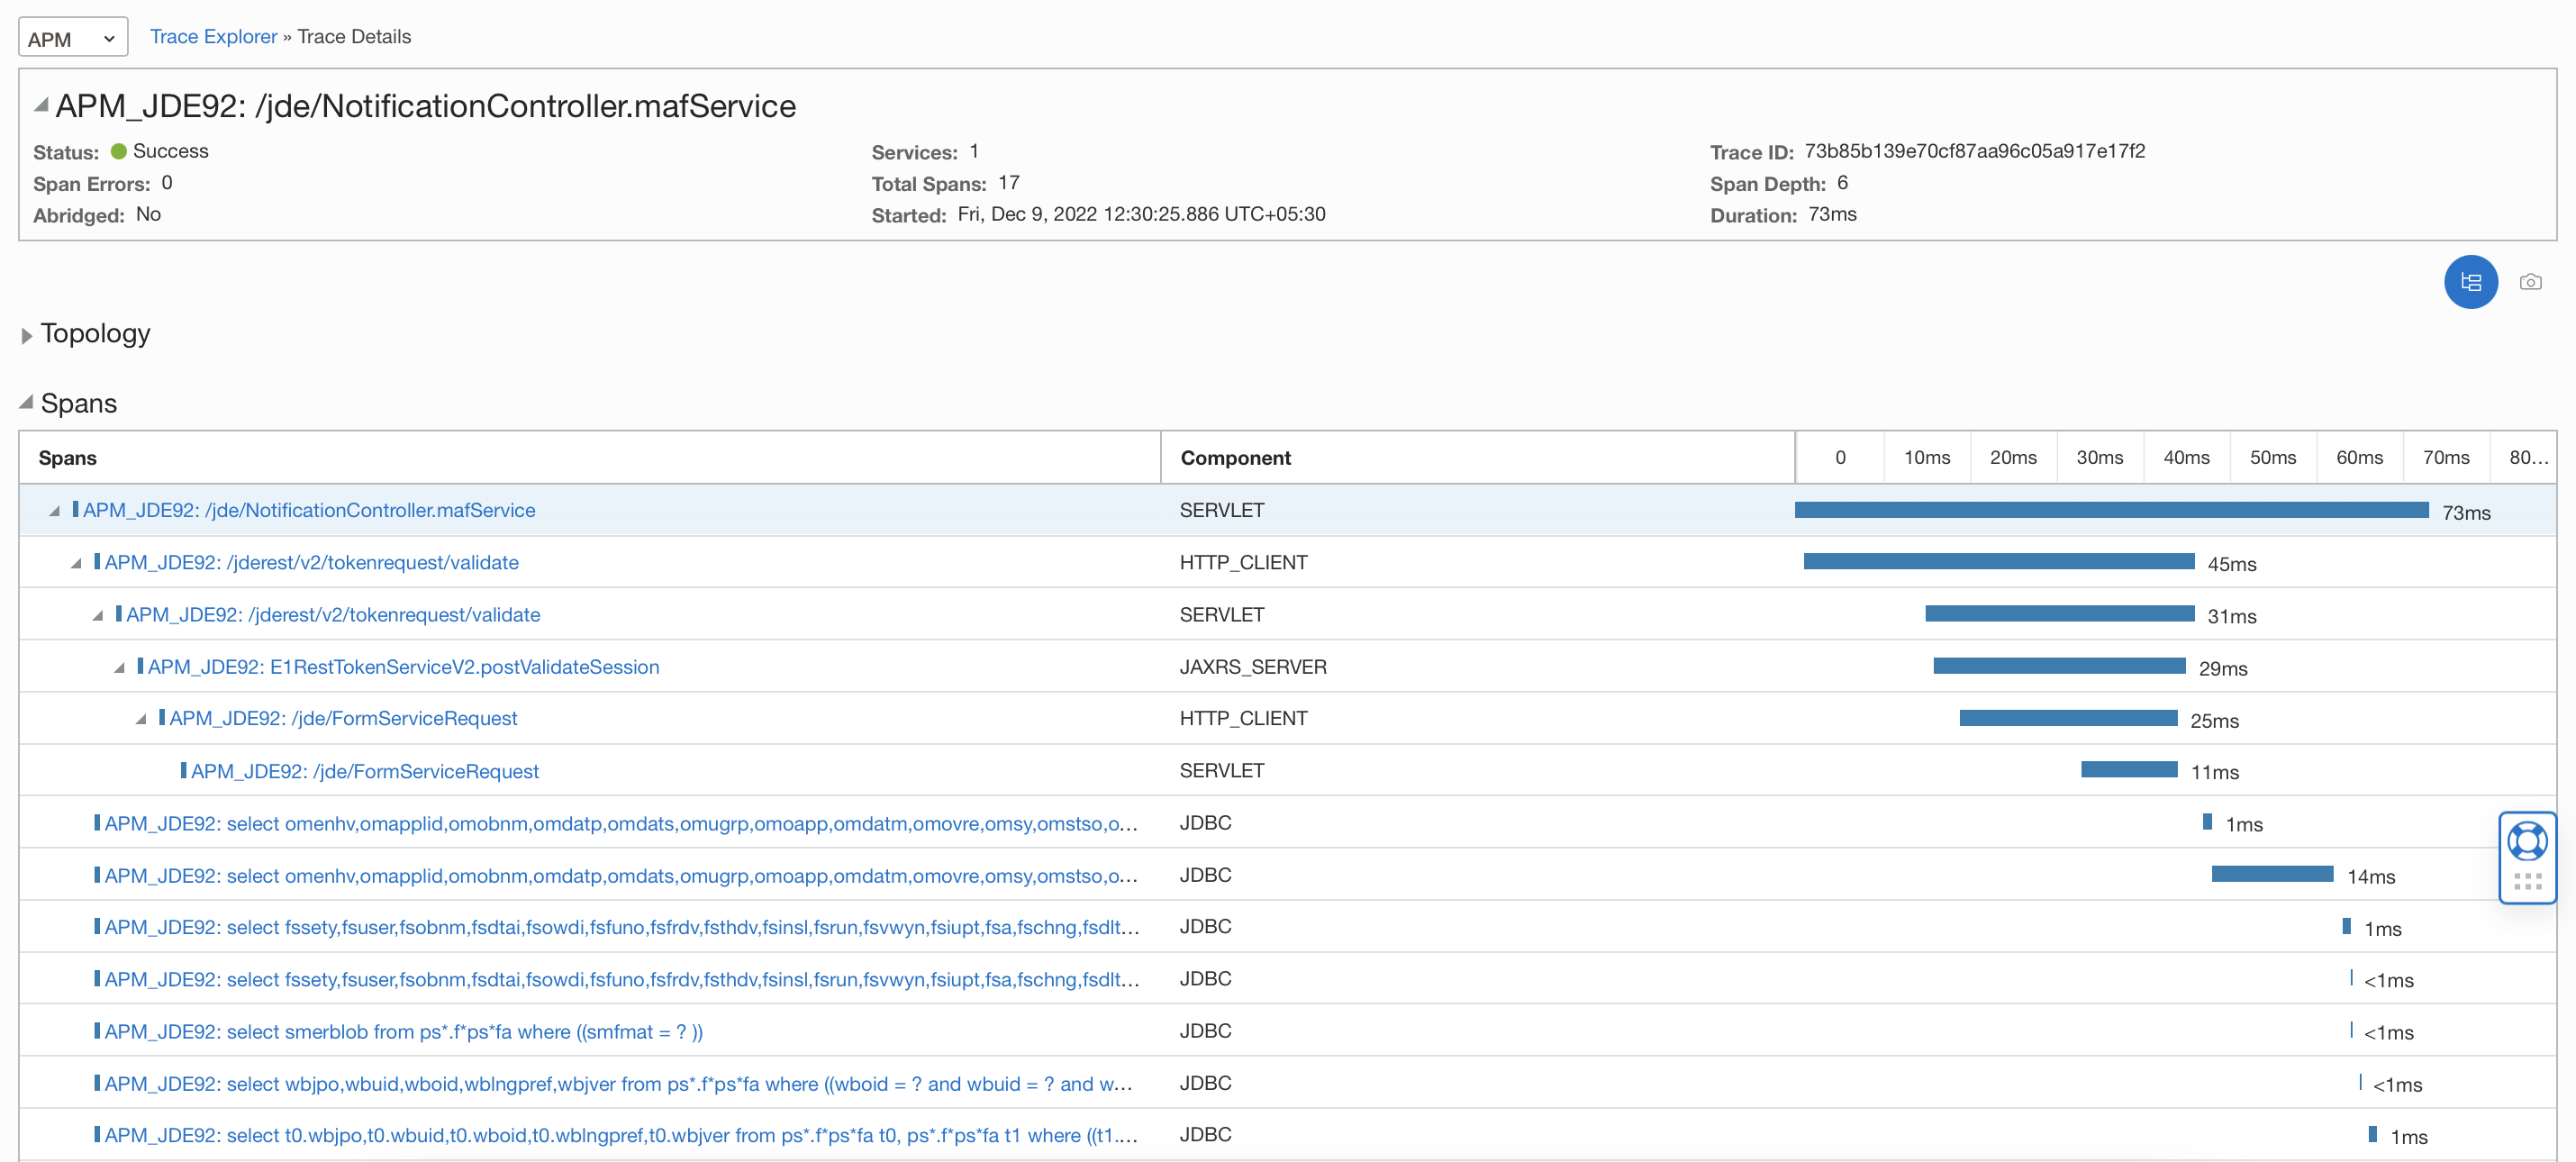
Click on a specific Trace to get its details:
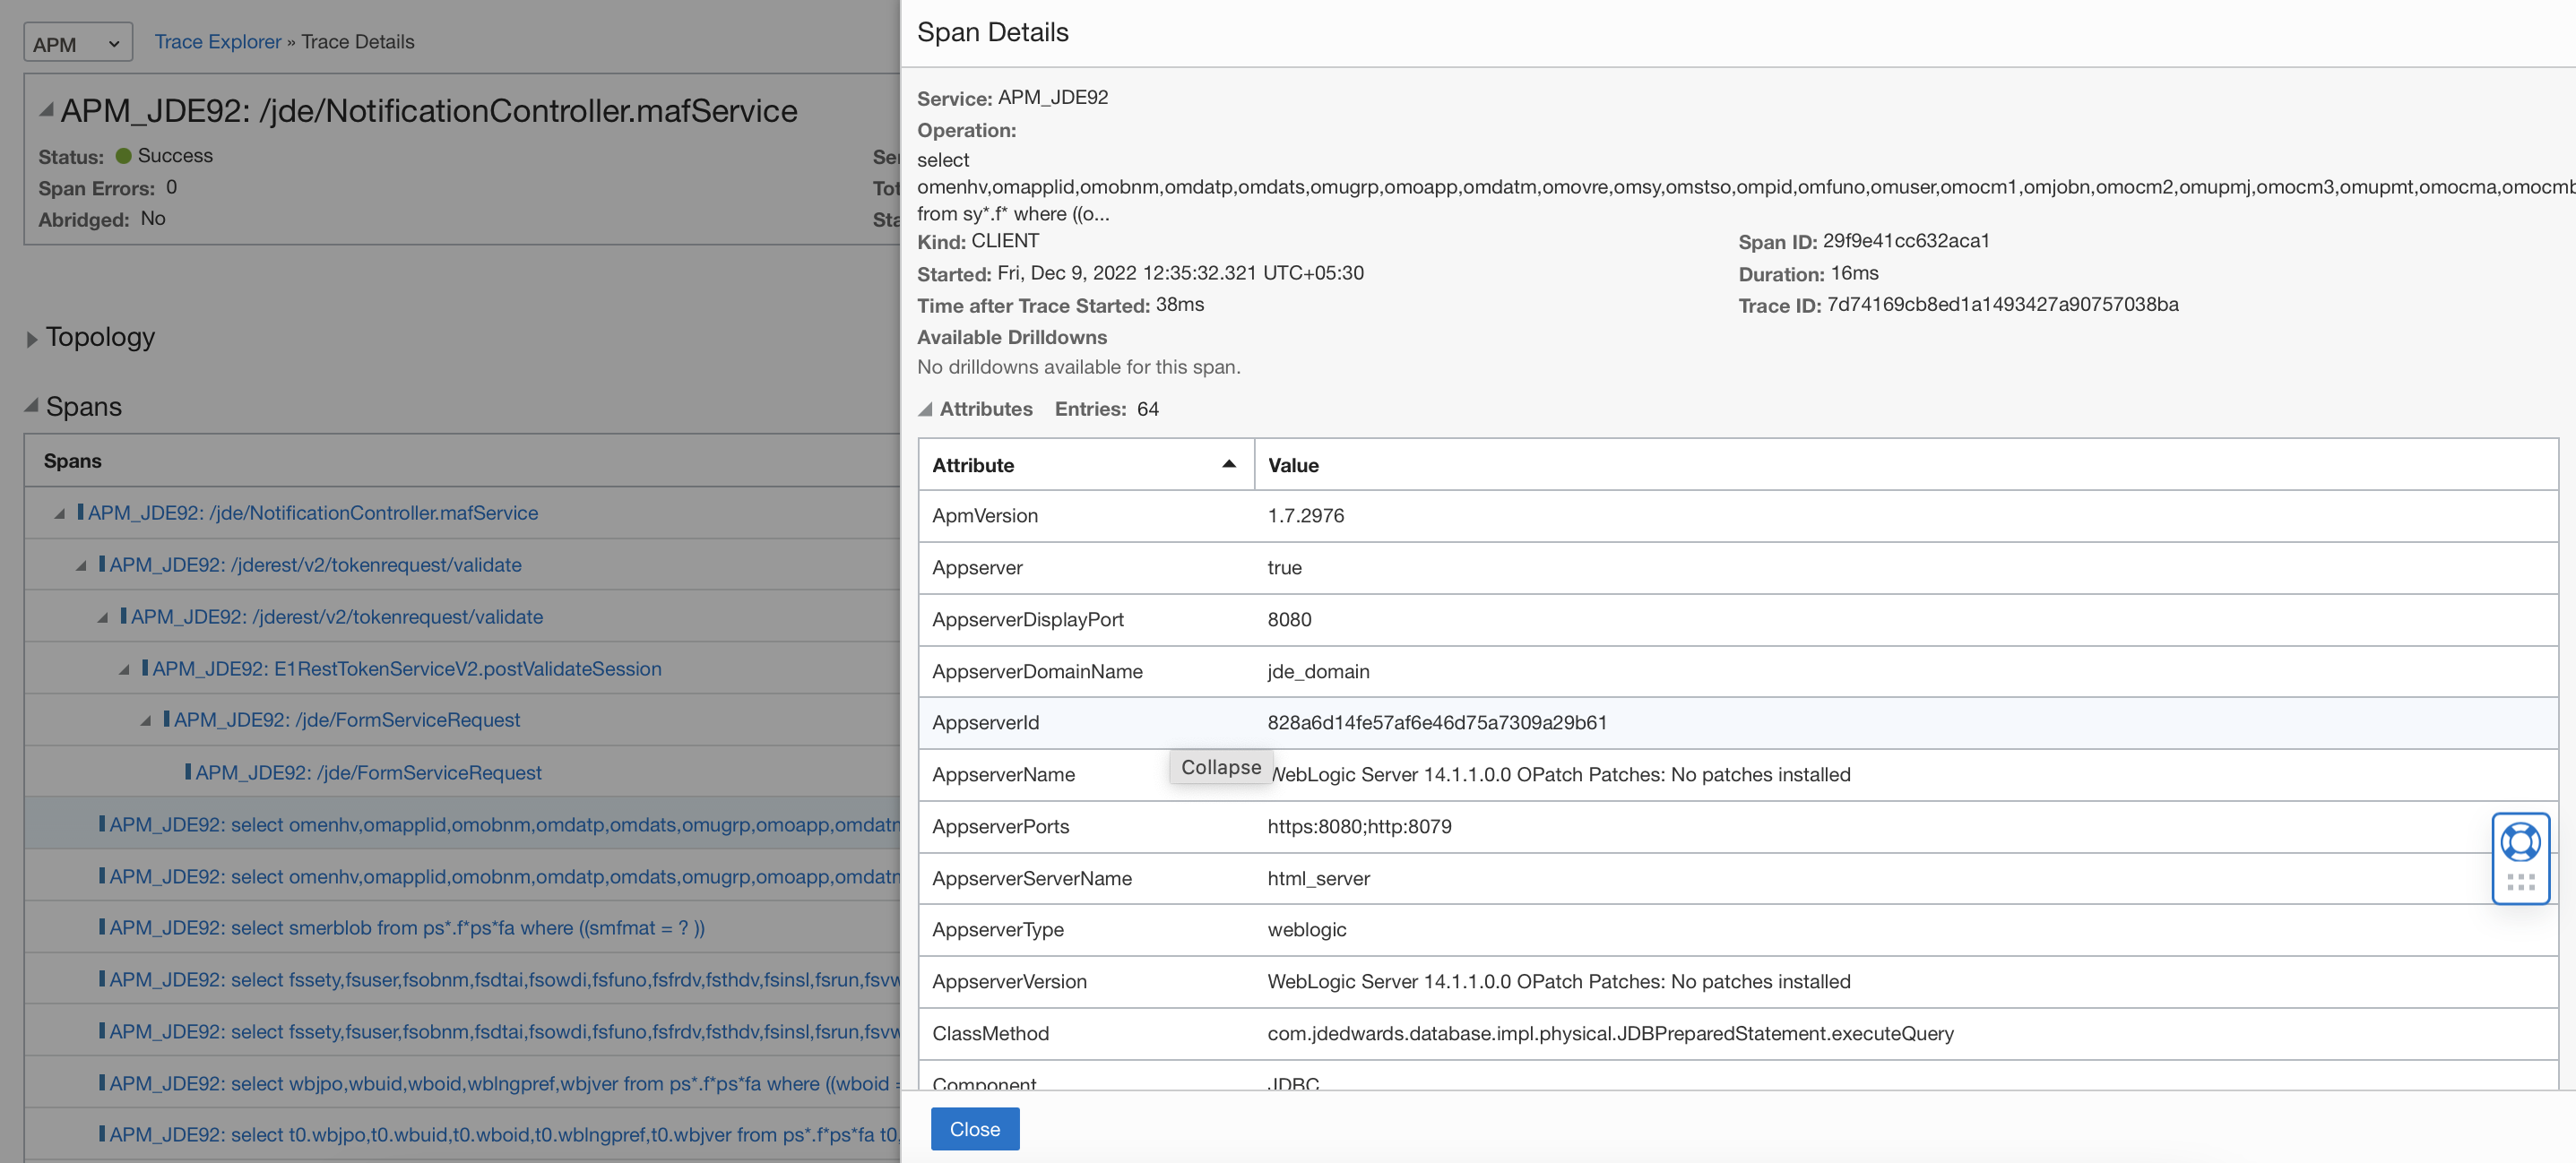
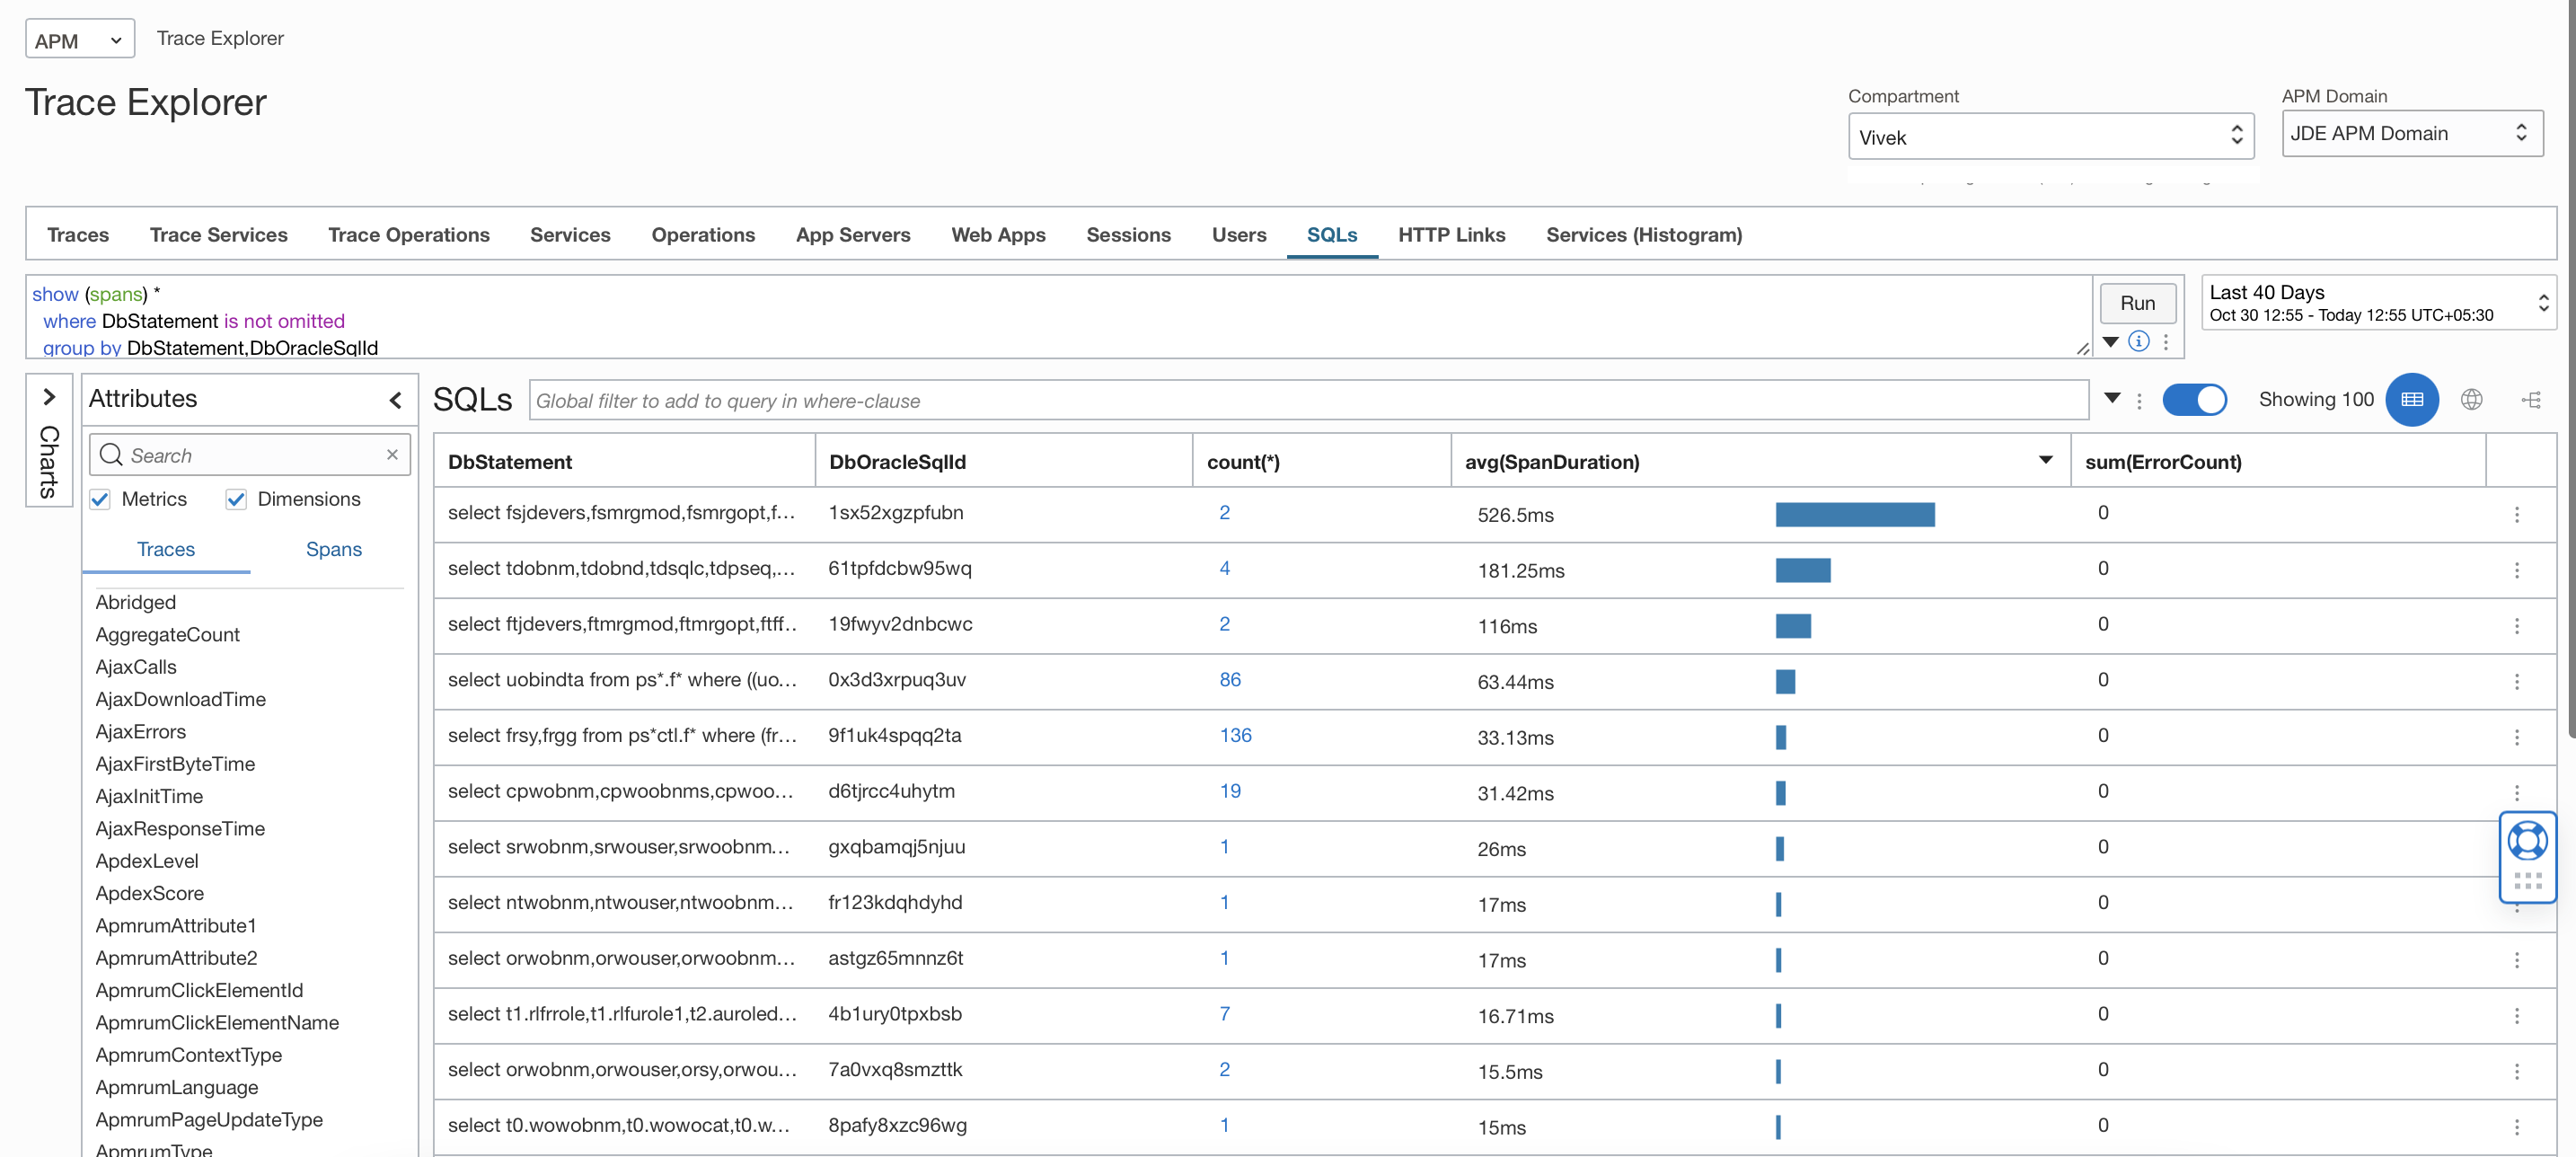
Check for the SQLs under SQLs Tab:
APM Dashboards
The Oracle-defined dashboards for Application Performance Monitoring provide insights into the key elements of your application during a selected period of time.
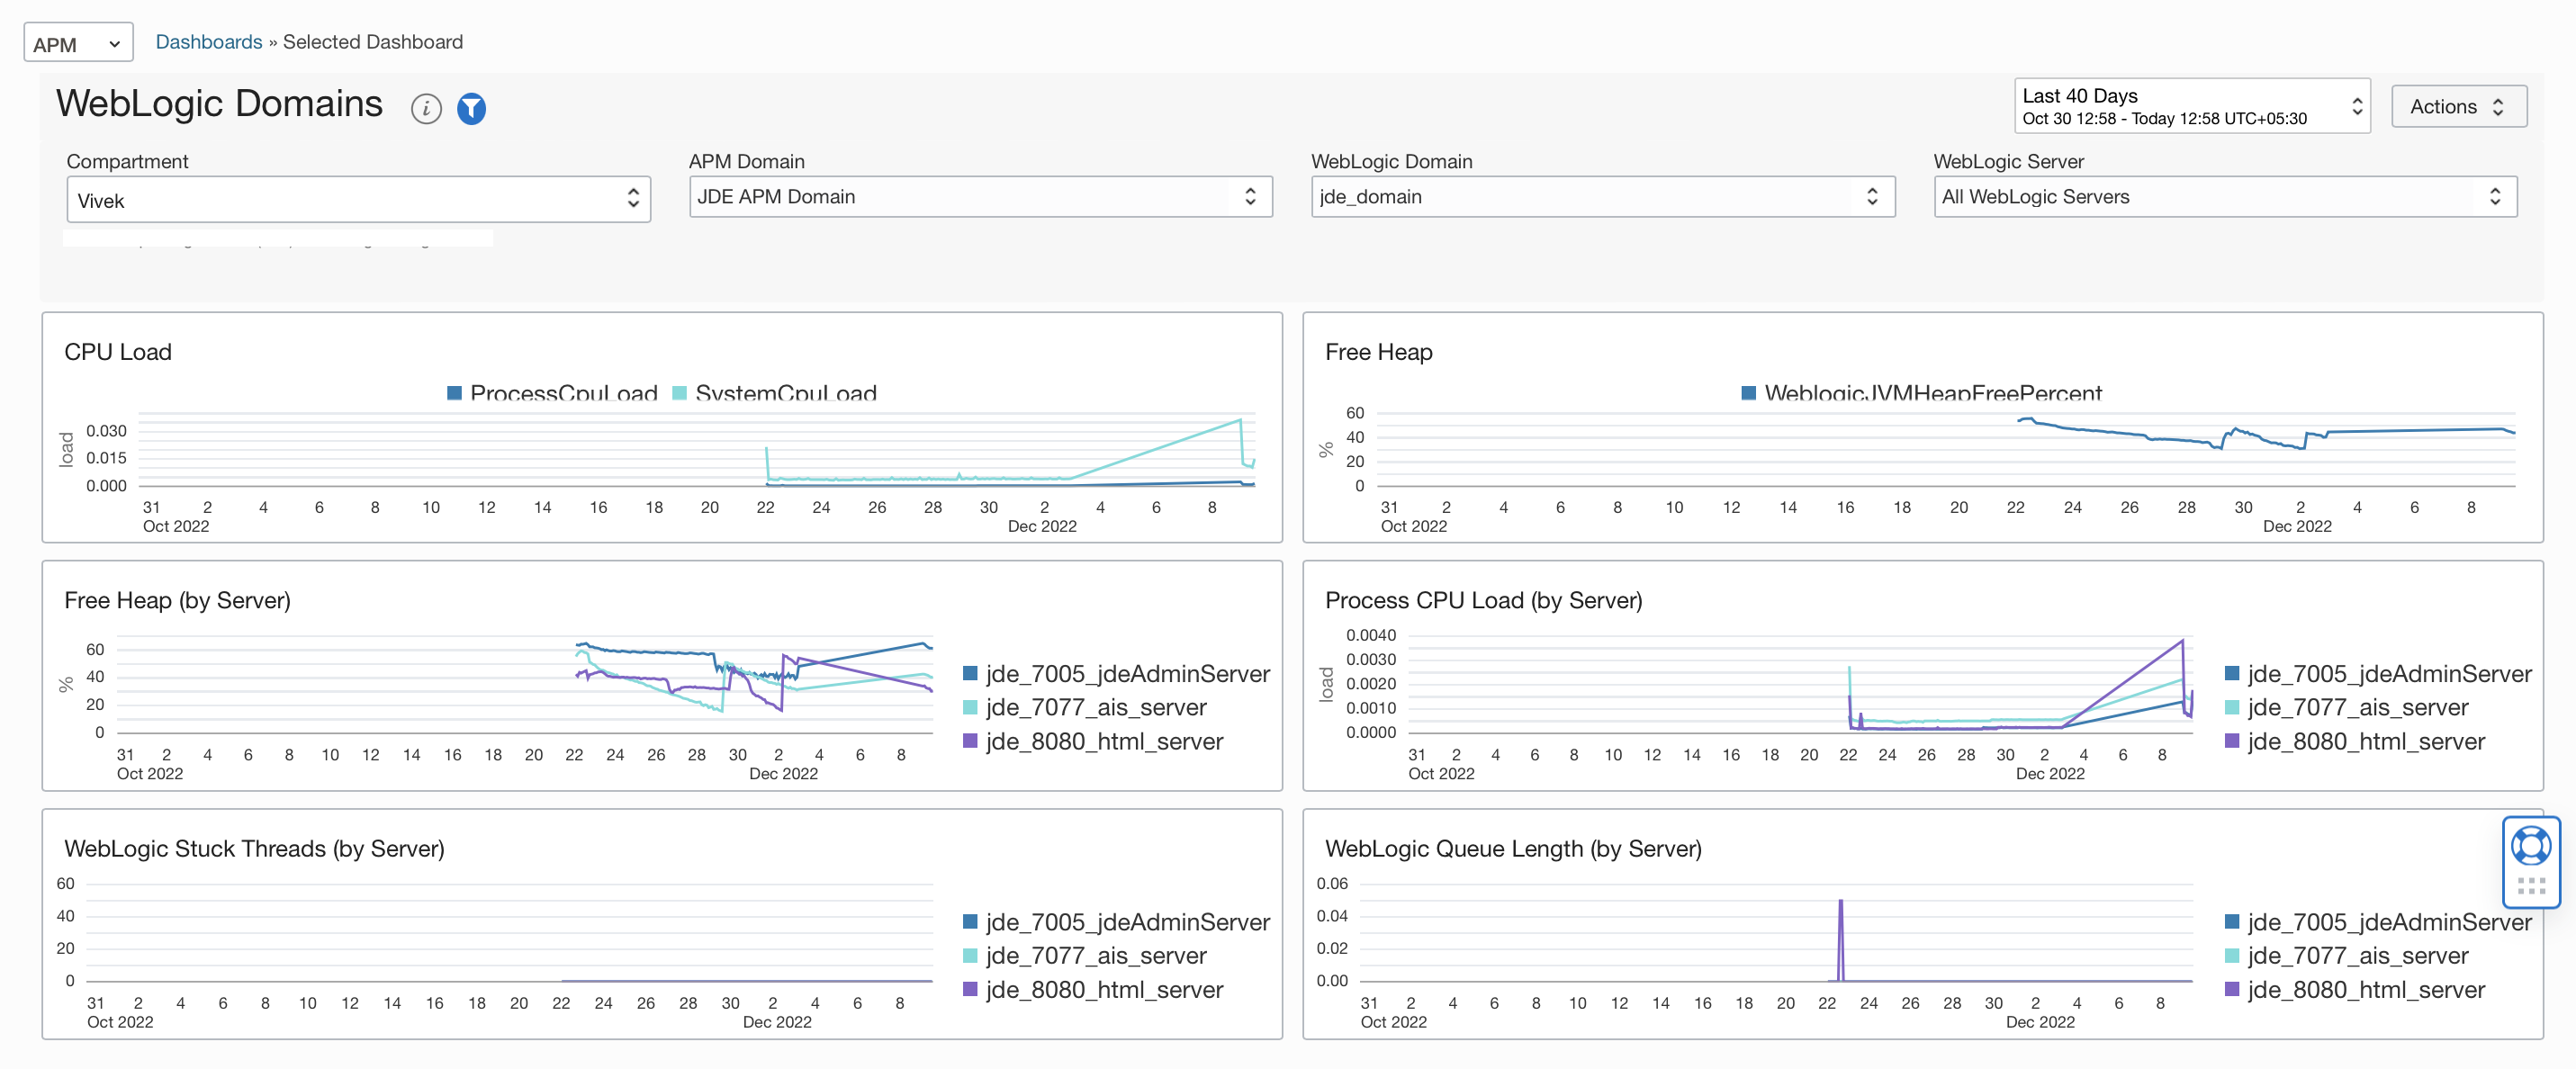
The WebLogic Domains dashboard provides an overview of the WebLogic metrics and enables you to monitor the performance of the administration and managed servers in the Oracle WebLogic Server. In this dashboard, select a WebLogic domain and a server that belongs to the domain and monitor the CPU load, free heap percentage, and other metrics.
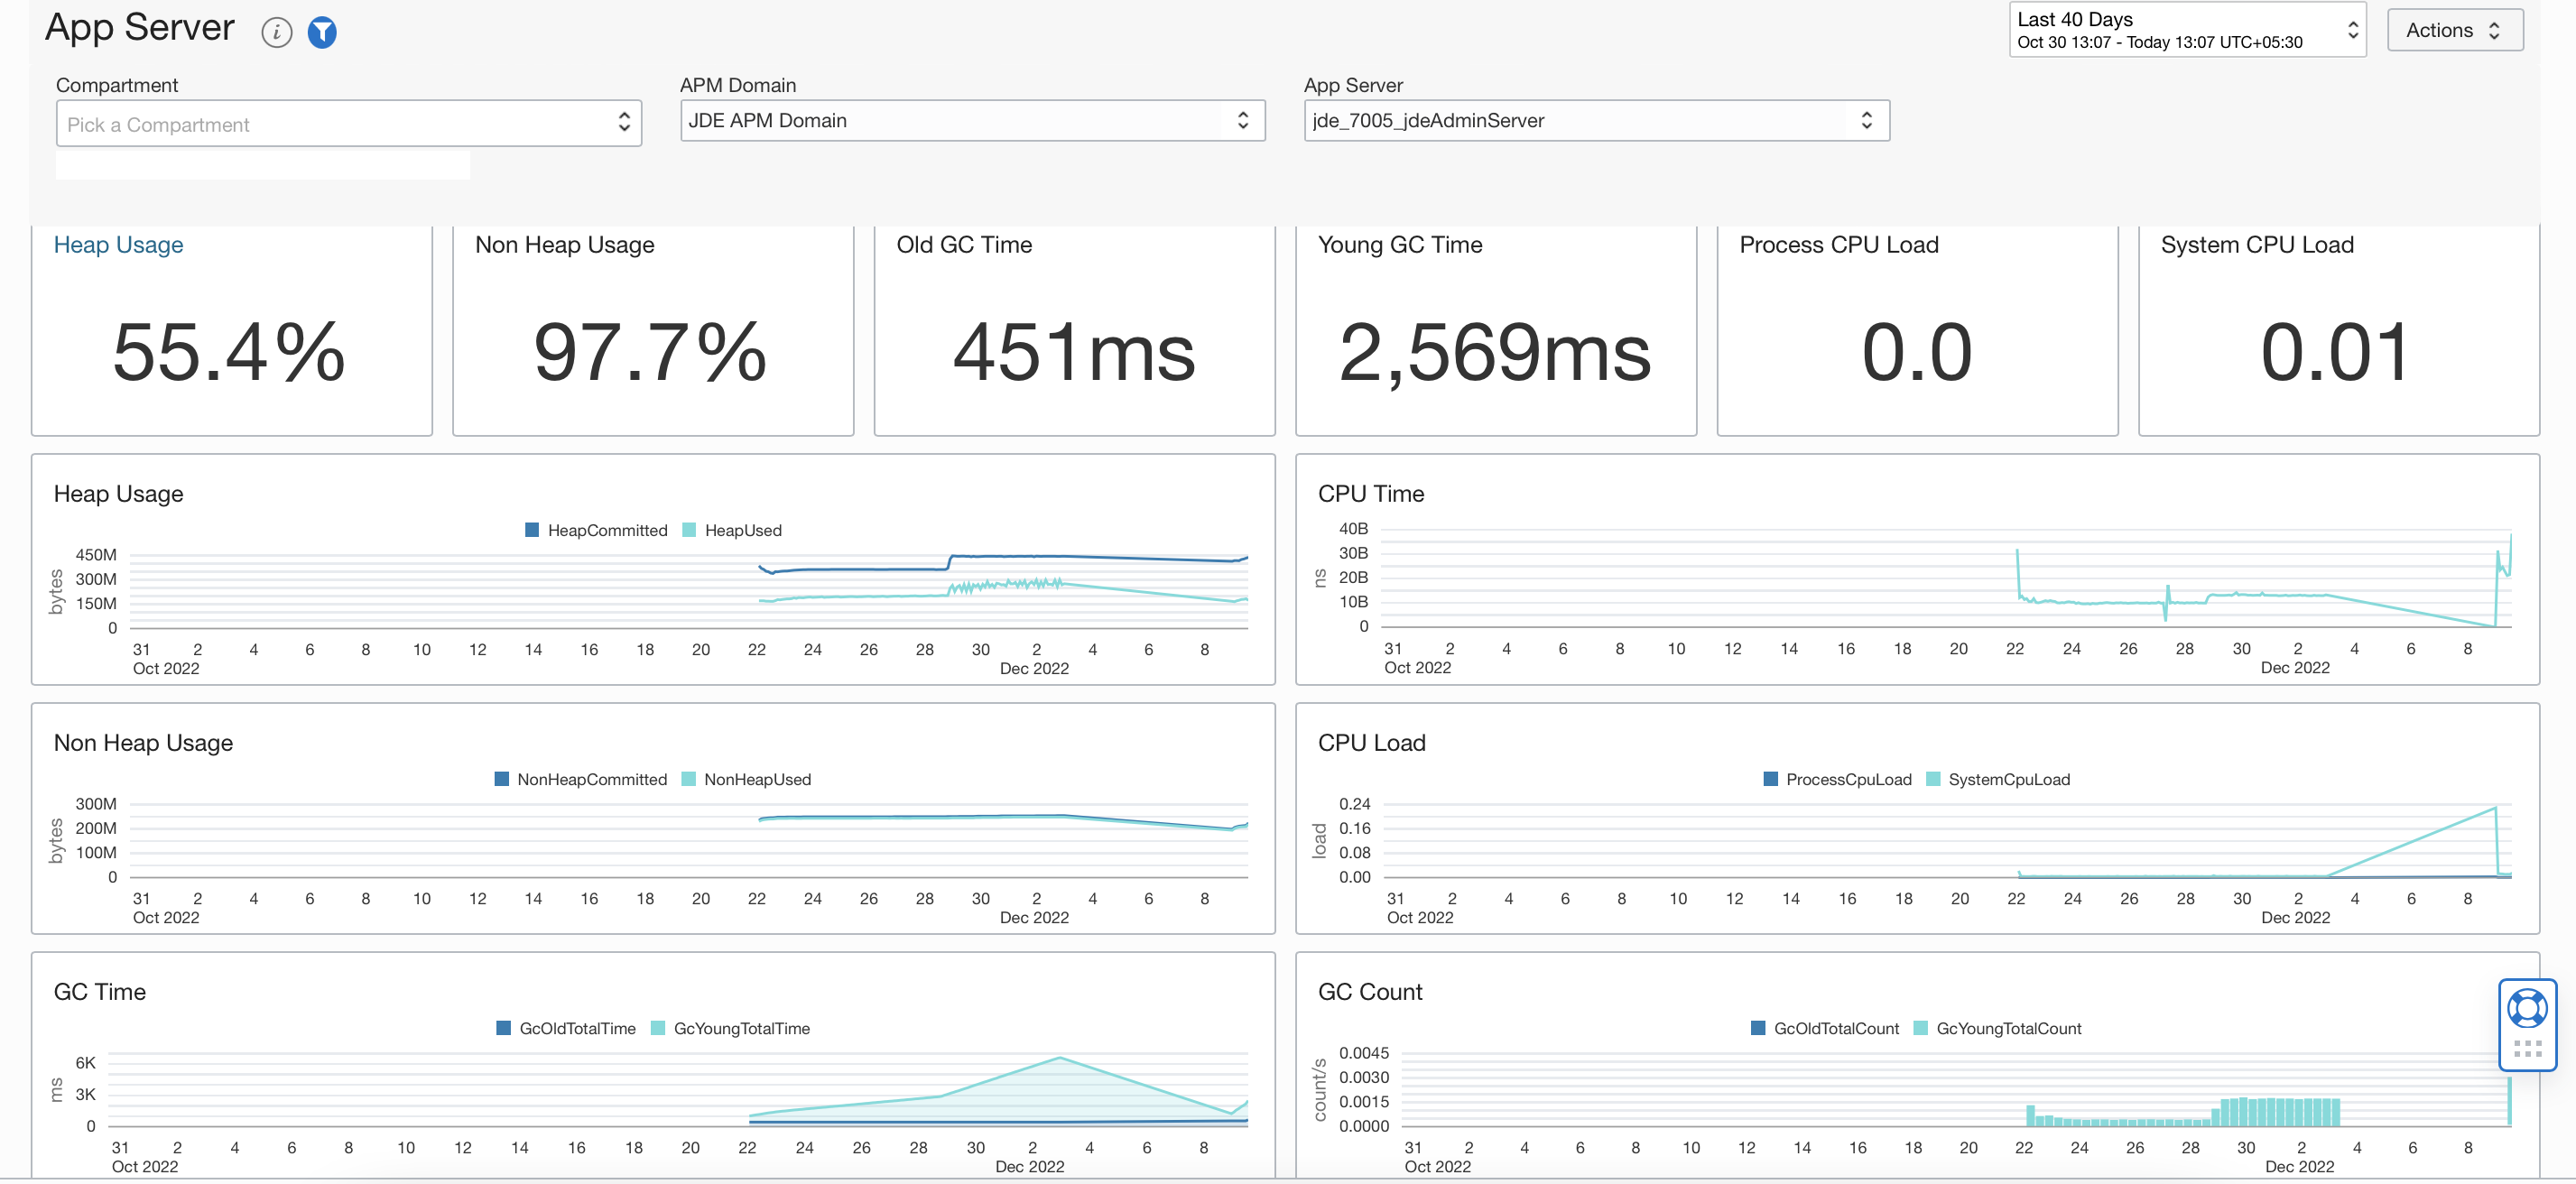
The App Server dashboard is the Home page for application servers and enables analysis ot the resources used by your application servers to understand resource constraints and requirements. For instance, this dashboard can be monitored to analyze the heap and CPU usage of an application server.
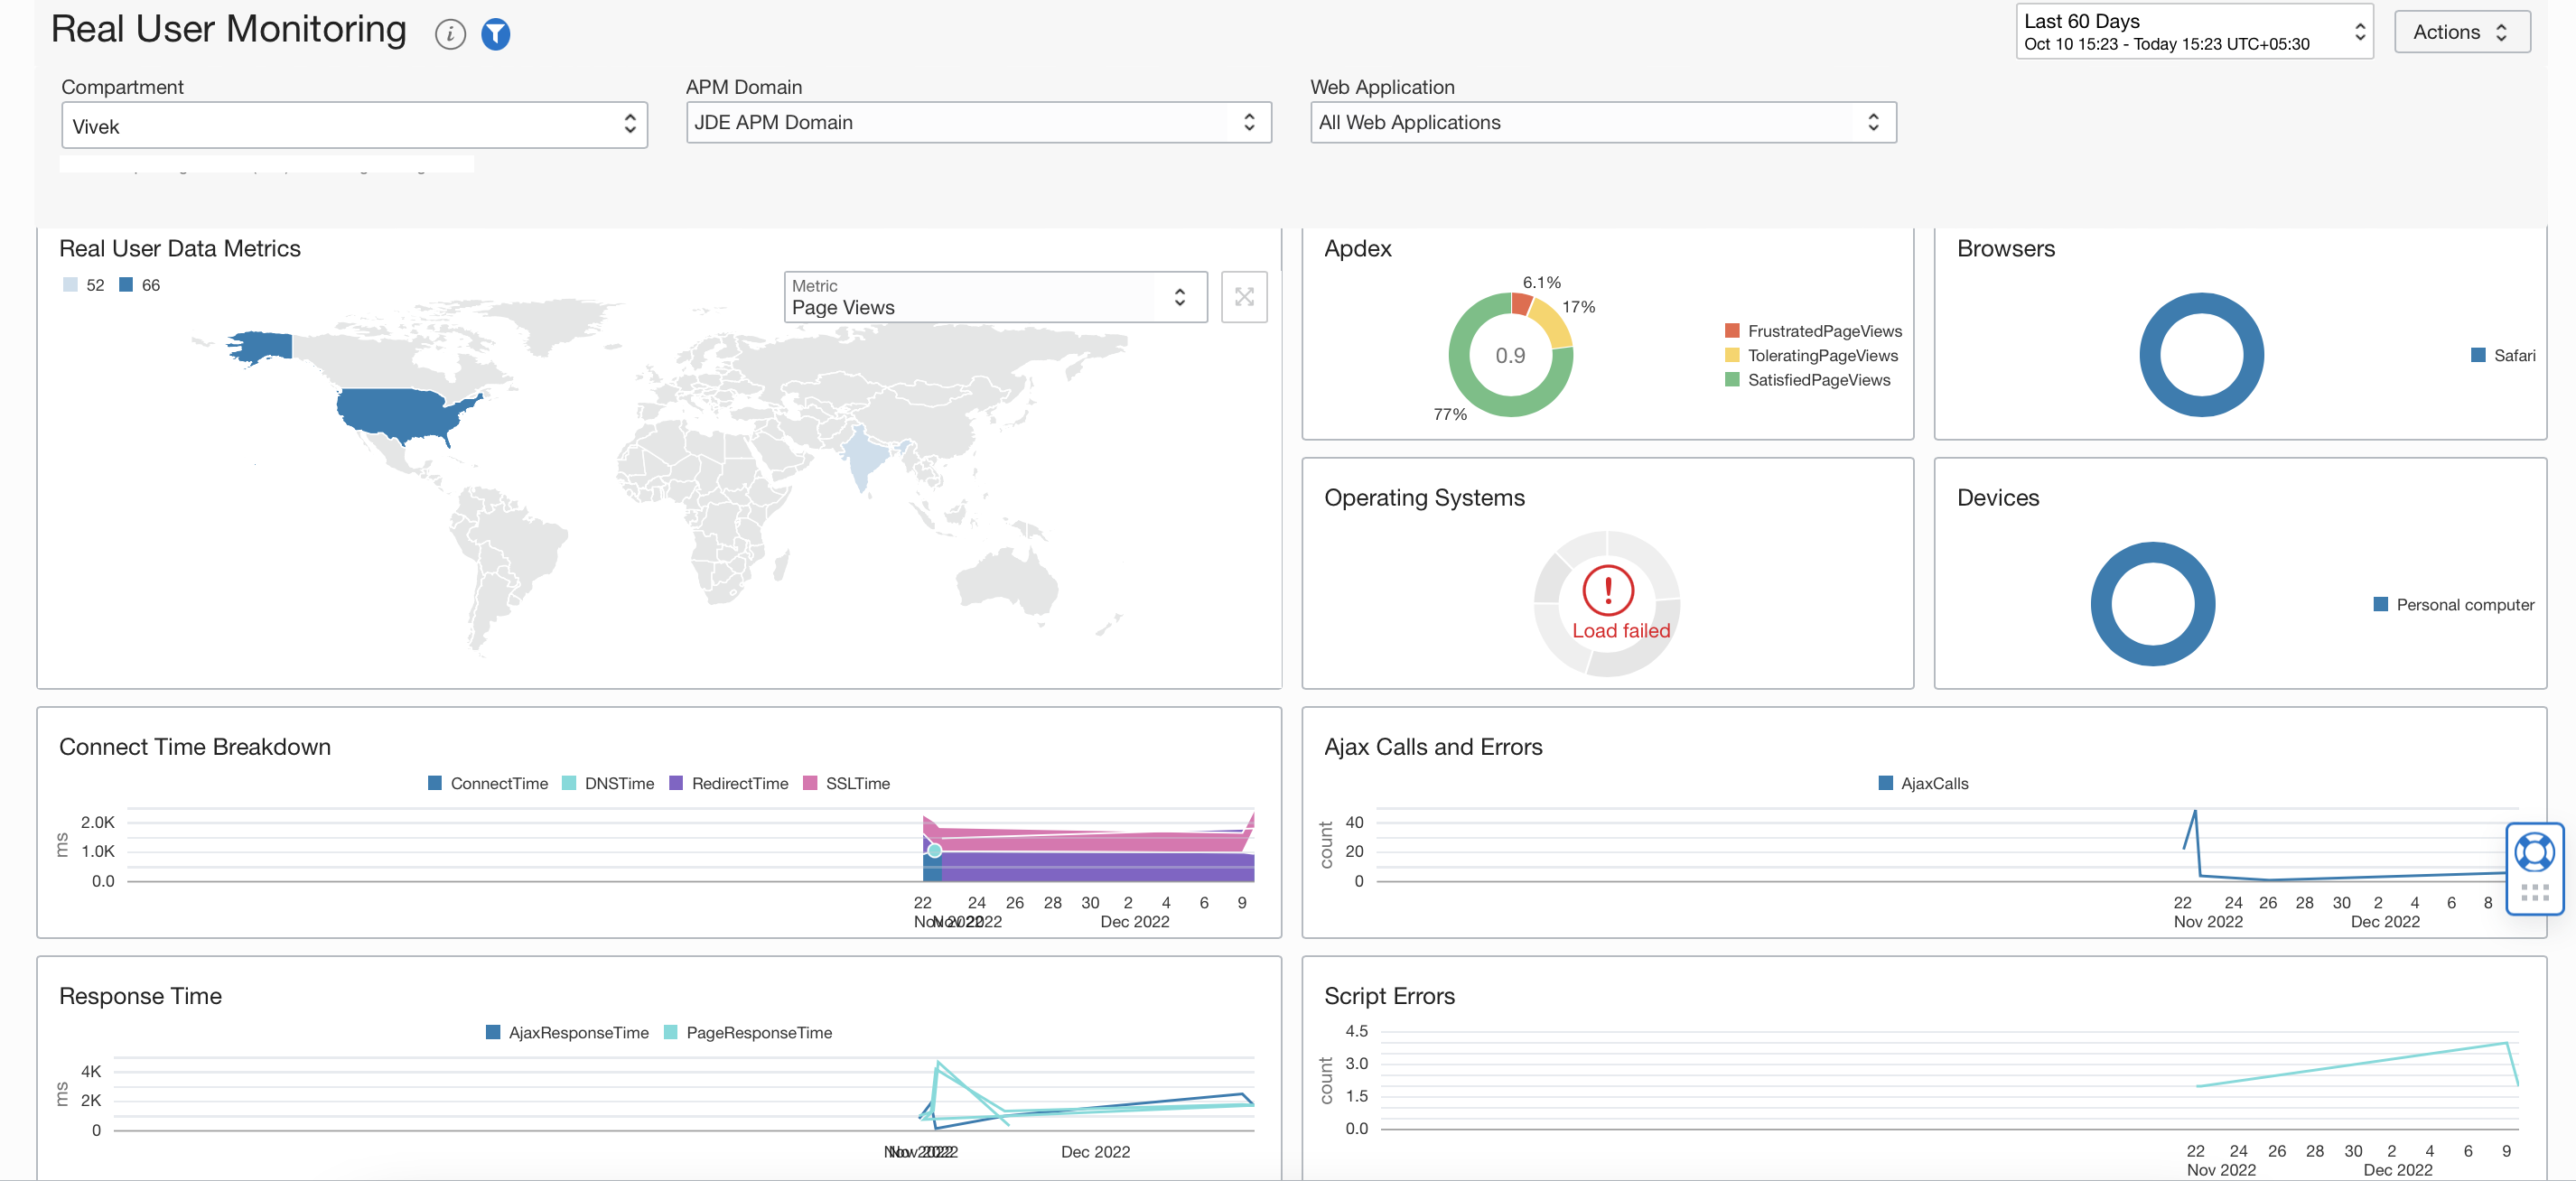
The Real User Monitoring dashboard provides insight into the performance of your web application and user experience. The Web Application drop-down-list allows for seletion of a subset of data for which information is displayed in the widgets, such as Apdex, Response Time, and Operating Systems. This enables measurement of the speed and performance of your web application and to take corrective action to enhance user experience.
Use Synthetic Monitoring to monitor application or API endpoints and detect availability and performance
Use Synthetic Monitoring to monitor application or API endpoints and detect potential availability and performance issues before the end user experiences them.
Synthetic Monitoring enables proactive monitoring that helps developers and operators prevent issues before users are impacted. It provides the ability to run scheduled monitors to ensure application availability. To set up the Synthetic Monitoring feature, create a monitor to monitor the availability and performance of your application across geographical locations and send metrics to Oracle Cloud Infrastructure. After creating a monitor, view Synthetic Monitoring metrics and monitor the performance of your application and identify possible issues before they occur.
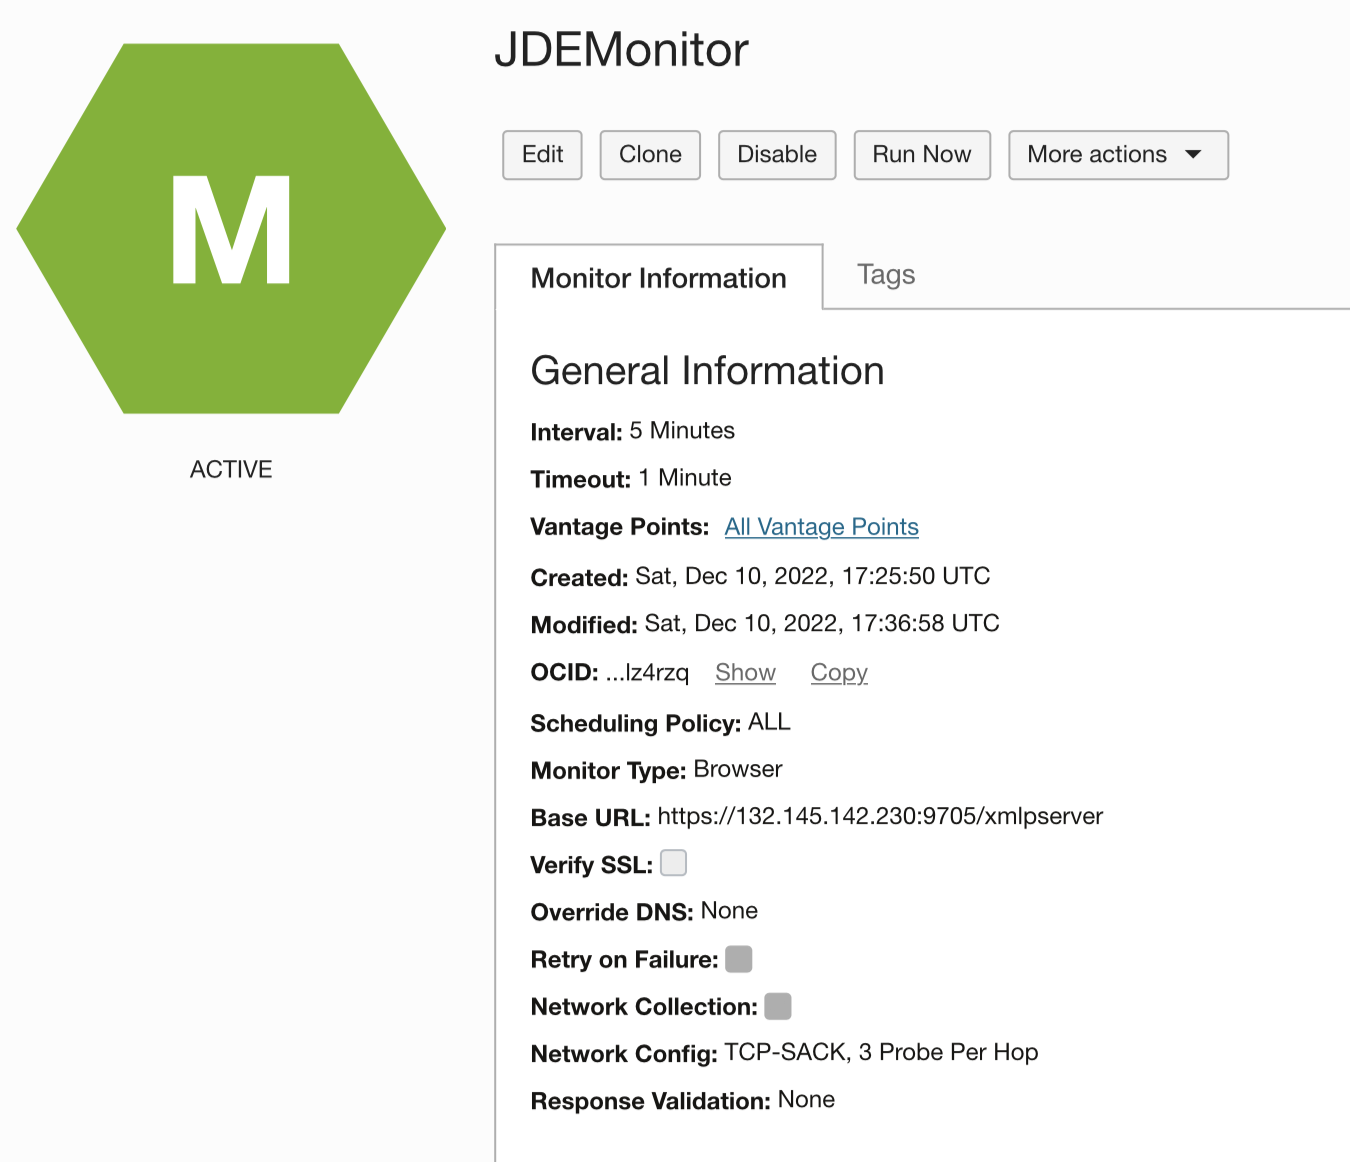
Here’s a sample JDE Monitor to monitor the BI Publisher URL:
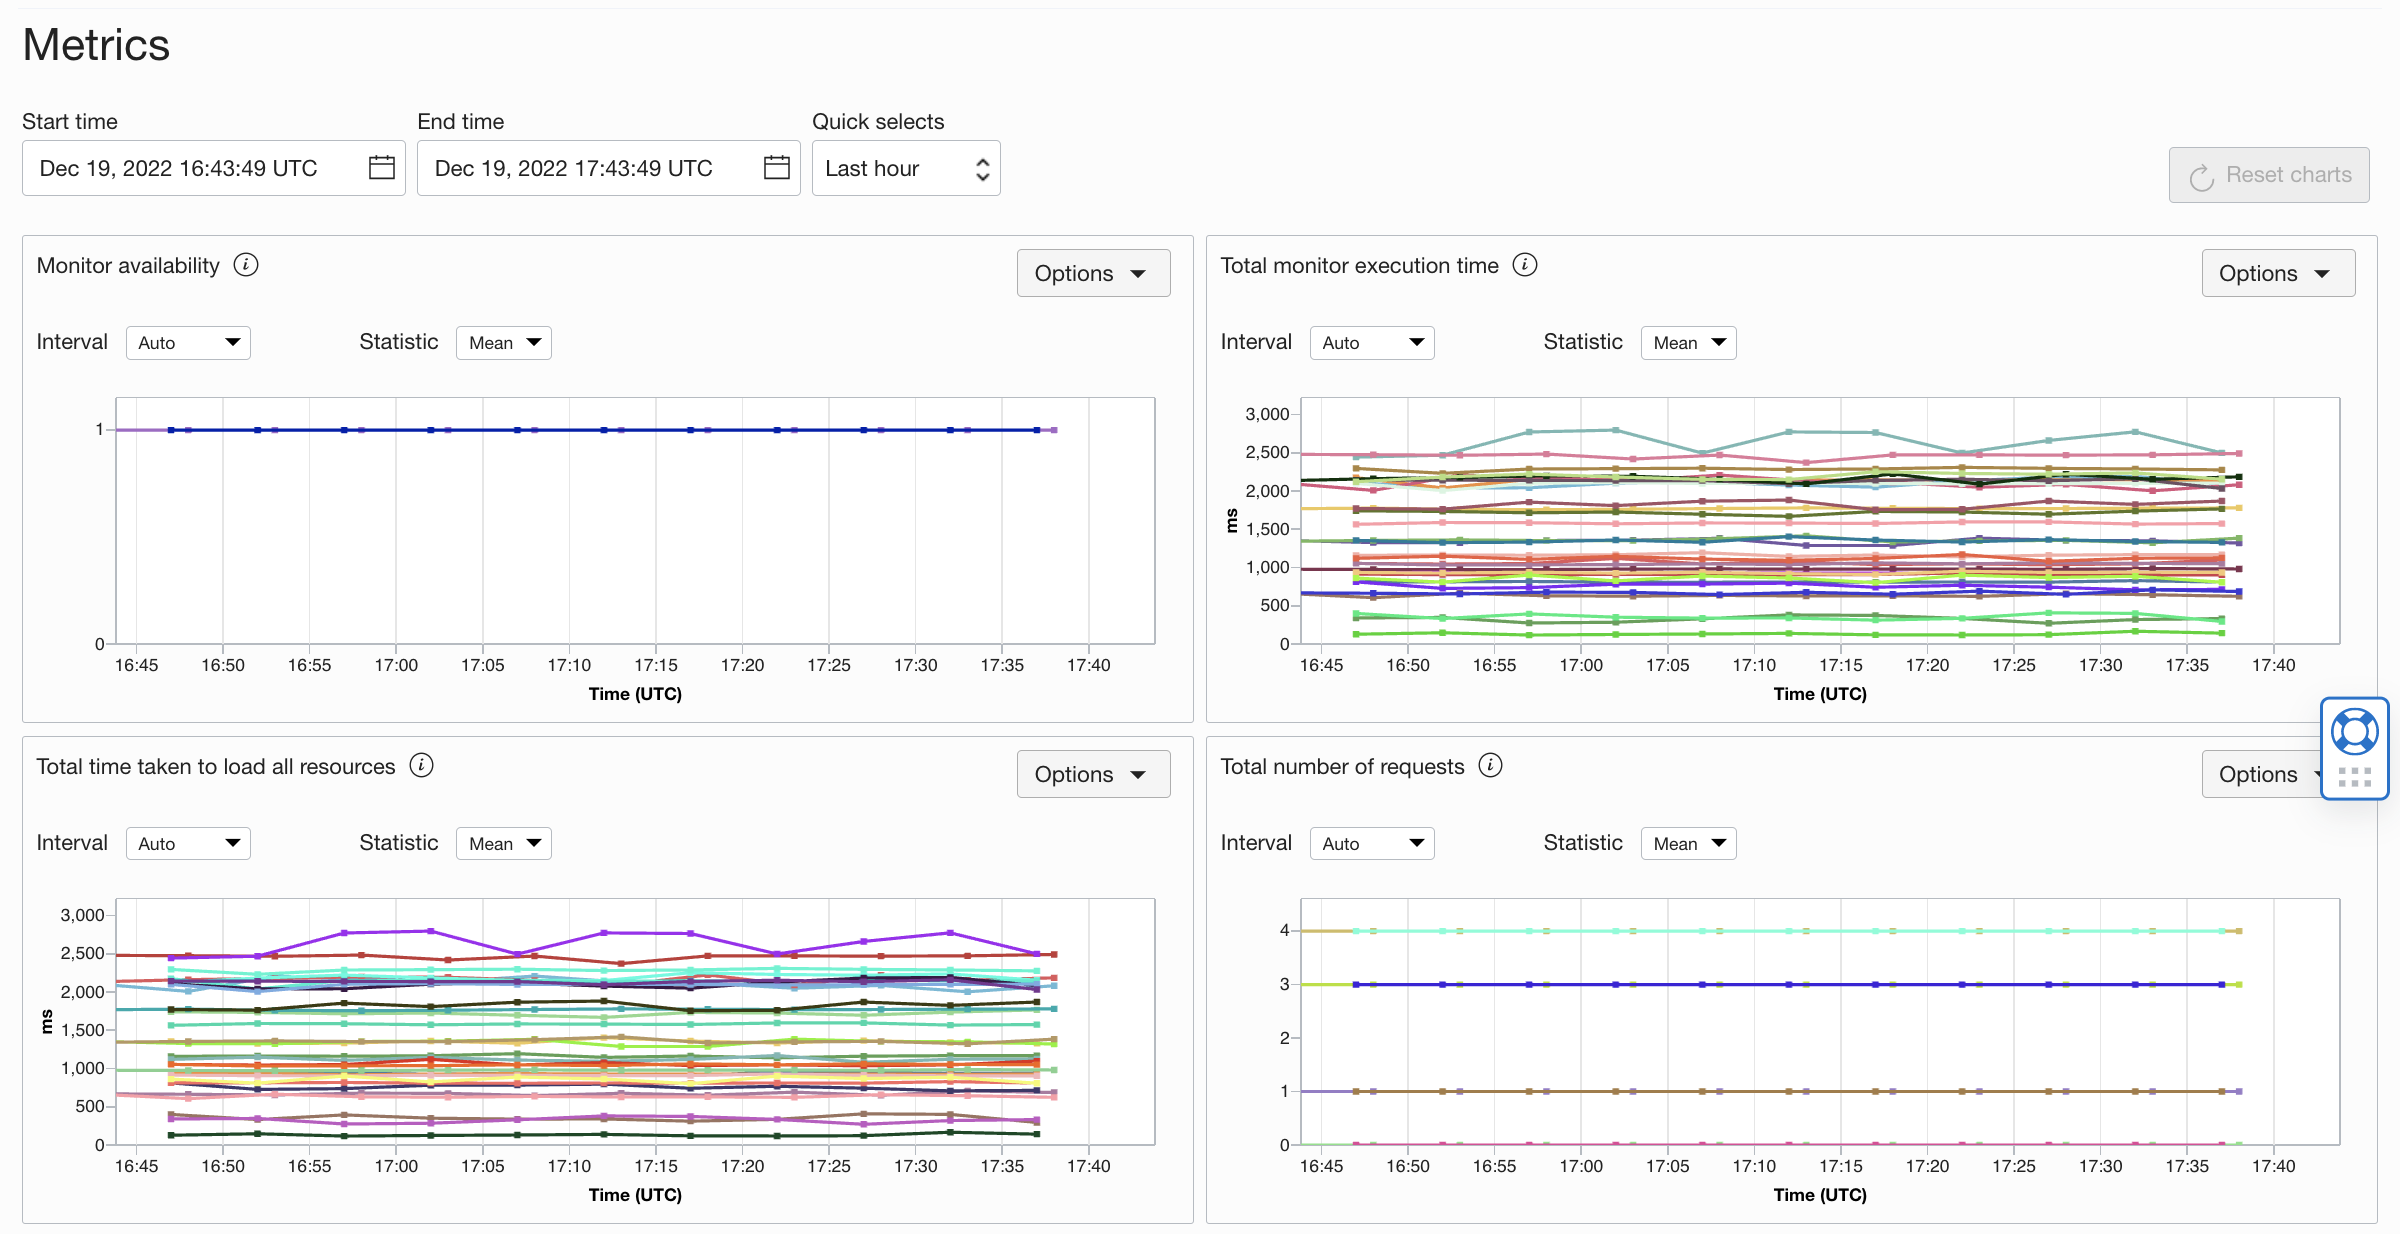
Here are a few sample metrics that are generated for a monitor that monitors an application URL from a set of Vantage Points:
Create an Alarm based on the monitor. Click “Create an alarm on this query” to create an alarm for a metric on the Definitions page of the Monitoring service. The alarm will then be triggered when the value of a metric is greater than the specified value, or is not optimal, or if the monitor is down. You can also view firing alarms for the Synthetic Monitoring metrics in the Alarms widget on the Application Performance Monitoring Home page.
To learn more about Application Performance Monitoring capabilities visit:
• Oracle Cloud Observability and Management Platform
• Application Performance Monitoring Technical Content
For more blogs on Oracle APM, visit the Observability and Management — Application Performance Monitoring blog space.