We are pleased to introduce Stack Monitoring Enterprise Edition. Stack Monitoring is an Oracle Cloud Infrastructure (OCI) service that supports the discovery and monitoring of applications such as Oracle E-Business Suite and its underlying tech stack components including Oracle WebLogic Server, Oracle Database, and hosts. With the Enterprise Edition, Stack Monitoring introduces a set of advanced monitoring features that include the ability to create custom metrics to monitor conditions unique to your environment, use Machine Learning to identify performance anomalies, and extend monitoring visibility to other resources outside Stack Monitoring’s built-in capabilities. These extensibility features allow for importing resources from other solutions and services to consolidate monitoring and enrich your application topology.
Monitoring unique requirements with Stack Monitoring Metric Extensions
Metric Extensions extend the out-of-the-box metric set provided by Stack Monitoring to meet the use cases required when monitoring unique IT environments. Metric Extensions provide the ability to create, test, publish, and enable a Metric Extension on a single resource or all the resources within a compartment.
Creating a Metric Extension in Stack Monitoring Enterprise Edition
DBAs who monitor their Oracle Database in Stack Monitoring may want to keep track of data files that have not been backed up and notify them if backups haven’t occurred within the last 3 days. Stack Monitoring allows DBAs to address this use case with Metric Extensions.
To get started, navigate to the Metric Extension page in Stack Monitoring and click “Create Metric Extension”. In the example below the Oracle DBA would begin by defining the Metric Extension name, display name, and description. Next, the DBA would complete the collection method properties which include the resource type of Container DB, the collection method of SQL, and the collection frequency of once per day. Next, enter the custom SQL query, or upload the file containing the SQL.
The Metric Extension in Figure 1 queries a container database (CDB) and determines the number of PDB data files that have not been backed up in the last three days. The query results in two columns, the name of the PDB and the count of its data files not backed up. The Metric Extension contains a dimension column for the name of the PDB and a metric column for the count of data files that have not been backed up.
The DBA can test the Metric Extension against CDB resources and review the output. Based on the output, if the metric needs to be revised, the DBA can update the query and re-test the metric. Once the testing is complete, the Metric Extension is ready to be published. A published Metric Extension can be enabled on one or many resources at a time. When a Metric Extension is enabled on a resource, metric collection will begin, and DBAs will be able to monitor the backup status of their data files.
Viewing Metric Extensions in Stack Monitoring
When the Metric Extension is enabled on a database resource, the metric will automatically appear in the performance charts of its home pages in Stack Monitoring. Using these performance charts the DBAs can quickly determine if any data files have not been backed up. Charts showing Metric Extensions have an “*” (asterisk) next to their name.
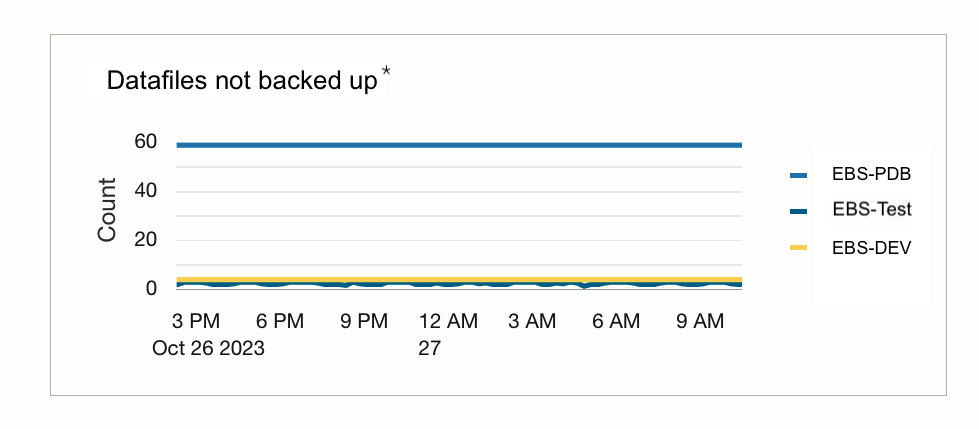
A DBA may want to keep a close watch on the status of their data file backups. Adding this metric to the Enterprise Summary makes it easy to monitor if the data file backups are occurring across all monitored databases. For more information on modifying the Enterprise Summary, see the documentation.
Configuring Alarms on Metric Extensions
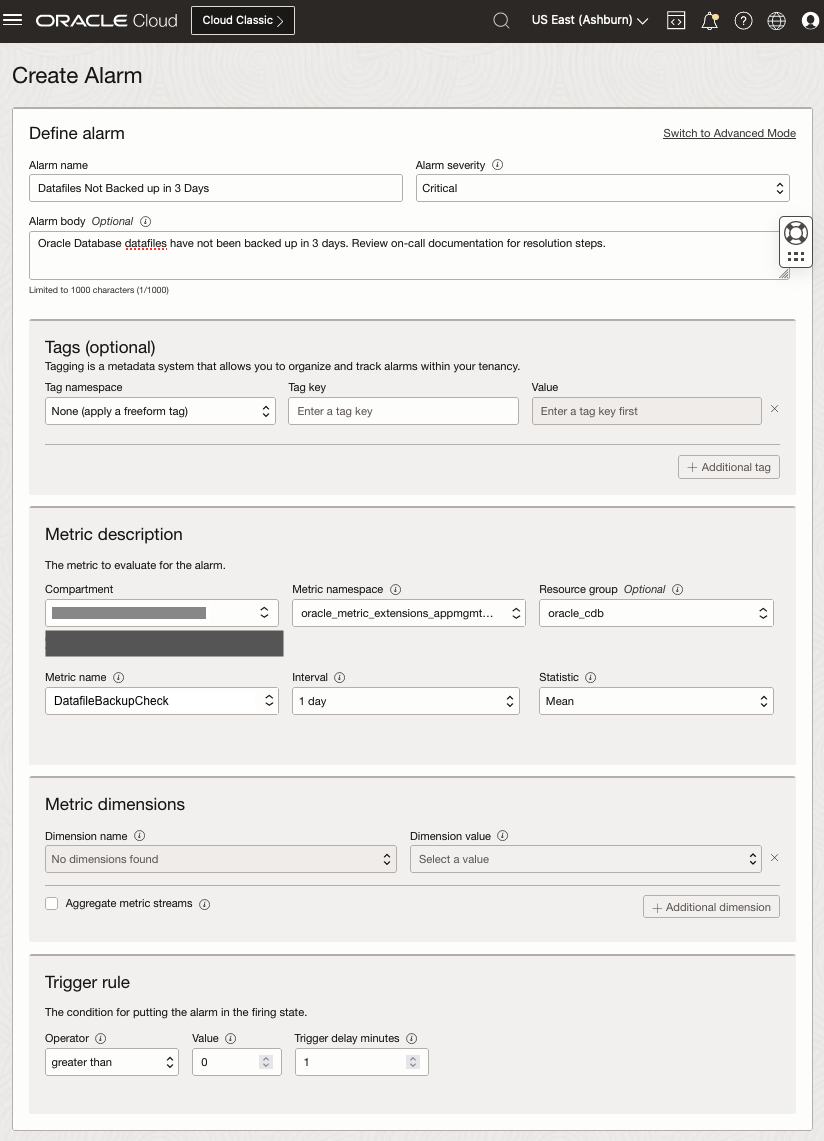
The final step in monitoring with Metric Extensions is defining an alarm. With OCI Monitoring it is easy to create an alarm to notify the DBA on-call to investigate why data files have not been backed up. Figure 3 describes how a DBA could create an alarm to notify the DBA on-call if the count of data files not backed up is greater than 0. When creating this alarm, leverage the oracle_metric_extension_appmgmt namespace and the resource group of oracle_cdb. For additional details on alarm creation, see the documentation.
Identify performance problems quickly with Stack Monitoring Anomaly Detection
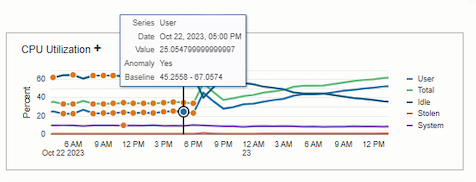
Monitoring in today’s IT landscape is generally coupled with strict Service Level Agreements (SLA). Identifying performance problems becomes costly if not identified and resolved quickly. If users are reporting slowness, anomalies provide quick visual identification if a resource is performing outside its historical norms. Stack Monitoring uses Machine Learning to automatically calculate baselines on key performance metrics. If a metric performs outside of the baselines, Stack Monitoring flags these values as anomalous. Baseline-enabled performance charts are identified by a “+”, and the anomalous performance is indicated by an orange plot point. A DevOps engineer can quickly review a baseline-enabled chart and identify if the metric is anomalous as indicated by an orange dot. The engineer can then hover over the plot point to understand how current anomalous performance compares to the baseline range of values as depicted in Figure 4 below.
Consolidate monitoring and enhance application topology with Extensibility
In today’s complex IT environments, an application stack is more than an application server and a database. Stack Monitoring’s Extensibility feature allows for monitoring from other services to be consolidated by importing resources into Stack Monitoring. Importing resources into Stack Monitoring allows for the application’s topology to be completed by creating associations between the imported resource and existing Stack Monitoring resources. This reduces troubleshooting time by providing access to all resources and their availability and performance metrics of an entire application stack, including the load balancer, applications servers, databases, and even storage in a single place. Once a resource has been imported, Stack Monitoring will create a home page with availability and performance metrics, and configuration details, and report any open alarms.
Importing a Load Balancer to maximize speed and ensure application availability
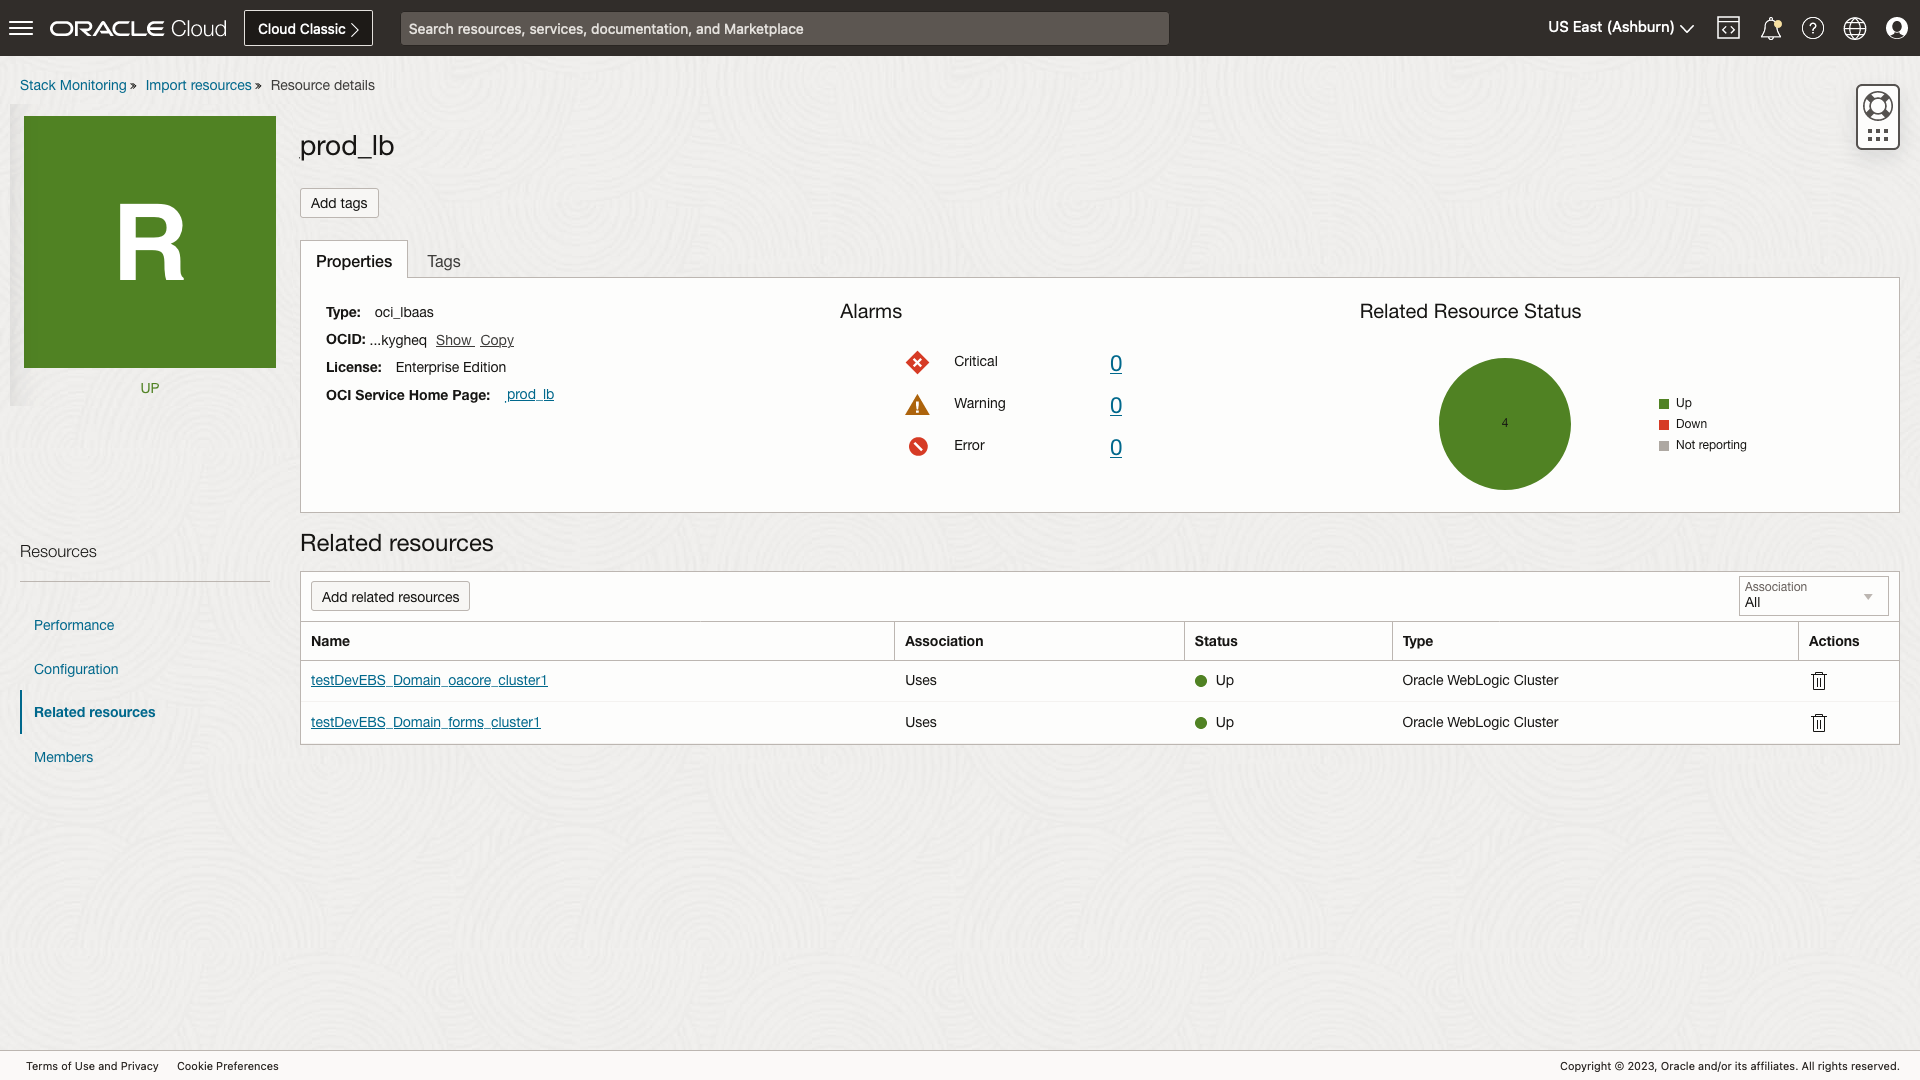
Monitoring a load balancer is critical when running nearly any application. A load balancer routes traffic requests to help maximize speed and capacity. The load balancer directs traffic to ensure no one server is overworked, and the application remains available if an application server goes down. Stack Monitoring can already monitor an E-Business Suite Application and its components including a Concurrent Manager, Oracle Database, and WebLogic. To complete the application topology and consolidate the monitoring of the entire application stack, import the load balancer into Stack Monitoring using the Import Resources Extensibility feature. To import a load balancer navigate to the Import resources UI and select the oci_lbaas namespace. Once the import work request is completed, a list of resources imported and a link to their respective home page(s) will be provided.
Clicking a resource name will navigate to the load balancer’s new home page which includes availability and performance metrics. The home page also provides the ability to create associations between the load balancer and the WebLogic Clusters that depend on it. Completing the application topology of an application allows for easy performance correlation across the application stack and helps reduce troubleshooting time. These relationships extend the current application topology to include resources such as a load balancer and block storage. If the JDBC connection count of WebLogic is below the baseline performance, operations teams can leverage the association to navigate to the load balancer home page and review performance, configuration, and availability quickly and easily. Figure 5 below depicts a PeopleSoft load balancer home page and the WebLogic Clusters that depend on it.
Enabling Stack Monitoring Enterprise Edition and make setting the license easy
Stack Monitoring’s exciting new Enterprise Edition features can be enabled in the Licensing UI. From the Licensing page in Stack Monitoring the Enterprise Edition can be enabled on one or many resources within a compartment. To make setting the license easier, select Enterprise Edition as the default license. Stack Monitoring makes setting the license easy by also providing the ability to define the license during resource discovery.
Whether you want to monitor unique IT needs with Metric Extensions, easily identify if an application’s performance is anomalous, or consolidate monitoring and enhance application topology with extensibility features, Stack Monitoring Enterprise Edition will help achieve your monitoring goals. Navigate to the Stack Monitoring License UI to enable Enterprise Edition and get started with these exciting new features today! Happy Monitoring!