Application Performance Monitoring (APM), an Oracle Cloud Infrastructure (OCI) native service, enables DevOps engineers and application administrators to monitor end-users’ experience and application performance by tracing and correlating transactions through multiple components and application logic distributed across various clients, third-party services, and backend tiers, in the Cloud or on-premises. Synthetic monitoring (Synthetics), one of APM’s key capabilities, helps developers and operators prevent issues before users are impacted. Synthetics provides the ability to run scheduled, scripted monitors to ensure application availability. It also allows for proactive monitoring of any application and endpoint using approximately 60 Vantage Points around the world.
In this blog, we’ll review the latest enhancements in synthetics.
What are the latest enhancements in Synthetics?
The following is a list of the key new Synthetics features released recently:
- Synthetic Monitoring Network Data Explorer.
- Advanced availability calculations and reporting.
- New external Vantage Points.
- Using your own Data Vault to dynamically update attributes like passwords.
- Synthetics is now part of APM always free offering.
For a list of all features released for Application Performance Monitoring service please refer to the APM Release Notes.
Synthetic Monitoring Network Data Explorer
Previously it was possible to see the Network trace details of a single Monitor run. But to investigate if network paths or performance changed between runs or from different locations, we have now introduced the Network Data Explorer that can show network traces across multiple monitor runs and for multiple Vantage Points showing changes and bottle necks in an easy to use UI. The Network Data Explorer displays a topology diagram of the network path (aggregated traceroute) taken by a probe packet on an IP network, and the list of IP addresses of all the routers it pinged from source to destination.
If you have multiple runs from different Vantage Points or a single Vantage Point, you might want to analyze if there are differences in network latency, packet loss, and or routing differences.
We now have a UI that supports these use cases and brings them together in a single view.
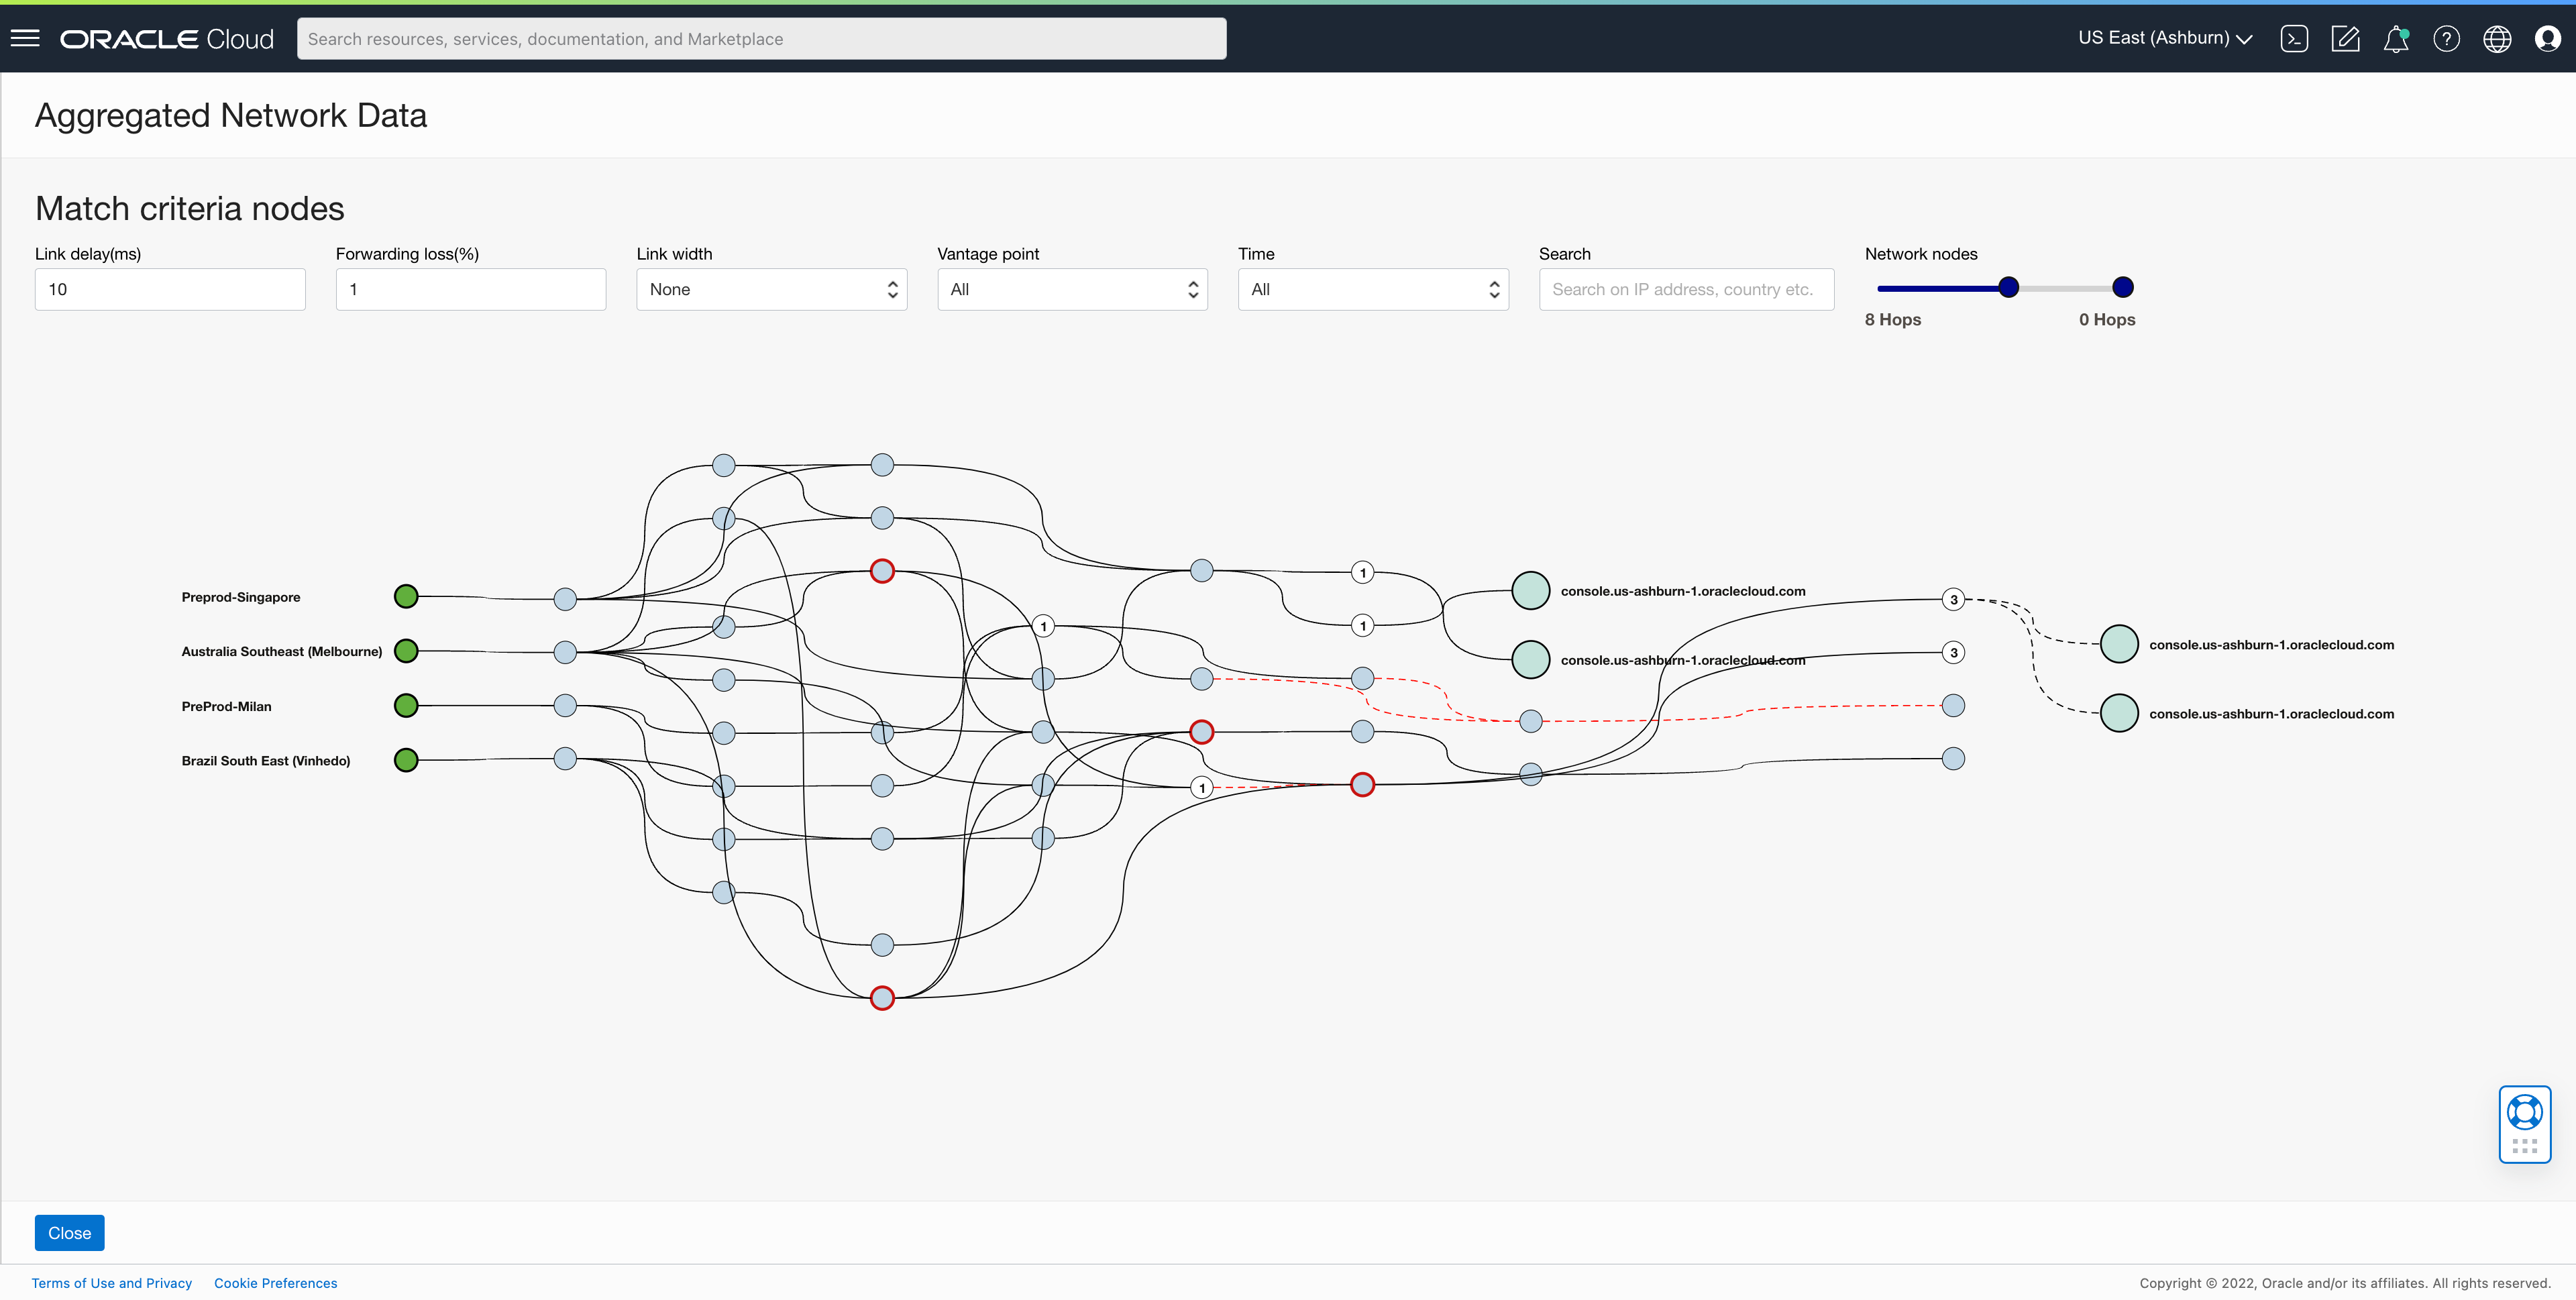
For more information, see View Monitor History.
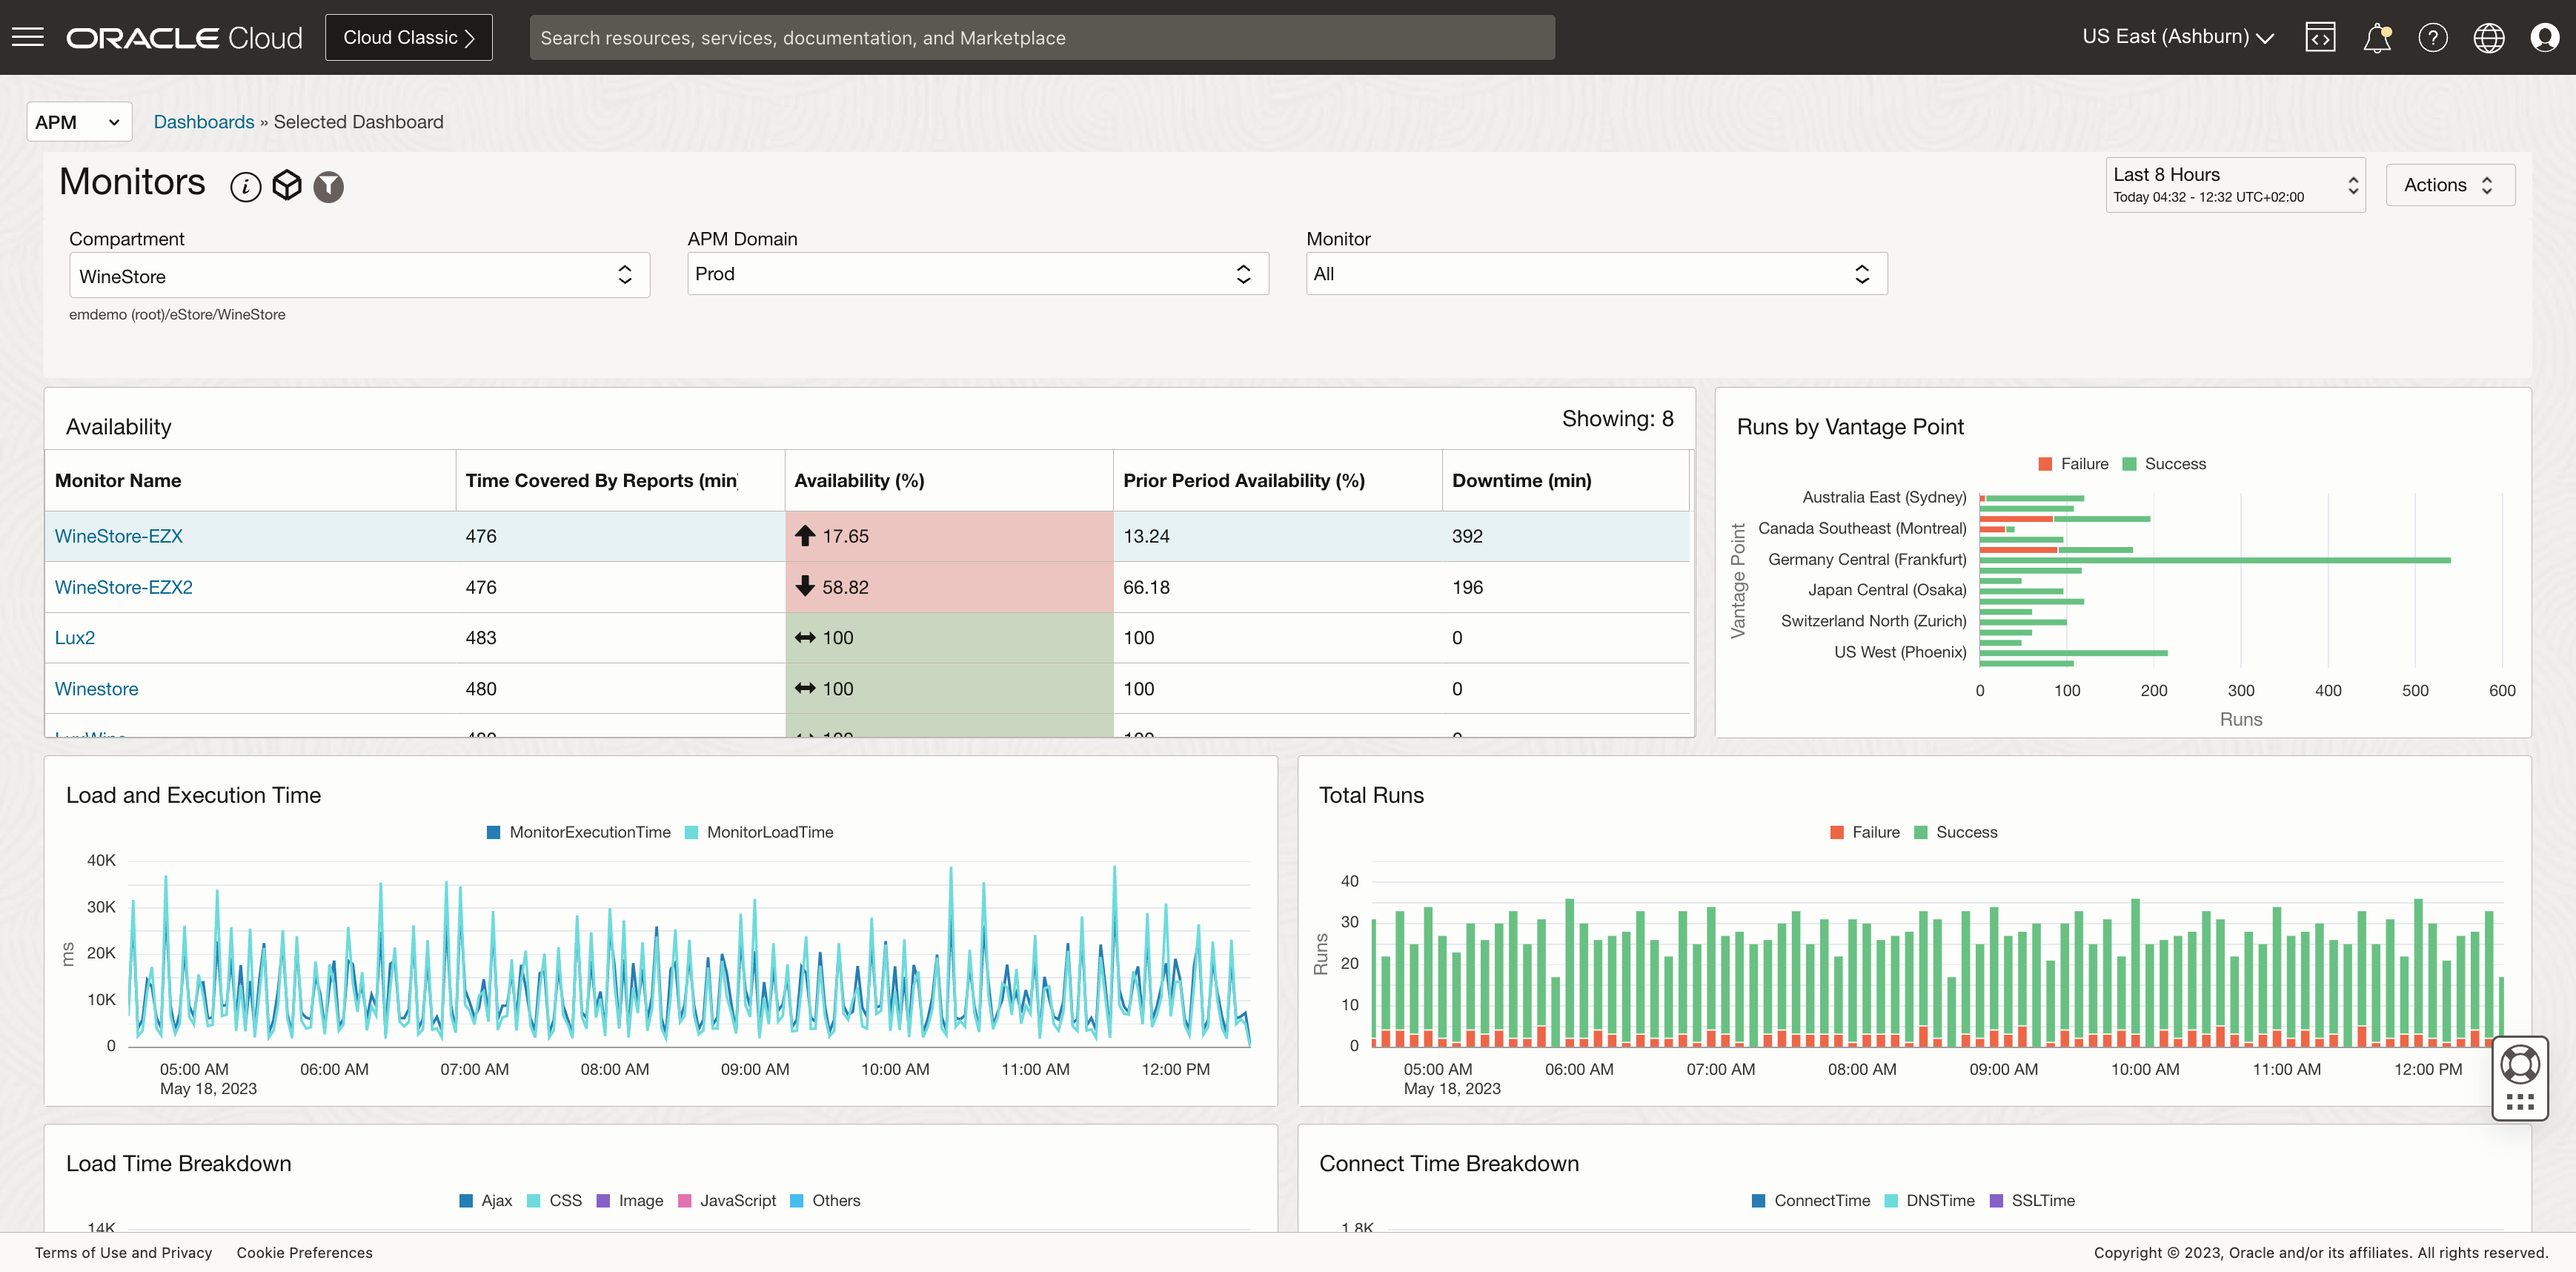
Advanced availability calculations and reporting
Many customers use Synthetic Monitors to determine if their applications are up and running for Service Level Agreement reporting. In such cases it’s important that results are not impacted by planned maintenance windows or intermittent issues that do not have impact to a larger set of users application wide.
To ensure a correct availability calculation you can now configure the criteria to calculate the availability of your monitor at the time you create a monitor. In addition, you can view the availability details in the Oracle-defined Monitors dashboard Availability widget.
The dashboard availability widget calculates availability based on the time range selected for the dashboard out-of-the-box. It also offers the option to calculate for longer time periods. For example, if monthly reporting is needed.
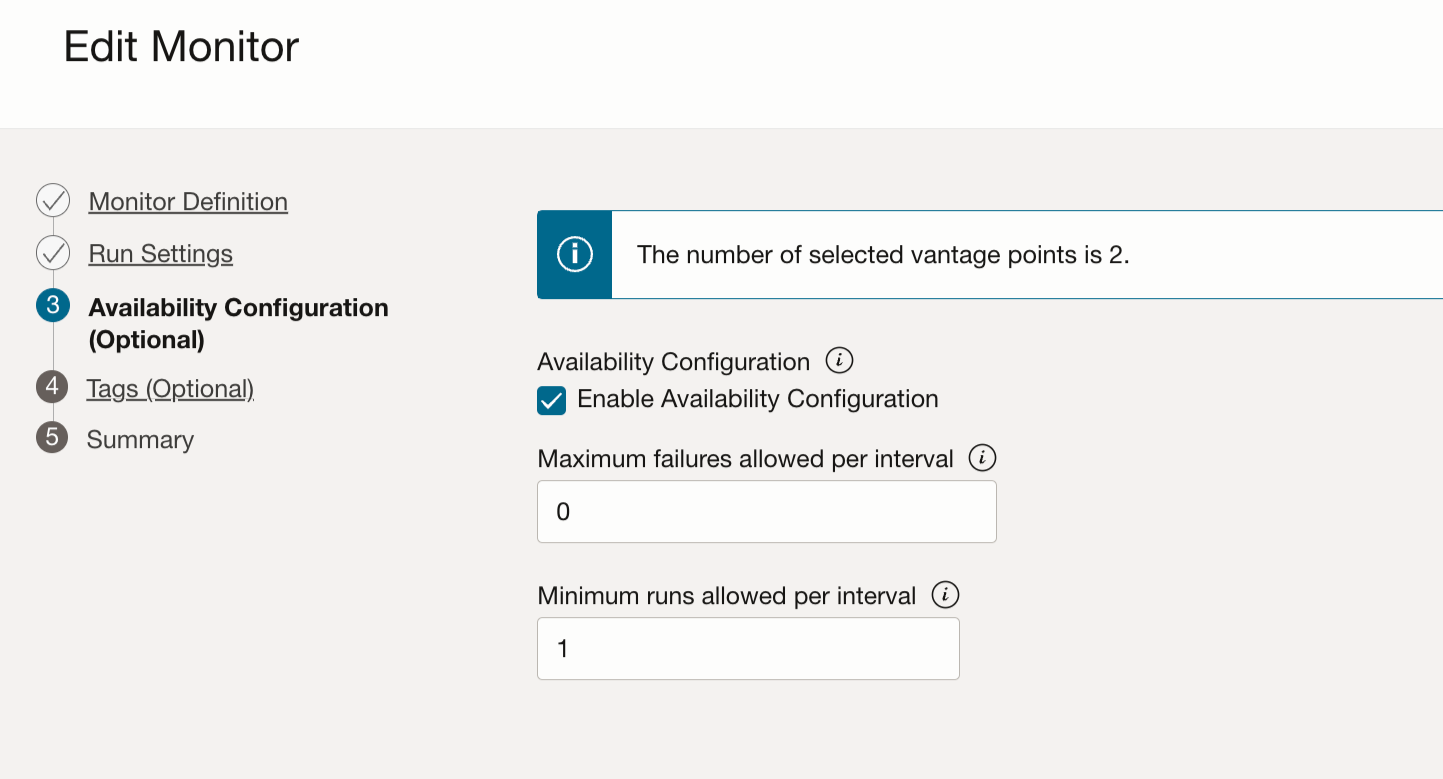
For existing monitors, you must edit the monitor and configure the availability criteria for data to start showing up in the Availability widget.
When a monitor is created or edited, one of the wizard steps allows you to specify the availability configuration criteria. Basically, you tell the system what failures you allow each monitor to run. If it exceeds the set limits, then the Monitor will show as Unavailable.
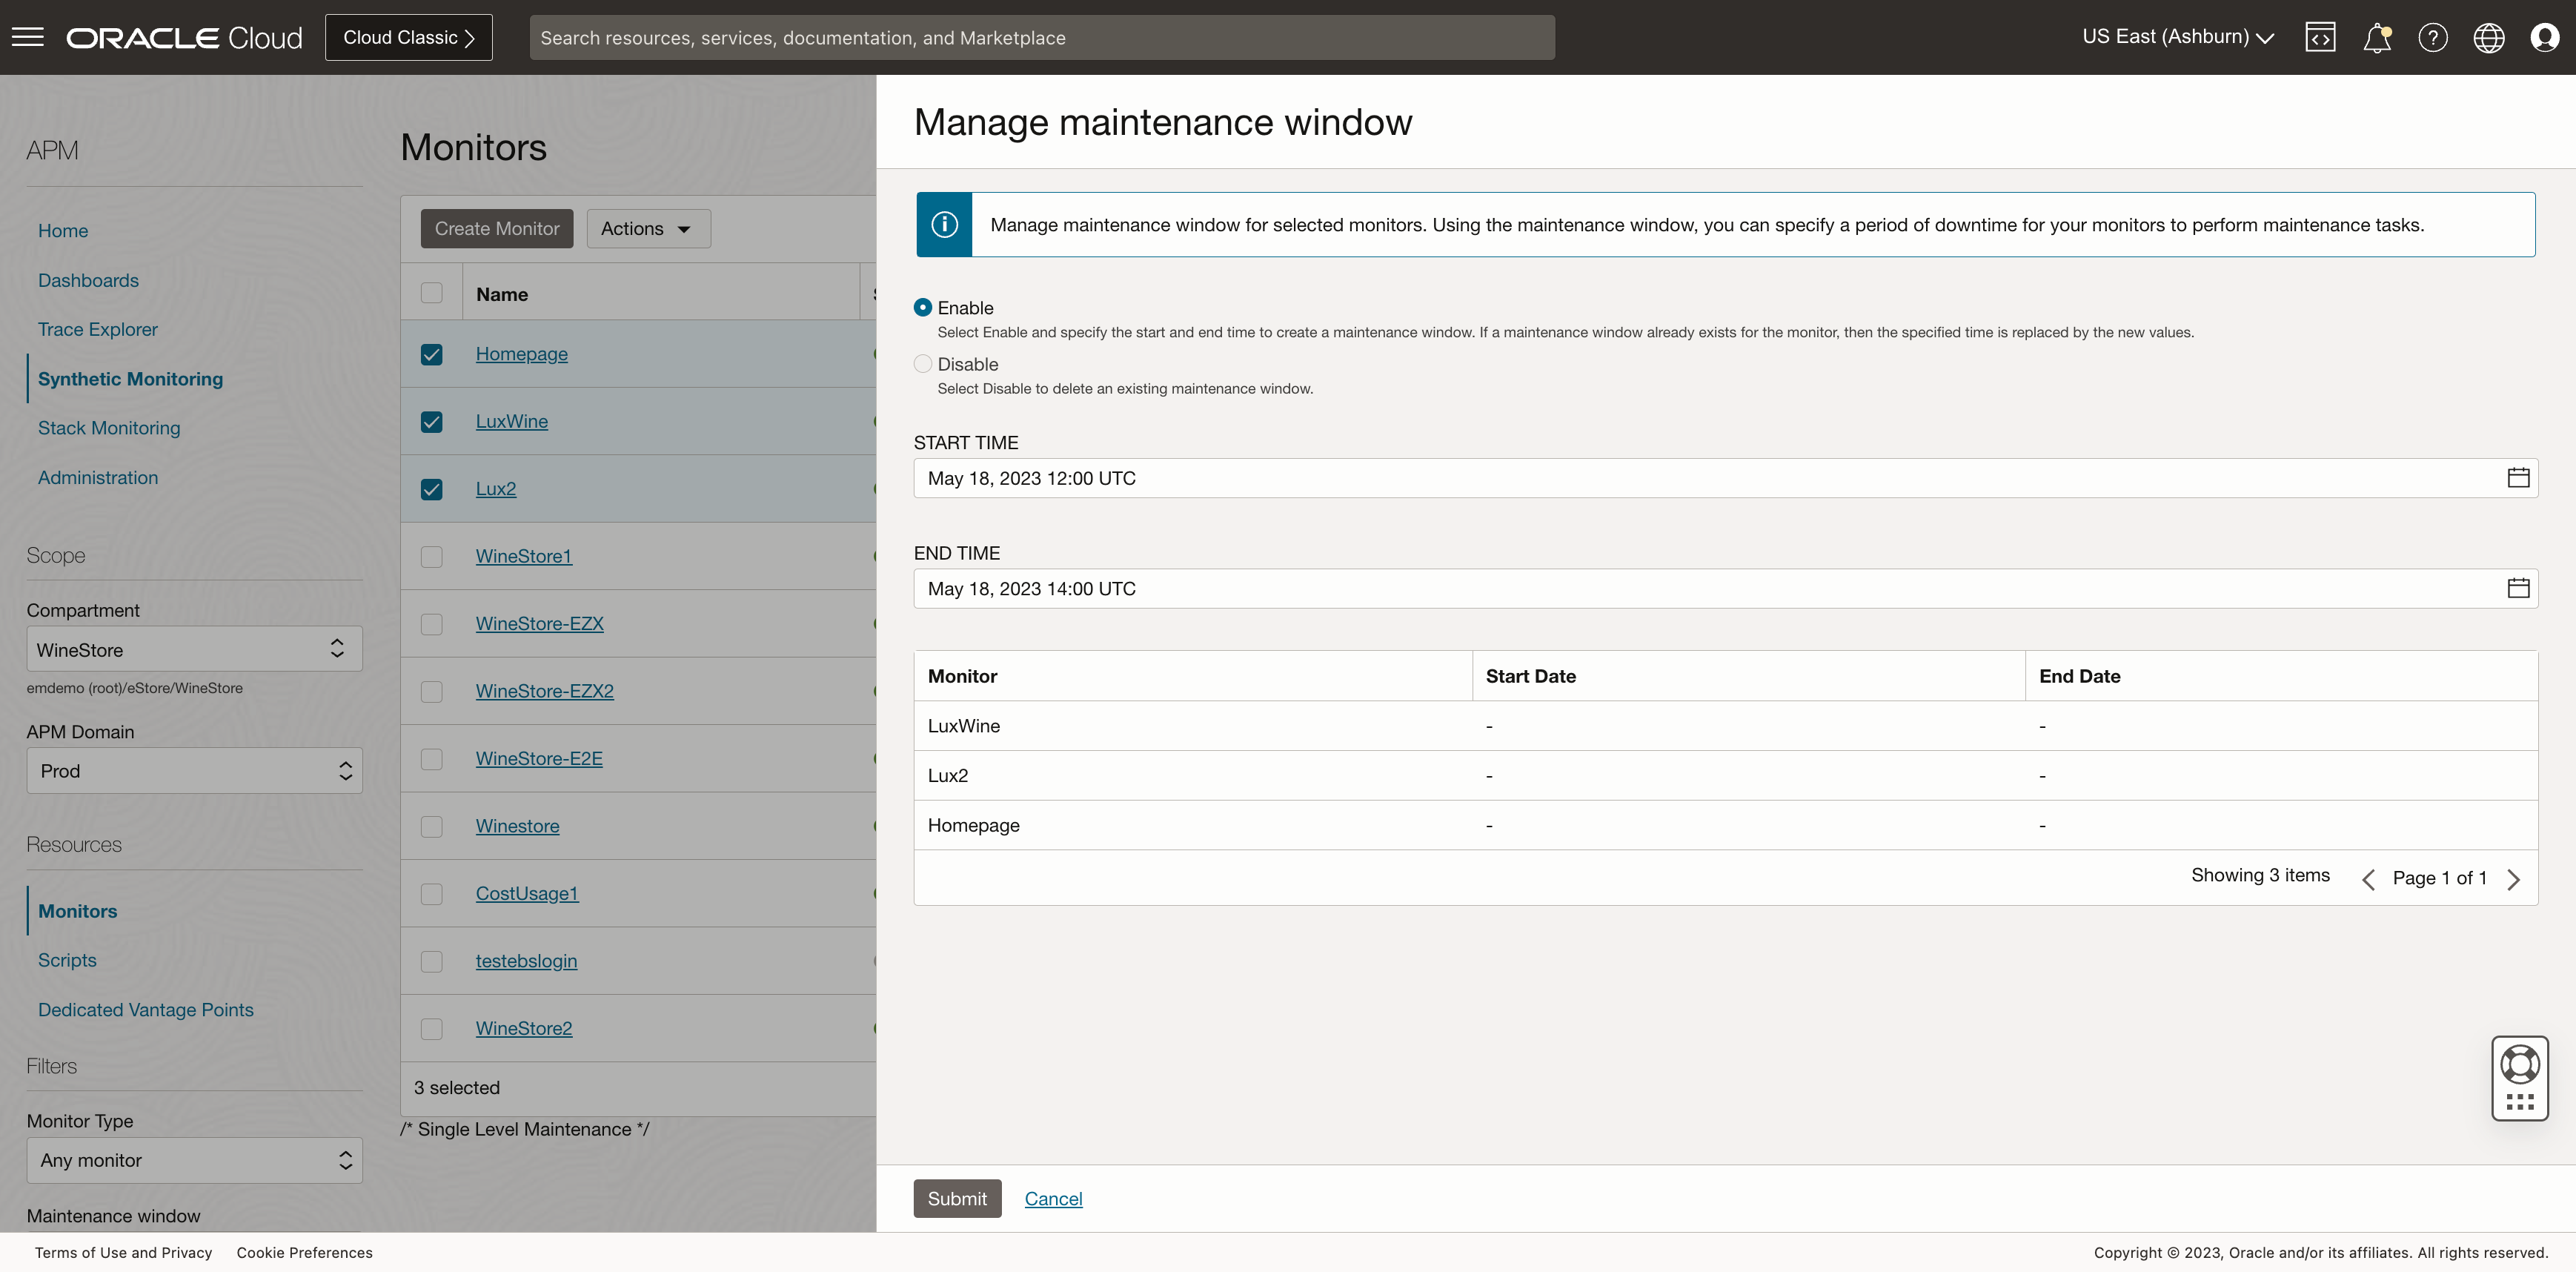
In addition, maintenance windows can be enabled for each monitor. If a monitor is under maintenance, it will continue to run, but the results will not be considered for availability calculations and the MaintenanceWindowActive dimension can be used to automatically suppress alarms during the maintenance window.
Maintenance windows can be managed directly from the monitor list page. Select the monitors to manage and then a pop-up window allows you to define the correct time selection.
For more information, see View Monitor Availability and Manage Maintenance Windows.
Using a Data Vault to dynamically update attributes like passwords
We have added support to dynamically update variables such as user names and passwords, without updating the scripts or restarting the monitors. To dynamically update variables, specify vault secrets in .side or .js scripts which get resolved at runtime.
This addresses the scripts maintenance problems such as updating scripts whenever changing an attribute, whether that is a product ID or a password used to log into an application.
By using your Data Vault, within your tenancy and compartment, you have administrator access to update any variable, without ever updating a script, therefore making it easier to manage and ensuring secrets remain only stored in your Data Vault.
This only requires a simple policy change for the Application Performance Monitoring Service to read secrets from your Data Vault (that may be in a different compartment/region even) and then provide the secretOcid as a syntax in your Monitor script.
For more information, see Using Vault Secrets.
Even when you cannot use a straightforward password, we have added support for using Multi-Factor Authentication (MFA) that generates a Time-Based One-Time Password (TOTP) token, which is given the authentication secret when running a synthetic monitor.
For more information, see Use Multi-Factor Authentication (MFA).
New external Vantage Points
If applications or endpoints are running on Oracle Cloud Infrastructure (OCI), you might want to validate if such resources are always available from the outside world. Running monitors from Oracle Vantage Points do not always provide such last mile checks as the monitor if fired from the Oracle Cloud Infrastructure network and remains within the OCI backbone, even when routed from one Oracle Datacenter to the other.
This can be resolved running your monitors from Vantage Points that are marked in the list of Vantage Points with the identifier External.
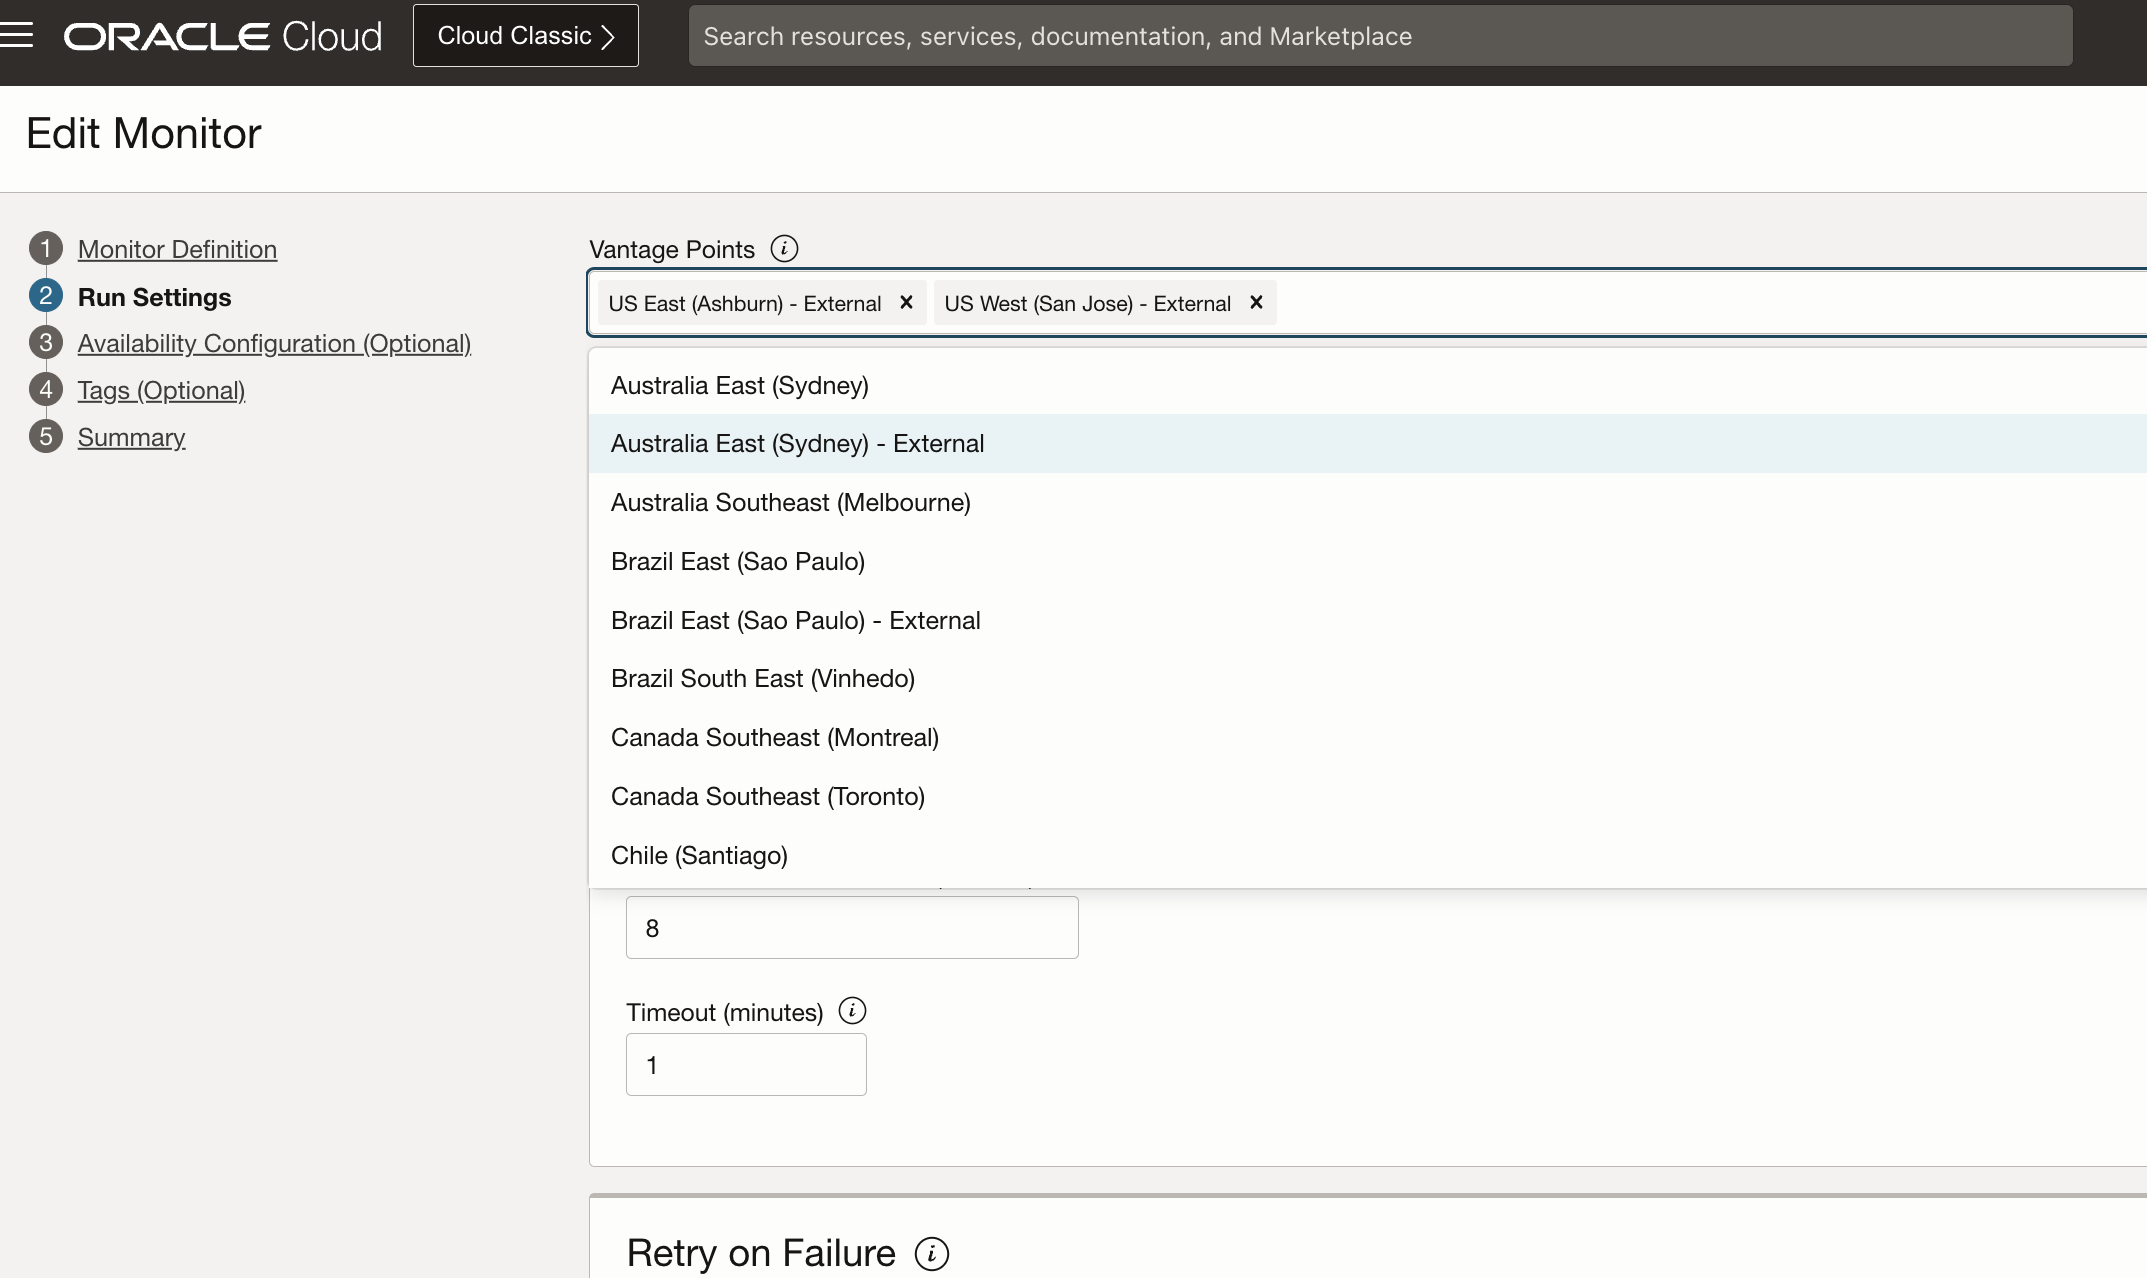
Using External Vantage Points ensures the last mile from the public web into the Oracle datacenter is seen, same as any web browser/web request would see it. It sends an alarm when access to an application on OCI cannot be reached. Using our network explorer allows you to see where the routing is broken.
Synthetic monitoring features available in an Always Free APM Domain
Up to 10 synthetic monitor runs per hour can be executed in an Always Free APM domain. Synthetic Monitoring capabilities in an Always Free APM domain make use of the full Application Performance Monitoring feature set to monitor your environment immediately.
For more information on:
- Always Free APM domains, see Application Performance Monitoring Terminology.
- Synthetic Monitoring features, see Use Synthetic Monitoring.
To learn a lot more about Application Performance Monitoring visit:
- Oracle Cloud Observability and Management Platform
- Oracle Application Monitoring YouTube channel
- Application Performance Monitoring Technical Content
- APM Blogs space