If you’ve ever trained a machine learning model that worked well in one context, and then tried to give it new data and it performed poorly, chances are you may have experienced some form of bias in your training data. Data bias can lead to machine learning models that are at best inaccurate, but even more importantly, unfair, or even harmful. You might imagine a healthcare scenario where the model predicts how a patient may respond to a particular treatment. An under-represented subgroup of patients may be predicted to respond well, when in fact, this is more representative of the larger population, not the subgroup.
To help our customers identify possible bias in data early in the machine learning lifecycle, thereby avoid impact on model quality and inadvertently put certain groups at a disadvantage, Oracle Machine Learning (OML) Services now offers the Data Bias Detector through a REST API.
Benefits of addressing data bias
Proactively addressing data bias has multiple benefits for your company. Companies concerned with regulatory compliance know that AI/ML models are under increasing scrutiny and regulation, so detecting and mitigating potential issues can help with addressing relevant requirements and guidelines. Understanding bias can lead to more accurate and reliable decision-making for better customer experiences and more effective marketing. Mitigating bias also offers competitive advantage – a differentiator by prioritizing bias detection and mitigation.
Bias basics
Bias can exist in both datasets and machine learning models. In the data preparation step, data may not adequately represent the population from which they were drawn or may contain biased labels that were incorrectly or subjectively assigned due to human error or social stereotypes. Predictions using machine learning models trained on biased data reflect such bias.
To mitigate bias from being propagated or augmented in the later stages of the model building, minimizing or correcting data bias in the data preparation step of the machine learning process is desired. A popular and light-weight bias mitigation method, reweighing, is one approach. Some machine learning packages accept row (or sample) weights as a training parameter when building models. For example, in Oracle’s DBMS_DATA_MINING package, users can set the ODMS_ROW_WEIGHT_COLUMN_NAME in Global Settings while training a generalized linear model (GLM). For classification algorithms that do not incorporate row weights in the training process, the weighing matrices can serve as guidance for data resampling.
Bias can result from a range of factors, including how data is selected, measured, and labeled. For example, there are several types of bias that may be introduced through how we select data:
- Selection bias, which can result from sampling data in a way that doesn’t represent the overall population
- Survivorship bias, which focuses on cases with successful outcomes but ignores failures. This can lead to discovering misleading patterns
- Coverage bias, where for whatever reason your data collection method omits important population segments
OML Services Data Bias Detector
The OML Services Data Bias Detector provides REST endpoints for creating bias detector jobs. The Database Bias Detector calculates several metrics for common types of data bias: class imbalance (CI), statistical parity (SP), and conditional demographic disparity (CDD). The Data Bias Detector uses these three to simplify the user experience while providing valuable insight into data bias. As you might expect, the Data Bias Detector provides insight and recommendations, rather than specific guidance or actions. Let’s explore each of these in more detail.
Class Imbalance (CI)
Class imbalance occurs when you have too many examples of certain types of objects and too few of others, but you’re trying to predict all of them with similar accuracy. As you might expect models are less likely to accurately classify underrepresented objects. The class imbalance (CI) metric provides a simple way to understand potential issues. For example, if we have two groups within a dataset:
- If CI is positive, it indicates values indicate that group 1 has more training samples than group 2.
- Values near zero indicate the groups are relatively balanced.
- Negative values indicate the group 2 has more training samples in the dataset.
To address class imbalance, you might acquire more examples of the underrepresented class, or perform stratified sampling to balance the data from each group.
Statistical Parity (SP)
Statistical parity involves evaluating whether the distribution of positive predicted outcomes matches the distribution of underlying groups. Think about hiring. Statistical parity means that people hired from certain groups, such as gender or ethnicity, are proportional to their representation in the data. Statistical parity is also referred to as independence, group fairness, demographic parity, and disparate impact.
Like CI, the statistical parity (SP) metric also provides a simple way to understand potential issues:
- A perfect score of zero means that the model does not predict positively any of the subgroups at a different rate than it does for the rest of the population.
- A positive value indicates an outcome where group 1 is accepted more than rejected.
- A negative value indicates outcomes where group 1 is rejected more than accepted.
Even though SP indicates certain disparities, it doesn’t prescribe a recommended action since there may be other factors that help explain any disparities.
Conditional Demographic Disparity (CDD)
Conditional demographic disparity helps you identify hidden biases and assess fairness across different groups within a larger group. You can think about this visually in the following chart, where a trend appears in subgroups groups of your data but disappears or reverses when the groups are combined.
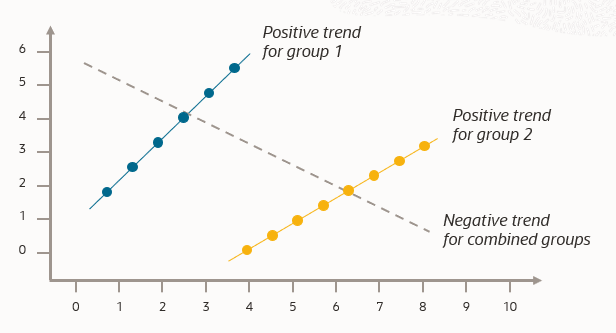
This is known as Simpson’s paradox, and CDD helps you discover this.
There are some classic cases of Simpson’s paradox. For example, consider the UC Berkeley Gender Bias Case from 1973, where male applicants had a higher acceptance rate than female applicants. But at the department level, no single department was significantly biased against women. To the contrary, many departments favored women. It was determined that the overall bias was due to women applying to more competitive departments with lower acceptance rates.
Interpreting the CDD metric is simple:
- Positive values indicate outcomes where group 1 is accepted more than rejected.
- Near zero values indicate no demographic disparity on average.
- Negative values indicate outcomes where group 1 is rejected more than accepted.
Summary
The Data Bias Detector provides quantitative measures of data bias to help you detect and mitigate data bias. The setting of a bias threshold is left to the user specific. Bias assessment depends on specific data features and each project’s objectives.
Try the new Oracle Machine Learning Services Data Bias Detector REST API through Oracle LiveLabs. Check out https://bit.ly/omlfundamentalshol for easy access to OML Services.
Resources
Data Bias Detector