The Oracle Linux Sustaining team is tasked with identifying and fixing bugs in the Linux kernel. We rely on a rich ecosystem of debugging tools like crash and pykdump to help us pick up the remnants of a crashed kernel and figure out what led to its demise. But operating systems are complex, and sometimes our tools fail us. In these cases, we have to fall back on our understanding of the kernel subsystems and the target CPU architecture, since we find ourselves diving deep into hex dumps and assembly listings.
Take something as simple as a stack trace. Many developers view these as a given, since computers are quite good at automatically unwinding a stack, looking up symbols, and producing the pretty trace we know and love. But in some exceptional cases (for example, interrupts occurring precisely on entry to a function call) an automatic unwinder can be led astray, producing an incorrect trace. In other cases, a debugging tool may not even recognize a portion of memory as a stack, leaving us without the option to unwind it.
Until recently, Linux Sustaining engineers have taken comfort in the knowledge that, when code is compiled with frame pointers, they are able to manually unwind the stack with relative ease. But the kernel community (at least, the x86_64 kernel community) is moving away from frame pointers. Increasingly, the community is migrating to an in-kernel debug information format called ORC, which enables the kernel to unwind stacks without relying on the frame pointer. As a result, manually unwinding a stack is no longer a simple matter of following a chain of frame pointers.
This blog post will first review the use of frame pointers for unwinding a stack on x86_64. Then, we will introduce the ORC format and describe its benefits. Finally, we’ll discuss how stack unwinding works for code built without frame pointers, and with ORC unwind info.
Frame Pointer Unwinds
When C code calls another function, the call instruction pushes the return address (that is, the address of the next instruction) onto the stack, before branching into the callee function’s code. In order to create a “stack trace” that’s human readable, you need to find each return address, lookup the name of the function associated with each one, and print each function name in sequence. However, functions use stack space for other purposes, most commonly to store the previous value of a callee-save register, or to store the value of a local variable. Each function’s stack space (“stack frame”) can have variable length, so there’s no way of knowing how many bytes are between each return address.
This is where frame pointers have historically come in. A frame pointer is a register which always contains the previous value of the stack pointer. On x86_64, the register in question is usually RBP. At the start of every function, a compiler with frame pointers enabled will generate code like this:
some_function:
    push %rbp       // #1
    mov %rsp, %rbp  // #2
    push %r14       // #3
    push %r13
    push %r12
    sub 0x8, %rsp   // #4
At instruction #1, the old frame pointer is pushed to the stack. Next, the old value of the stack pointer is copied into the RBP register (#2). After this, some callee-save registers are saved (#3), and then the function may allocate some stack space for local variables by subtracting the number of bytes from RSP (#4).
Thanks to this frame pointer register, the stack is now a linked list of “stack frames” which we can walk all the way to the beginning. At any point, we can just look at the current frame pointer register to get the previous value of RSP. And since the previous value of RSP happens to be the location where the previous frame pointer was stored, it’s just a chain of pointers crawling their way up the stack. Here’s an illustration:
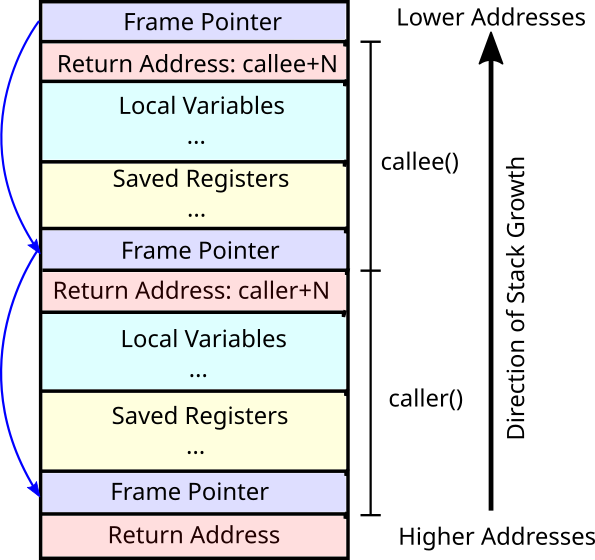
Each blue box is a frame pointer. The most recent stack frame is at the top of this image. If you follow its frame pointer, you see it points at the frame pointer from the older frame, which points at the next older frame, etc. Let’s look at an example of this, taken from the Linux kernel.
I deliberately corrupted a filesystem data structure with a NULL pointer, which caused the kernel to crash and take a core dump. Then, I used the crash utility to get the register state and a hex dump of the stack that crashed the kernel. It’s worth saying that crash is perfectly capable of computing and displaying the stack trace in this case, but the point of this exercise is to do it ourselves. Below are the relevant register values (RIP, the instruction pointer, and RBP, the frame pointer), along with the relevant stack data.
RIP: ffffffff9910d178
 RBP: ffff9b4e8057bb98

 Stack Memory Dump:
 ffff9b4e8057bb90: ffff8ce89eea71a0 ffff9b4e8057bbf8 <--
 ffff9b4e8057bba0: ffffffff990fb393 ffffffff991da4b5
 ffff9b4e8057bbb0: ffff8ce89eef4dc8 ffff9b4e8057bc14
 ffff9b4e8057bbc0: 0000000000000081 3a7fa5a2654d8f00
 ffff9b4e8057bbd0: ffff9b4e8057bcd0 0000000000000000
 ffff9b4e8057bbe0: 0000000000000000 0000000000000000
 ffff9b4e8057bbf0: 0000000000000002 ffff9b4e8057bc60 <--
 ffff9b4e8057bc00: ffffffff990fc1c9 ffff9b4e8057bc60
 ffff9b4e8057bc10: ffffffff990fcc42 0000000000000000
 ffff9b4e8057bc20: 0000000000000000 ffff8ce89eea7680
 ffff9b4e8057bc30: 3a7fa5a2654d8f00 ffff9b4e8057bcd0
 ffff9b4e8057bc40: ffff9b4e8057be30 ffff8ce88ec7e020
 ffff9b4e8057bc50: 0000000000000000 0000000000000002
 ffff9b4e8057bc60: ffff9b4e8057bcc0 ffffffff990fd20d <--
 ffff9b4e8057bc70: ffff9b4e8057bc80 ffffffff9910b4be
 ffff9b4e8057bc80: ffff9b4e8057bce0 ffffffff991d7146
 ffff9b4e8057bc90: 0000000000000018 3a7fa5a2654d8f00
 ffff9b4e8057bca0: 0000000000000004 ffff8ce88ec7e000
 ffff9b4e8057bcb0: 0000000000000004 ffff9b4e8057be30
 ffff9b4e8057bcc0: ffff9b4e8057bde8 ffffffff99101a80 <--
 ffff9b4e8057bcd0: ffff8ce801711060 ffff8ce89eea71a0
 ffff9b4e8057bce0: 0000000bbcc22e4a ffff8ce88ec7e020
 ffff9b4e8057bcf0: 0000000000000000 ffff8ce89eea7680
 ffff9b4e8057bd00: ffff8ce89eef4dc8 0000000200000044
 ffff9b4e8057bd10: 000007f2000016a4 0000000000000000
 ffff9b4e8057bd20: ffffffff00000000 ffff9b4e8057bd30
 ffff9b4e8057bd30: ffff9b4e8057bd88 0000000000000018
 ffff9b4e8057bd40: ffff9b4e8057bd70 ffffffff990e72fb
 ffff9b4e8057bd50: 00007fff8d4e1360 0000000000000fe0
 ffff9b4e8057bd60: 0000000000000fe0 ffff8ce88ec7e020
 ffff9b4e8057bd70: ffff9b4e8057bda8 ffffffff992aa3cc
 ffff9b4e8057bd80: ffff8ce88ec7e000 00007fff8d4e1360
 ffff9b4e8057bd90: ffff8ce88ec7e000 0000000000000000
 ffff9b4e8057bda0: 0000000000000002 ffffff9c8057bde8
 ffff9b4e8057bdb0: ffffffff99100ccf 3a7fa5a2654d8f00
 ffff9b4e8057bdc0: 0000000000000004 0000000000000004
 ffff9b4e8057bdd0: 00000000ffffff9c ffff9b4e8057be30
 ffff9b4e8057bde0: 00007fff8d4e1360 ffff9b4e8057be10 <--
 ffff9b4e8057bdf0: ffffffff99101c3e 0000000000000004
 ffff9b4e8057be00: 0000000000000100 00000000ffffff9c
 ffff9b4e8057be10: ffff9b4e8057be70 ffffffff990f4437 <--
 ffff9b4e8057be20: ffff9b4e8057be80 ffff8ce88ec7e000
 ffff9b4e8057be30: 00007fff8d4e1360 0000000000000000
 ffff9b4e8057be40: 3a7fa5a2654d8f00 00007fff8d4e1240
 ffff9b4e8057be50: ffff9b4e8057bf58 0000000000000000
 ffff9b4e8057be60: 0000000000000000 0000000000000000
 ffff9b4e8057be70: ffff9b4e8057bf18 ffffffff990f55e4 <--
 ffff9b4e8057be80: ffffffffffffffc3 00007f81166f86a4
 ffff9b4e8057be90: ffff9b4e8057bf58 00000000c000003e
 ffff9b4e8057bea0: 0000000000000000 ffff9b4e8057bf28
 ffff9b4e8057beb0: ffffffff98e03c6a 0000000000000000
 ffff9b4e8057bec0: ffff9b4e8057bef8 ffffffff98f851aa
 ffff9b4e8057bed0: 0000000000000080 ffff9b4e8057bf58
 ffff9b4e8057bee0: ffff9b4e8057bf58 0000000000000000
 ffff9b4e8057bef0: 0000000000000000 3a7fa5a2654d8f00
 ffff9b4e8057bf00: 000000000000014c 3a7fa5a2654d8f00
 ffff9b4e8057bf10: 000000000000014c ffff9b4e8057bf28 <--
 ffff9b4e8057bf20: ffffffff990f5644 ffff9b4e8057bf48 <--
 ffff9b4e8057bf30: ffffffff98e044f0 0000000000000000
 ffff9b4e8057bf40: 0000000000000000 0000000000000000 <--
 ffff9b4e8057bf50: ffffffff998001b8 000056020a7ff458
This is a pretty large chunk of memory to show on screen. The memory dump is formatted with 2 64-bit words per line. The address of the first word is printed before the colon, and memory addresses increase left to right, top to bottom. On x86_64, the stack grows toward the lower addresses, so the most recent stack frame is at the top of this listing (just like the diagram). To help you read it, I’ve bolded each frame pointer (RBP). Let’s go ahead and unwind this stack by hand:
We start with the current RBP value, ffff9b4e8057bb98. This points at the second word of memory in the dump, which is the first bolded word. That word itself contains the value ffff9b4e8057bbf8, which is the previous value for RBP. We can look that address up a few lines down, finding the next prior RBP value of ffff9b4e8057bc60. If we continue this chain of pointers all the way down the stack, we will get the following values (all of the bolded values from the listing above):
ffff9b4e8057bb98 (starting RBP value)
ffff9b4e8057bbf8
ffff9b4e8057bc60
ffff9b4e8057bcc0
ffff9b4e8057bde8
ffff9b4e8057be10
ffff9b4e8057be70
ffff9b4e8057bf18
ffff9b4e8057bf28
ffff9b4e8057bf48
0000000000000000
Notice that only the last few digits of these addresses change, because they are pointers to within the stack, and the stack is a contiguous block of memory. Once you notice this pattern, it can be quite easy to pick out stack frames in a hex dump. Frequently, I like to paste the hex data into a text editor with a highlighting search function, like vim. You can search the prefix (in this case, ffff9b4e8057b) to highlight these addresses on the stack. However, your eyes may deceive you! Not all addresses on the stack starting with these digits are necessarily frame pointer values. Since the stack is constantly getting reused (and not re-initialized) between function calls, it’s very common to see stale data, like old frame pointers, or maybe pointers to stack variables. So while the search method is better than nothing, you’re better off manually following the frame pointer list.
The last address in this list is all zeros. It seems to indicate that the value RBP had before the first function call was zero. I’m not sure whether it’s guaranteed that this value is always zero. In general, the first RBP value you see which doesn’t obviously point within the stack, is where you should stop unwinding.
At this point, we have a list of frame pointers, but what we really need is a list of return addresses. On x86_64, the call instruction pushes the return address to the stack, jumps to the beginning of the called function, and the called function then pushes RBP to the stack one word address “below” the return address (since the stack grows to lower addresses). We can read these values by looking at the stack words which are at the next address after each bolded RBP value on the memory dump, since the memory dump is in ascending order of memory addresses.
ffffffff9910d178  (starting RIP value)
ffffffff990fb393
ffffffff990fc1c9
ffffffff990fd20d
ffffffff99101a80
ffffffff99101c3e
ffffffff990f4437
ffffffff990f55e4
ffffffff990f5644
ffffffff98e044f0
ffffffff998001b8
First, notice that at the top of the list I prepended the current RIP value. This is the currently executing instruction, so it is the absolute most recent function call. The remaining addresses come directly from the values pushed to the stack.
Second, notice how all of these addresses start with ffffffff9. This prefix has to do with the location that the kernel image got mapped at. Due to KASLR (kernel address space layout randomization), this location will be different each time the kernel boots. However, once you determine this prefix, you can easily locate code addresses on the stack using the same highlighting method in your text editor. These code addresses could be return addresses, but they could also be function pointers that got pushed to the stack.
Third, recall that these are all return addresses: that is, they are the instruction that the CPU should begin executing after the function call completes. For the purpose of a stack trace, you typically want to see the address of the currently executing instruction. So technically, it would be a good idea to subtract one from each address here, to ensure that we’re looking at the correct instruction. But I’m going to skip this step for simplicity.
With these observations out of the way, we now need to take the final step: mapping these return addresses to function names, to get the pretty stack trace we’re hoping for. Unfortunately, KASLR makes this difficult, since these addresses don’t correspond to the ones which the linker assigned when the kernel was compiled! However, currently Linux’s KASLR does not randomize the order of functions within the kernel image (so-called “Function Granular KASLR”). So, assuming we know the mapping offset, we’ll be able to subtract it from each code address, and lookup the resulting offset in the kernel’s symbol table.
Thankfully, just before it finished crashing, the kernel printed the following line to the log:
[ 136.773552] Kernel Offset: 0x17e00000 from 0xffffffff81000000 (relocation range: 0xffffffff80000000-0xffffffffbfffffff)
This tells us that the kernel text section is offset 0x17e00000 from the memory address 0xffffffff81000000. Taken together, if we subtract the value 0xffffffff98e00000 from each address, we will arrive at the true offset of each function in the kernel’s text (i.e. code) section. I’ve taken the liberty of doing that math for each of the return addresses above:
0x79ea3
0x161132
0xa75b0
0x5b8cc5
0x5b9141
0x5b964f
0x390d0e
0x2ec97b
0x2ef56b
0x2ef841
0x2ef8da
0x44f0
0xa001b8
Now, we can use the addr2line tool, along with the vmlinux file found in the kernel-uek-debuginfo package, to format these offsets as functions and line numbers:
$ addr2line -e /usr/lib/debug/lib/modules/5.4.17-2136.304.4.1.el8uek.x86_64/vmlinux \
            -j .text -ipfas \
            0x30d178 0x2fb393 0x2fc1c9 0x2fd20d 0x301a80 0x301c3e 0x2f4437 0x2f55e4 \
            0x2f5644 0x44f0 0xa001b8

0x000000000030d178: read_word_at_a_time at compiler.h:350
 (inlined by) dentry_string_cmp at dcache.c:252
 (inlined by) dentry_cmp at dcache.c:406
 (inlined by) __d_lookup_rcu at dcache.c:2672
0x00000000002fb393: lookup_fast at namei.c:1659
0x00000000002fc1c9: walk_component at namei.c:1909
0x00000000002fd20d: path_lookupat at namei.c:2433
0x0000000000301a80: filename_lookup at namei.c:2463
0x0000000000301c3e: user_path_at_empty at namei.c:2725
0x00000000002f4437: vfs_statx at stat.c:198
0x00000000002f55e4: do_statx at stat.c:582
0x00000000002f5644: __x64_sys_statx at stat.c:599
0x00000000000044f0: do_syscall_64 at common.c:296
0x0000000000a001b8: entry_SYSCALL_64_after_hwframe at entry_64.S:188
This is our nicely formatted stack trace! Notice that addr2line even took the liberty of showing the functions which got inlined by __d_lookup_rcu(), which would help us locate the exact part of the function where we crashed.
As I mentioned already, I inserted a NULL pointer into a filesystem data structure, so this stack simply shows the kernel crashing as it attempted to read a corrupted structure. Thankfully, it’s not a real bug in the kernel!
Why Ditch the Frame Pointer?
This article is supposed to be about ORC, but thus far we’ve focused on frame pointers. So how does ORC tie in? The frame pointer was a really great tool for us to unwind the stack, but the fact of the matter is that it’s inefficient. The compiler absolutely does not need to use a frame pointer. Since the compiler generates the assembly code for each function, it knows exactly how many saved registers and local variables every function uses. Thus, it knows the size of each function’s stack frame without even consulting the frame pointer. An entire CPU register is being wasted, at all times, just for the rather rare times that we may want to examine the stack and unwind it. Beyond just wasting the register slot, we also have to insert instructions to push and pop the frame pointer from the stack.
CPU registers are a limited resource – every free register is a variable we could potentially avoid storing in memory. Similarly, cache space is also limited. If we use fewer instructions to create stack frames, and we also use less stack memory, we’ll have more cache space available for critical data, resulting in fewer cache misses. While the difference sounds small, when you’re talking about nearly every function in the Linux kernel, the performance benefit adds up! According to an analysis by Mel Gorman, using frame pointers added overhead of up to 5-10% in some memory management related benchmarks.
So if frame pointers are expensive, how can we get rid of them while maintaining the ability to unwind the stack? Well, the compiler itself knows the state of the stack at every point in a function. It actually can output some of that information into debuginfo, such as the DWARF format (the name stands for nothing except a cheeky play on ELF, either an Executable Linkable Format, or a creature found in Middle Earth). Most debugging tools, like crash and GDB, can read this DWARF information and use it to unwind stacks without relying on the frame pointer. But the kernel itself doesn’t have access to this data for use unwinding stacks at runtime, so it has historically relied on frame pointers. Normally, kernels have debuginfo stripped because it is quite large. And even if the information were available to the kernel, it would be quite complex to use properly. This LWN article goes into detail on this issue, which motivated the creation of ORC.
ORC (whose name was another play on Middle Earth, but has since been dubbed the “Oops Replay Capability”) is a simplified debug information format which contains only the information necessary to unwind the stack. Essentially, the kernel stores a large array of records, each of which is associated with one or more instructions. Given an instruction, its ORC entry can tell you how to compute the stack pointer value from before the current function call. The kernel’s unwinding routines reference this information to print stack traces, but we can also use it manually if necessary.
ORC Records and Unwind Algorithm
In order to actually get the ORC information out of the kernel, we first need to get a kernel compiled with ORC information. Upstream, this is now the default for x86_64. You’ll want to make sure you configure your source tree with CONFIG_UNWINDER_ORC=y, and you’ll also want to disable CONFIG_UNWINDER_FRAME_POINTER and CONFIG_FRAME_POINTER to get rid of those pesky frame pointers. Once you have a kernel built with ORC, you need to extract the ORC data from the kernel image. Thankfully, the kernel’s objtool program has the ability to do that, with the command objtool orc dump. To start using this program, with a clean Linux source tree you can run:
$ make -C tools objtool
$ tools/objtool/objtool -h
Using the vmlinux file from your kernel build (or from a kernel debuginfo RPM), we can extract the ORC information:
$ tools/objtool/objtool orc dump path/to/vmlinux >orc-dump.txt
This is a textual format which looks something like this:
.text+325d: sp:(und) bp:(und) type:call end:0
.text+3260: sp:sp+8 bp:(und) type:call end:0
.text+3262: sp:sp+16 bp:(und) type:call end:0
.text+3267: sp:sp+24 bp:(und) type:call end:0
.text+326b: sp:sp+32 bp:prevsp-32 type:call end:0
.text+326f: sp:sp+40 bp:prevsp-32 type:call end:0
.text+3273: sp:sp+96 bp:prevsp-32 type:call end:0
.text+331d: sp:sp+40 bp:prevsp-32 type:call end:0
.text+331e: sp:sp+32 bp:prevsp-32 type:call end:0
.text+331f: sp:sp+24 bp:(und) type:call end:0
.text+3321: sp:sp+16 bp:(und) type:call end:0
.text+3323: sp:sp+8 bp:(und) type:call end:0
These fields contain information necessary to compute the values of RSP, RBP, and RIP from before the current function call. For simplicity, we’ll call those PREV_RSP, PREV_RBP and PREV_RIP respectively. The “sp” field gives information on how to compute PREV_RSP, and the “bp” field gives information on how to compute PREV_RBP. We can compute PREV_RIP based on the PREV_RSP value, which I’ll get to in a moment.
To better understand how to use these records, let’s consider the unwinding algorithm. For frame pointer unwinds, it is simple: start at the top stack frame (i.e. the deepest). Dereference the RBP value to find the next RBP value, etc, until you find one which doesn’t fit – then you’re done. For the ORC algorithm, we also start at the top of the stack, with the current register values. The unwinder follows these steps at each frame, which can be found in the kernel’s unwinder implementation:
- Lookup the ORC record corresponding to the instruction in question. Each of the lines above corresponds to one ORC record. Each record is associated with an instruction offset, and the records are kept in sorted order. A record is valid starting from the instruction offset listed, until the next record.
- Compute the
PREV_RSPvalue using thespfield, which will specify a starting register and an offset. Simply add the register value and offset to get thePREV_RSPvalue. - During normal function calls,
RIPis pushed to the stack, which means it is written toRSP - 8. Thus, we can find the value forPREV_RIPby looking at whatever value was stored in the stack at addressPREV_RSP - 8. I’ll use the notation of*(PREV_RSP - 8)to show that we’re actually reading the value out of the stack, like dereferencing a pointer in C. - Finally, we also compute
PREV_RBPby using thebpfield. WhenRBPis not being used as a frame pointer, the x86_64 ABI requires that it be preserved across functions (this is, it is callee-saved). Thus, thebpfield tells us the location thatRBPwas pushed to, so it requires reading a value out of the stack (just likePREV_RIP, but different from computingPREV_RSP). So, if thebpfield saysbp:prevsp-32, then we would computePREV_RBP = *(PREV_RSP - 32). It’s also possible for thebpfield to be undefined, in which case the register was not pushed to the stack and it stayed the same during the function call.
It may seem a bit odd that we’re computing the previous value of RBP. It turns out that some stack frames still use frame pointers. There are likely several reasons for this. One may be that they are useful for the compiler when a function has many local variables. But another crucial reason is that the kernel just-in-time compiles code (for instance, eBPF code) which uses frame pointers. It would be a pain for these just-in-time compilers to also emit ORC entries for these functions.
Unwinding an ORC Stack
Let’s now use this algorithm to unwind another example stack. For this example, I crashed a kernel in the same way as before, except this kernel, while based on UEK6, had frame pointers disabled, and ORC unwinder enabled. As it crashed, the kernel log contained the following information about the KASLR offset:
[80253.572504] Kernel Offset: 0x2d000000 from 0xffffffff81000000 (relocation range: 0xffffffff80000000-0xffffffffbfffffff)
Since we need to lookup instruction offsets within orc-dump.txt, we’ll need to use this offset at each step to convert KASLR addresses to the .text offset. In this case, we got really lucky. The offset is 0xffffffffae000000, and you may notice that the last 6 digits are all 0. Since all the code offsets are 6 digits or less, we can actually just examine the last 6 digits of any RIP value in order to get the .text offset, which saves us some subtraction. Note that this was just by chance: you might not get this lucky every time.
Without further ado, here’s the stack and starting register values for this crash:
RIP: ffffffffae2f1da3
RSP: ffffa764404a3bb8
RBP: 0000000000000002

Stack Memory Dump:

ffffa764404a3bd0:  ffffa764404a3d20 0000000000000000
ffffa764404a3be0:  ffffa764404a3c70 ffffa764404a3c68
ffffa764404a3bf0:  ffff9b6618da0160 ffff9b65324539c0
ffffa764404a3c00:  ffffffffae2e07d2 ffffa764404a3c64
ffffa764404a3c10:  ffff9b652eb9da88 0000000000000081
ffffa764404a3c20:  6a3cd98592691a00 ffffa764404a3d20
ffffa764404a3c30:  0000000000000000 0000000000000000
ffffa764404a3c40:  ffff9b662fd5c020 0000000000000000
ffffa764404a3c50:  0000000000000002 ffffffffae2e15a8
ffffa764404a3c60:  ffffffffc08b9521 0000000000000000
ffffa764404a3c70:  0000000000000000 6a3cd98592691a00
ffffa764404a3c80:  6a3cd98592691a00 ffffa764404a3d20
ffffa764404a3c90:  ffffa764404a3d10 ffffa764404a3e48
ffffa764404a3ca0:  ffff9b662fd5c020 0000000000000000
ffffa764404a3cb0:  0000000000000002 ffffffffae2e259d
ffffa764404a3cc0:  ffffffffffffffc3 ffffffffae3b5256
ffffa764404a3cd0:  ffffa764404a3da8 ffffa764404a3d58
ffffa764404a3ce0:  0000000000000000 6a3cd98592691a00
ffffa764404a3cf0:  0000000000000004 ffff9b662fd5c000
ffffa764404a3d00:  0000000000000004 ffffa764404a3e48
ffffa764404a3d10:  ffffa764404a3e30 ffffffffae2e6bc0
ffffa764404a3d20:  ffff9b6618da0160 ffff9b65324539c0
ffffa764404a3d30:  0000000b60e803be ffff9b662fd5c020
ffffa764404a3d40:  0000000000000000 0000000000000018
ffffa764404a3d50:  ffff9b652eb9da88 0000000200000044
ffffa764404a3d60:  0000e5500000191a 0000000000000000
ffffa764404a3d70:  ffffa76400000000 ffffa764404a3d80
ffffa764404a3d80:  0000000000000018 ffffffffae2cd3a2
ffffa764404a3d90:  00007fffc52f6fd0 0000000000000fe0
ffffa764404a3da0:  0000000000000fe0 ffff9b662fd5c020
ffffa764404a3db0:  ffffffffae480db7 ffff9b662fd5c000
ffffa764404a3dc0:  00007fffc52f6fd0 0000000000000000
ffffa764404a3dd0:  0000000000000004 ffffa764404a3e98
ffffa764404a3de0:  ffff9b662fd5c000 0000000000000000
ffffa764404a3df0:  0000000000000004 ffffff9cffffff9c
ffffa764404a3e00:  ffffa764404a3e48 6a3cd98592691a00
ffffa764404a3e10:  0000000000000004 00000000ffffff9c
ffffa764404a3e20:  00007fffc52f6fd0 ffffa764404a3e98
ffffa764404a3e30:  0000000000000100 ffffffffae2d9d34
ffffa764404a3e40:  0000000000000fe0 0000000000000fe0
ffffa764404a3e50:  ffff9b662fd5c020 6a3cd98592691a00
ffffa764404a3e60:  00007fffc52f6eb0 ffffa764404a3f58
ffffa764404a3e70:  0000000000000000 0000000000000000
ffffa764404a3e80:  0000000000000000 0000000000000000
ffffa764404a3e90:  ffffffffae2dadb0 ffffa764404a3e98
ffffa764404a3ea0:  ffffa764404a3e98 ffffa764404a3f58
ffffa764404a3eb0:  00000000c000003e 0000000000000000
ffffa764404a3ec0:  ffffffffae003b78 0000000000000000
ffffa764404a3ed0:  0000000000000000 ffffffffae175c29
ffffa764404a3ee0:  0000000000000080 ffffa764404a3f58
ffffa764404a3ef0:  ffffa764404a3f58 0000000000000000
ffffa764404a3f00:  0000000000000000 6a3cd98592691a00
ffffa764404a3f10:  000000000000014c ffffa764404a3f58
ffffa764404a3f20:  6a3cd98592691a00 000000000000014c
ffffa764404a3f30:  ffffffffae2dae10 ffffffffae0043bb
ffffa764404a3f40:  0000000000000000 0000000000000000
ffffa764404a3f50:  ffffffffaea001b8 000055ceb29f9778
Let’s follow the steps of the ORC unwinder. We know the RSP, RIP, and RBP values. To unwind one frame, we need to compute the previous values of each. And in order to do that, we need the ORC record corresponding with RIP=ffffffffae2f1da3. We know that this is .text offset 0x2f1da3, and when we search for the matching ORC entry, we find this one:
.text+2f1d03: sp:sp+80 bp:prevsp-48 type:call end:0
Notice that this record is for .text+2f1d03, but we were looking for offset 2f1da3. As I mentioned earlier, ORC records are valid starting from the offset they contain, up until the next ORC entry. This is the last record with offset less than or equal to the RIP value, so it is the one we should use. Now, we can compute PREV_RSP:
PREV_RSP = RSP + 80
         = 0xffffa764404a3bb8 + 80 = 0xffffa764404a3c08
Now that we know PREV_RSP, we know that PREV_RIP is stored on the stack 8 bytes below it:
PREV_RIP = *(PREV_RSP - 8)
         = *(0xffffa764404a3c08 - 8)
         = *(0xffffa764404a3c00) = 0xffffffffae2e07d2
And finally, the ORC entry says that PREV_RBP was pushed to an address 48 bytes below PREV_RSP, so we can compute it:
PREV_RBP = *(PREV_RSP - 48)
         = *(0xffffa764404a3c08 - 48)
         = *(0xffffa764404a3c08 - 48)
         = *(0xffffa764404a3bd8) = 0x0000000000000000
And that’s it! We have unwound one stack frame. We computed PREV_RSP, PREV_RIP, and PREV_RBP. These will now become RSP, RIP, and RBP, respectively, and we’ll continue the unwind. I’ll summarize the register state and the computations for the each of the next unwind steps below:
RSP: ffffa764404a3c08  RIP: ffffffffae2e07d2
RBP: 0000000000000000
.text offset: 0x2e07d2
.text+2e07a0: sp:sp+88 bp:prevsp-48 type:call end:0
PREV_RSP = RSP + 88
         = 0xffffa764404a3c08 + 88 = 0xffffa764404a3c60
PREV_RIP = *(PREV_RSP - 8)
         = *(0xffffa764404a3c60 - 8)
         = *(0xffffa764404a3c58) = 0xffffffffae2e15a8
PREV_RBP = *(PREV_RSP - 48)
         = *(0xffffa764404a3c60 - 48)
         = *(0xffffa764404a3c30) = 0x0000000000000000

RSP: ffffa764404a3c60  RIP: ffffffffae2e15a8
RBP: 0000000000000000
.text offset: 0x2e15a8
.text+2e1579: sp:sp+96 bp:prevsp-48 type:call end:0
PREV_RSP = RSP + 96
         = 0xffffa764404a3c60 + 96 = 0xffffa764404a3cc0
PREV_RIP = *(PREV_RSP - 8)
         = *(0xffffa764404a3cc0 - 8)
         = *(0xffffa764404a3cb8) = 0xffffffffae2e259d
PREV_RBP = *(PREV_RSP - 48)
         = *(0xffffa764404a3cc0 - 48)
         = *(0xffffa764404a3c90) = 0xffffa764404a3d10

RSP: ffffa764404a3cc0  RIP: ffffffffae2e259d
RBP: ffffa764404a3d10
.text offset: 0x2e259d
.text+2e2539: sp:bp+16 bp:prevsp-16 type:call end:0
PREV_RSP = RBP + 16
         = 0xffffa764404a3d10 + 16 = 0xffffa764404a3d20
PREV_RIP = *(PREV_RSP - 8)
         = *(0xffffa764404a3d20 - 8)
         = *(0xffffa764404a3d18) = 0xffffffffae2e6bc0
PREV_RBP = *(PREV_RSP - 16)
         = *(0xffffa764404a3d20 - 16)
         = *(0xffffa764404a3d10) = 0xffffa764404a3e30
Let me pause here to point out something interesting. For the first several frames, we were simply subtracting offsets from RSP to compute PREV_RSP. But in this most recent stack frame, the ORC entry read sp:bp+16, so we actually used RBP to help us compute the next stack frame. What’s more, bp:prevsp-16 means that we computed PREV_RBP = *(PREV_RSP - 16) = *(RBP + 16 - 16) = *RBP. And also, to get PREV_RIP, we computed *(PREV_RSP - 8) = *(RBP + 16 - 8) = *(RBP + 8).
If you think back to the frame-pointer based unwind, we simply dereferenced each RBP value to get the previous RBP, and we looked at the value one word higher on the stack to find the corresponding RIP value. The computations we did in this stack frame are the exact same. In other words, this stack frame actually uses a frame pointer! And the ORC entry sp:bp+16 bp:prevsp-16 is a shorthand for doing a frame-pointer based unwind using the ORC algorithm. The kernel’s unwinder even defines a helper variable containing this entry, for use in code which it knows was compiled with frame pointers.
The unwind continues:
RSP: ffffa764404a3d20  RIP: ffffffffae2e6bc0
RBP: 0xffffa764404a3e30
.text offset: 0x2e6bc0
sp:bp+16 bp:prevsp-16 type:call end:0
PREV_RSP = RBP + 16
         = 0xffffa764404a3e30 + 16 = 0xffffa764404a3e40
PREV_RIP = *(PREV_RSP - 8)
         = *(0xffffa764404a3e40 - 8)
         = *(0xffffa764404a3e38) = 0xffffffffae2d9d34
PREV_RBP = *(PREV_RSP - 16)
         = *(0xffffa764404a3e40 - 16)
         = *(0xffffa764404a3e30) = 0x0000000000000100

RSP: ffffa764404a3e40  RIP: ffffffffae2d9d34
RBP: 000000000000100
.text offset: 0x2d9d34
.text+2d9cd3: sp:sp+88 bp:prevsp-48 type:call end:0
PREV_RSP = RSP + 88
         = 0xffffa764404a3e40 + 88 = 0xffffa764404a3e98
PREV_RIP = *(PREV_RSP - 8)
         = *(0xffffa764404a3e98 - 8)
         = *0xffffa764404a3e90 = 0xffffffffae2dadb0
PREV_RBP = *(PREV_RSP - 48)
         = *(0xffffa764404a3e98 - 48)
         = *(0xffffa764404a3e68) = 0xffffa764404a3f58

RSP: ffffa764404a3e98  RIP: ffffffffae2dadb0
RBP: ffffa764404a3f58
.text offset: 0x2dadb0
.text+2dad7d: sp:sp+160 bp:(und) type:call end:0
PREV_RSP = RSP + 160
         = 0xffffa764404a3e98 + 160
         = 0xffffa764404a3f38
PREV_RBP = 0xffffa764404a3f58
PREV_RIP = *(PREV_RSP - 8)
         = *(0xffffa764404a3f38 - 8)
         = *(0xffffa764404a3f30) = 0xffffffffae2dae10
Here we encounter the entry bp:(und). This “undefined” value actually means that the frame pointer was not pushed to the stack or changed since the previous stack frame, so we continue with PREV_RBP = RBP.
RSP: ffffa764404a3f38  RIP: ffffffffae2dae10
RBP: ffffa764404a3f58
.text offset: 0x2dae10
.text+2dadf0: sp:sp+8 bp:(und) type:call end:0
PREV_RSP = RSP + 8
         = 0xffffa764404a3f38 + 8
         = 0xffffa764404a3f40
PREV_RBP = 0xffffa764404a3f58
PREV_RIP = *(PREV_RSP - 8)
         = *(0xffffa764404a3f40 - 8)
         = *0xffffa764404a3f38 = 0xffffffffae0043bb

RSP: ffffa764404a3f40  RIP: ffffffffae0043bb
.text offset: 0x43bb
.text+436a: sp:sp+24 bp:prevsp-16 type:call end:0
PREV_RSP = RSP + 24
         = 0xffffa764404a3f40 + 24
         = 0xffffa764404a3f58
PREV_RBP = *(PREV_RSP - 16)
         = *(ffffa764404a3f58 - 16)
         = *(ffffa764404a3f48) = 0x0000000000000000
PREV_RIP = *(PREV_RSP - 8)
         = *(0xffffa764404a3f58 - 8)
         = *(0xffffa764404a3f50) = 0xffffffffaea001b8

RSP: ffffa764404a3f58  RIP: ffffffffaea001b8
RBP: 0000000000000000
.text offset: 0xa001b8
.text+a001a8: sp:sp+0 bp:(und) type:regs end:0
The is the last stack frame: the ORC entry shows, rather than type:call, that it is of type:regs. This means that the entry corresponds to a register dump (a struct pt_regs in the kernel). Since our stack corresponds to a system call, we’ve reached the part of the stack where the kernel dumped the userspace registers, and there is no further for us to unwind.
Now, we can go ahead and gather all of the RIP values from the unwind. Since we ended up removing the KASLR offset from them as part of the unwind, I’ll just list the .text offsets here:
0x2f1da3
0x2e07d2
0x2e15a8
0x2e259d
0x2e6bc0
0x2d9d34
0x2dadb0
0x2dae10
0x43bb
0xa001b8
Using a similar addr2line command as above, we can convert this list of addresses into a real stack trace:
$ addr2line -e vmlinux-5.4.17-2136.304.4.1.OLB3_133.el8uek.dev.x86_64 \
            -j .text -ipfas \
            0x2f1da3 0x2e07d2 0x2e15a8 0x2e259d 0x2e6bc0 0x2d9d34 \
            0x2dadb0 0x2dae10 0x43bb 0xa001b8

0x00000000002f1da3: read_word_at_a_time at compiler.h:350
 (inlined by) dentry_string_cmp at dcache.c:252
 (inlined by) dentry_cmp at dcache.c:406
 (inlined by) __d_lookup_rcu at dcache.c:2672
0x00000000002e07d2: lookup_fast at namei.c:1659
0x00000000002e15a8: walk_component at namei.c:1909
0x00000000002e259d: path_lookupat at namei.c:2433
0x00000000002e6bc0: filename_lookup at namei.c:2463
0x00000000002d9d34: vfs_statx at stat.c:198
0x00000000002dadb0: do_statx at stat.c:582
0x00000000002dae10: __do_sys_statx at stat.c:604
 (inlined by) __se_sys_statx at stat.c:599
 (inlined by) __x64_sys_statx at stat.c:599
0x00000000000043bb: do_syscall_64 at common.c:296
0x0000000000a001b8: entry_SYSCALL_64_after_hwframe at entry_64.S:188
As expected, this got us pretty much the same call stack! The only difference being that addr2line found some inline functions to unwind which it didn’t before.
This example definitely doesn’t explore all of the possibilities of a stack unwinder using ORC. ORC entries can reference more than just RBP and RSP registers, and have more types than the regs and call illustrated here. This simple example just serves to illustrate the overall idea of ORC, and should serve as a reference if you decide to unwind your own ORC stack. The unwinder implementation within the kernel is well written and, with some study, shouldn’t be too difficult to understand. You can find it below:
arch/x86/include/asm/orc_types.hcontains the definition ofstruct orc_entry, which corresponds to one line from theobjtool orc dumpoutput.arch/x86/kernel/unwind_orc.ccontains the code that implements the ORC unwind.
Quantifying the Benefits
Now that we’ve seen ORC in action, let’s reexamine some of the claimed benefits of removing frame pointers. While unwinding the ORC stack, we saw that two functions still ended up using frame pointers (their ORC entries were sp:bp+16 bp:prevsp-16). These happened to be the functions path_lookupat() and filename_lookup(). I’m not certain why this happened! It does make you wonder, why bother disabling frame pointers, if the compiler might still decide to add them in? Is there really any benefit? So I decided to compare the two kernel examples, to answer two questions:
- Did eliminating frame pointers really reduce stack usage?
- Did eliminating frame pointers reduce the number of instructions in the kernel?
For the first question, I compared the stack pointers of both crashing stacks. These stacks should end on a page boundary, so I computed the difference between the stack pointer and the end of the page, to determine how many bytes of stack were in use at the time of the crash:
Kernel with Frame Pointers: ffff9b4e8057bb50 (end of page: 0xffff9b4e8057c000)
                            1200 bytes stack
Kernel with ORC           : ffffa764404a3bb8 (end of page: 0xffffa764404a4000)
                            1096 bytes stack
In our example, the ORC kernel was using 104 fewer bytes of stack at the time of the crash. This is actually a fairly impressive decrease of around 8.7%. A typical cache line is 64 bytes, so the stack already used one fewer cache line. For more complex and CPU intensive operations, the improvement would likely be more noticeable.
For the second question, one way to answer this subjectively is to compare function disassembly. Let’s compare the first few lines of code for the same function:
Kernel with Frame Pointers:

crash> dis lookup_fast | head -n 5
0xffffffff990fb340 <lookup_fast>:       nopl   0x0(%rax,%rax,1) [FTRACE NOP]
0xffffffff990fb345 <lookup_fast+5>:     push   %rbp
0xffffffff990fb346 <lookup_fast+6>:     mov    %rsp,%rbp
0xffffffff990fb349 <lookup_fast+9>:     push   %r15
0xffffffff990fb34b <lookup_fast+11>:    push   %r14

Kernel with ORC:

crash> dis lookup_fast | head -n 5
0xffffffffae2e0780 <lookup_fast>:       nopl   0x0(%rax,%rax,1) [FTRACE NOP]
0xffffffffae2e0785 <lookup_fast+5>:     push   %r15
0xffffffffae2e0787 <lookup_fast+7>:     push   %r14
0xffffffffae2e0789 <lookup_fast+9>:     push   %r13
0xffffffffae2e078b <lookup_fast+11>:    mov    %rdx,%r13
We can see plain as day that the instructions push %rbp; mov %rsp, %rbp are missing in the ORC kernel. The ORC version uses fewer instructions because it is not managing the frame pointer. But some other functions do still use frame pointers. To get a sense for the overall change in code size, we can use the tool scripts/bloat-o-meter which comes with the kernel. I get the following result:
$ scripts/bloat-o-meter vmlinux-fp vmlinux-orc
add/remove: 21/11 grow/shrink: 3826/42026 up/down: 37651/-398389 (-360738)
Function                                     old     new   delta
unwind_next_frame                             25    1480   +1455
orc_find.part                                  -     461    +461
fbcon_bmove_rec                                -     457    +457
unwind_init                                    -     387    +387
hidinput_configure_usage                   15166   15540    +374
... around 45,800 lines of output ...
process_measurement                         2781    2276    -505
load_image_lzo                              3502    2992    -510
unwind_next_frame.part                       519       -    -519
usb_get_configuration.cold                  2944    2421    -523
usb_get_configuration                       7887    7058    -829
Total: Before=32225110, After=31864372, chg -1.12%
The script shows some overall statistics, and also lists out every function’s size change. 3826 functions increased in size, and 42k decreased. The overall net decrease in code size was 360,738 bytes, or about 1.12%.
Of course, to be fair, this decrease was achieved by adding just under 4MiB of ORC records to the kernel image, an addition which dwarfs the roughly 360KiB code size decrease. But the major benefit to this decrease is not overall memory size, but a decrease in instruction cache footprint. ORC data is rarely used, and does not need to remain in the instruction cache, while these functions do.
Conclusion
In this article we manually unwound two nearly identical x86_64 kernel stacks using two different algorithms: a frame-pointer unwind and ORC unwind. While the ORC unwind is more complex, it is still feasible to do by hand. It is this simplicity which allows the kernel to include builtin ORC unwind capabilities, and thus to eliminate frame pointers. And, as we’ve seen, removing frame pointers means code that uses fewer registers and instructions, resulting in a smaller cache footprint and runtime speedups.
Thankfully, many kernel debugging tools (e.g. crash, and the kernel itself) have builtin support for unwinding with ORC, or its older sibling DWARF, so it would be an exceptional circumstance if you needed to perform this manual process for yourself. But sometimes kernel debugging produces just these sort of exceptional circumstances, so it’s good to be aware of the possibilities. If nothing else, I hope this example sheds light on what ORC does and how it does it, without dwelling on the drier details.