Introduction
The Non-Volatile Memory express (NVMe) is the newer storage protocol that delivers highest throughput and lowest latency. The performance of IO increased significantly with the introduction of NVMe Drives that connect directly with the PCIe bus as it allows a parallel queue depth of 64,000 commands, with 65,535 queues per cpu core compared to single queues with just a few hundred commands. It provides enterprise grade features like low latency, high IOPS and encryption compared to legacy Solid-State Drives. This benefits real-time customer applications, real-time data analytics, artificial intelligence (AI) and decision making using Machine Learning (ML), and Deep Learning (DL) inference engines.
End-to-End NVMe
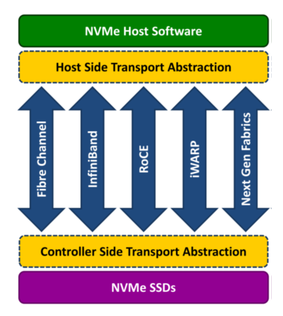
NVMe over Fabric (NVMe-oF) is a networked storage protocol specification which connects hosts and target storage arrays with NVMe drives over Network/Fabric using the Native NVMe protocol. Data transfers can be transferred through methods such as Ethernet, Fibre Channel (FC) or InfiniBand. Today’s data center uses end-to-end NVMe over Fabrics, including the server operating system, server hypervisor, network adapter cards, storage OS and storage drives.
Measure Latency
The Ultra High Performance (UHP) disk process’s commands in microseconds, and existing tools measure latency in milliseconds. This is due to the evolution of storage with Solid State Disks, Non-Volatile Memory Express (NVMe) protocol and hybrid targets of DIMM/Memory with Solid State Disks and/or legacy disks. Latency measurement is also needed to troubleshoot NVMe IO commands taking abnormally longer time to complete due to a variety of problems anywhere on the NVMe Bus / Channel or over-the-fabric.
DTrace on Linux can be effectively used to measure latency. Refer to Getting Started with DTrace to install the required rpm for Oracle Linux on UEK5[1]. It is easier to measure latency with DTrace, as you can access the probe point when the IO request is submitted into the submission queue and the probe point where the request is taken out of the completion queue. For NVMe the probe point nvme_setup_cmd:entry is a good place to start the timer as this function gets called irrespective of NvME-oF protocol. The nvme_setup_cmd() function can get called from from any of nvme_fc_queue_rq(), regular nvme_queue_rq(), nvme_rdma_queue_rq(), nvme_tcp_setup_cmd_pdu() or nvme_loop_queue_rq(). Likewise, the probe point nvme_complete_rq:entry can be used to stop the timer, as this function gets called from the underlying NVMe over-the-fabric protocol or regular NVMe protocol routine in the interrupt context.
DTrace provides aggregate functions to summarize the large collection of data in power-of-two frequency distribution. We can measure the latency using the quantize aggregate function in microseconds. Below is the sample output, the left column of the histogram value output is the latency time in microseconds (us) and the right count are the number of IO commands completed:
Sample Time : 2022 Oct 26 12:03:32
========================================================
       nvme0n1
    value  ------------- Distribution ------------- count
        4 |                                         0
        8 |@@@                                      1868
       16 |@@@@@@@@@@@@@@@@@@@@@@@@@@@@@@@          21266
       32 |@@@@                                     2777
       64 |@                                        829
      128 |@                                        615
      256 |                                         215
      512 |                                         17
     1024 |                                         21
     2048 |                                         12
     4096 |                                         0
(us)
========================================================
Most of the commands on the nvme0n1 device are completing within 9us and 16us, while some are taking in the range of 17us and 32us and some are completing between 5us and 8us.
We can also gather the number of types of NVMe commands completed given a interval of time, like once in 24 hours:
Sample Time : 2022 Oct 26 12:03:32
=======================================================
Device   Command      Status            Count
=======================================================
nvme0n1     FLUSH        Success               143
nvme0n1     WRITE        Success               13548
nvme0n1     READ         Success               13569
=======================================================
Sample Output with fault Injection
$ sudo nvme-io-comp2.d 2 2
Tracing... Hit Ctrl-C to end.

   Sample Time : 2022 Oct 26 12:04:16
   ========================================================
          nvme0n1
       value  ------------- Distribution ------------- count
           4 |                                         0
           8 |@@@                                      1999
          16 |@@@@@@@@@@@@@@@@@@@@@@@@@@@@@@           19991
          32 |@@@@                                     2830
          64 |@                                        701
         128 |@                                        525
         256 |                                         193
         512 |                                         18
        1024 |                                         30
        2048 |                                         9
        4096 |                                         3
        8192 |                                         0
       16384 |                                         0
       32768 |                                         2
       65536 |                                         0
   (us)
   ========================================================

   Sample Time : 2022 Oct 26 12:04:16
   =======================================================
   Device       Command      Status                Count
   =======================================================
   nvme0n1     DSM          Success               0
   nvme0n1     RESV_ACQ     Success               0
   nvme0n1     RESV_REG     Success               0
   nvme0n1     RESV_REL     Success               0
   nvme0n1     RESV_RPT     Success               0
   nvme0n1     VERIFY       Success               0
   nvme0n1     WRITE_UNCOR  Success               0
   nvme0n1     WRITE_ZEROS  Success               0
   nvme0n1     WRITE        Invalid Opcode        1
   nvme0n1     READ         Invalid Opcode        2
   nvme0n1     COMPARE      Success               5
   nvme0n1     FLUSH        Success               105
   nvme0n1     READ         Success               12754
   nvme0n1     WRITE        Success               13077
   =======================================================
DTrace script
The DTrace script below measures latency and IO command completion for a given interval, indicating the number of commands successfully completed or errored along with the error type. The script takes 2 arguments, the first argument is the sampling interval in seconds for latency, the second argument is the interval time in seconds for the summary of command completion counts.
#!/usr/sbin/dtrace -Cqs

/*
 * DTrace script to measure NVMe IO latency in microseconds (us).
 * The script requires 2 arguments:
 * - the reporting period (in secs) for latency
 * - the reporting period (in secs) for command completion
 * The DTrace in UEK5 requires 'fbt' and 'profile' modules to be loaded
 * ('modprobe -a fbt profile').
 */

#pragma D option dynvarsize=100m

/*
 * make this DTrace script forward compatible with UEK6+.
 */

#define DT_VERSION_(M, m, u) \
        ((((M) & 0xFF) << 24) | (((m) & 0xFFF) <<12) | ((u) & 0xFFFF))

#if __SUNW_D_VERSION >= DT_VERSION_(2,0,0)
#pragma D option lockmem=unlimited
#endif

string ncmd[uchar_t];
string stat[ushort_t];

dtrace:::BEGIN
{
  printf("%d is latency interval, %d is cmd comp interval\n", $1, $2);
  ncmd[0x00] = "FLUSH";
  ncmd[0x01] = "WRITE";
  ncmd[0x02] = "READ";
  ncmd[0x04] = "WRITE_UNCOR";
  ncmd[0x05] = "COMPARE";
  ncmd[0x08] = "WRITE_ZEROS";
  ncmd[0x09] = "DSM";
  ncmd[0x0c] = "VERIFY";
  ncmd[0x0d] = "RESV_REG";
  ncmd[0x0e] = "RESV_RPT";
  ncmd[0x11] = "RESV_ACQ";
  ncmd[0x15] = "RESV_REL";

  stat[0x00] = "Success";
  stat[0x01] = "Invalid Opcode";
  stat[0x02] = "Invalid Field";
  stat[0x03] = "DID Conflict";
  stat[0x04] = "Data Xfer Error";
  stat[0x06] = "Internal Error";
  stat[0x07] = "Abort Request";
  stat[0x08] = "Abort Queue";
  stat[0x83] = "Resv Conflict";
  stat[0x280] = "Write Fault";
  stat[0x281] = "Read Error";
  stat[0x287] = "Unwritten Block";

  printf("Tracing... Hit Ctrl-C to end.\n");
  this->sample = 0;
}

::nvme_setup_cmd:entry
{
  this->req = (struct request *) arg1;
  cmnd[this->req] = (struct nvme_command *)arg2;
  (this->req->rq_disk != NULL ) ? nvme_req_starttime[this->req] = timestamp : 0;
}

::nvme_complete_rq:entry
/ this->start = nvme_req_starttime[(struct request *) arg0] /
{
  this->comp_req = (struct request *) arg0;
  this->nvme_cmd = (struct nvme_command *) cmnd[this->comp_req];
  this->comp_diskname = stringof(this->comp_req->rq_disk->disk_name);
  this->opcode = this->nvme_cmd->rw.opcode & 0xff;
  this->nvme_req = (struct nvme_request *) (this->comp_req + 1);
  this->nvme_req_stat = this->nvme_req->status & 0x7ff;
  @opcount[this->comp_diskname, ncmd[this->opcode],
           stat[this->nvme_req_stat]]  = count();
  @lat_time[this->comp_diskname] = quantize((timestamp - this->start) / 1000);
  cmnd[this->comp_req] = NULL;
  this->sample = 1;
}

tick-$1s, END
/ this->sample /
{
  printf("\n\tSample Time : %-25Y\n", walltimestamp);
  printf("\t========================================================\n");
  printa("\t\t%s %@5u\t(us)\n", @lat_time);
  printf("\t========================================================\n");
  clear(@lat_time);
  this->sample = 0;
}

tick-$2s, END
/ this->sample /
{
  printf("\n\tSample Time : %-25Y\n", walltimestamp);
  printf("\t=======================================================\n");
  printf("\tDevice\t  Command\t  Status\t\tCount\n");
  printf("\t=======================================================\n");
  printa("\t%s     %-12s %-20s   %@d\n", @opcount);
  printf("\t=======================================================\n");
  clear(@opcount);
  this->sample = 0;
}
Summary
Latency measurement with error types helps troubleshoot difficult performance issues. The above DTrace script can be modified to include more error codes that would show what type of errors are encountered in by NVMe transactions.
Notes
- DTrace in UEK6 and later versions is a userspace module that uses the eBPF kernel module. DTrace on UEK6+ works with limited functionality, however future version of DTrace on UEK6+ will be forward compatible and the DTrace script included here works in the UEK6 kernel.