The previous articles in this series covered the debugging techniques SLUB debugger and KASan. Due to involved overheads both SLUB debugger and KASan are not ideal choices for a production system. In this final article of this series we will now focus our attention on KFENCE.
KFENCE
Kernel Electric-Fence (KFENCE) is a sampling based memory safety error detector. It can detect OOB access, UAF and invalid-free errors involving SLUB objects. KFENCE has very little overhead and hence can be used in production systems but as it is a sampling based system it can take some time to detect errors. The only small overhead in KFENCE is memory overhead due to guard pages and this depends on the size of the KFENCE pool i.e. how many objects we want in the KFENCE pool.
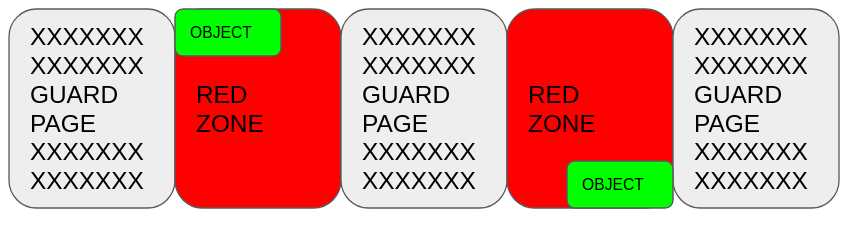
KFENCE allocates objects from a pre-allocated pool of objects and after getting freed these objects reside in a separate list, rather than the freelist of that cache.
Each of the KFENCE objects exist at the beginning or the end of a page and are surrounded by guard pages on both sides. Also the remaining area of the page, that contains the KFENCE object, is treated as RED-ZONE.
Error detection
KFENCE uses 2 mechanisms to detect errors. It either catches errors due to access in the guard pages or it catches errors by checking some canary values to see if they have changed or not.
Lets see how KFENCE detects and reports different types of errors involving slub objects. It should be noted that the examples below some kernels were not booted with no_hash_pointers so in place of real addresses their hashes are printed in reports collected from those kernels. For kernels that were booted with no_hash_pointers the actual addresses can be seen in the KFENCE reports. In either case the reports are good enough to indicate the source of the error.
A KFENCE error report has the following format:
==================================================================
BUG: KFENCE: <type of error> <point of error detection>
<call stack leading to point of error detection>
kfence-#<kfence object number>: <brief description of kfence object>
<object allocation stack if available>
<object freeing stack if available>
OOB access
KFENCE reports OOB access in two ways depending on the location of the access and location of the object itself. If the OOB access happens in one of the adjacent guard pages the error is reported right at the time of access but if OOB access happens in the adjacent RED-ZONE then the error is not reported at the time of access and will get reported if and when the object gets freed.
As mentioned earlier a KFENCE object resides at the beginning or end of a page and is surrounded on both sides by guard pages. These guard pages have their page table entries marked as invalid and hence any access into these pages results in a page fault.
Now suppose we have a KFENCE object at the end of a page. An OOB access for this object would land in the succeeding guard page and cause a page fault. KFENCE uses this page fault to report errors.
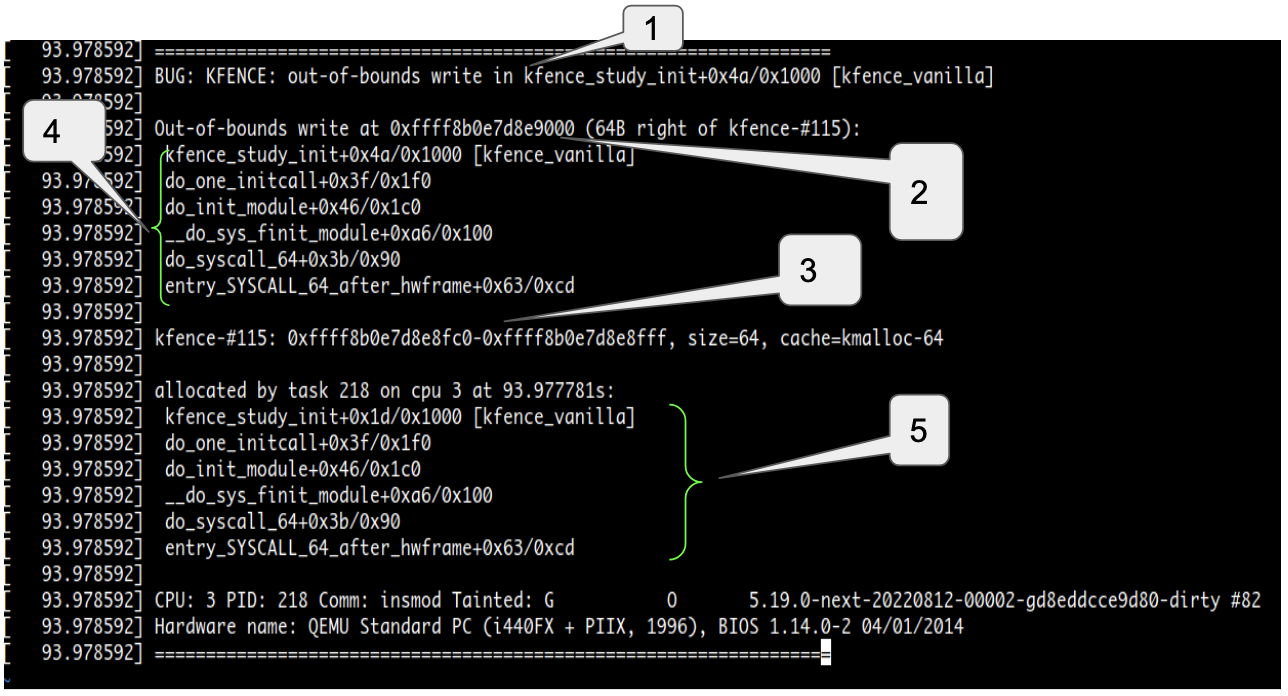
For example lets consider the following report:
-
Type of error and location of error detection
-
Extent and address of OOB access
-
Description of involved object
-
Call stack leading to erroneous access
-
Allocation call stack
In the above example the kmalloc-64 object was residing at the end of a page. A 1 byte access at offset 64 from its start (i.e. 1 byte beyond the size of the object) landed into the guard page and caused a page fault. Now one may ask what happens if we access the RED-ZONE preceding this object or if the object resides at the beginning of a page and OOB access lands into the adjacent RED-ZONE. An access into the adjacent RED-ZONE will not cause a page fault since RED-ZONE exists on the same page as the object. For such cases KFENCE checks the RED-ZONE at the time of freeing of the object and if the expected pattern is not seen in the RED-ZONE it reports an error.
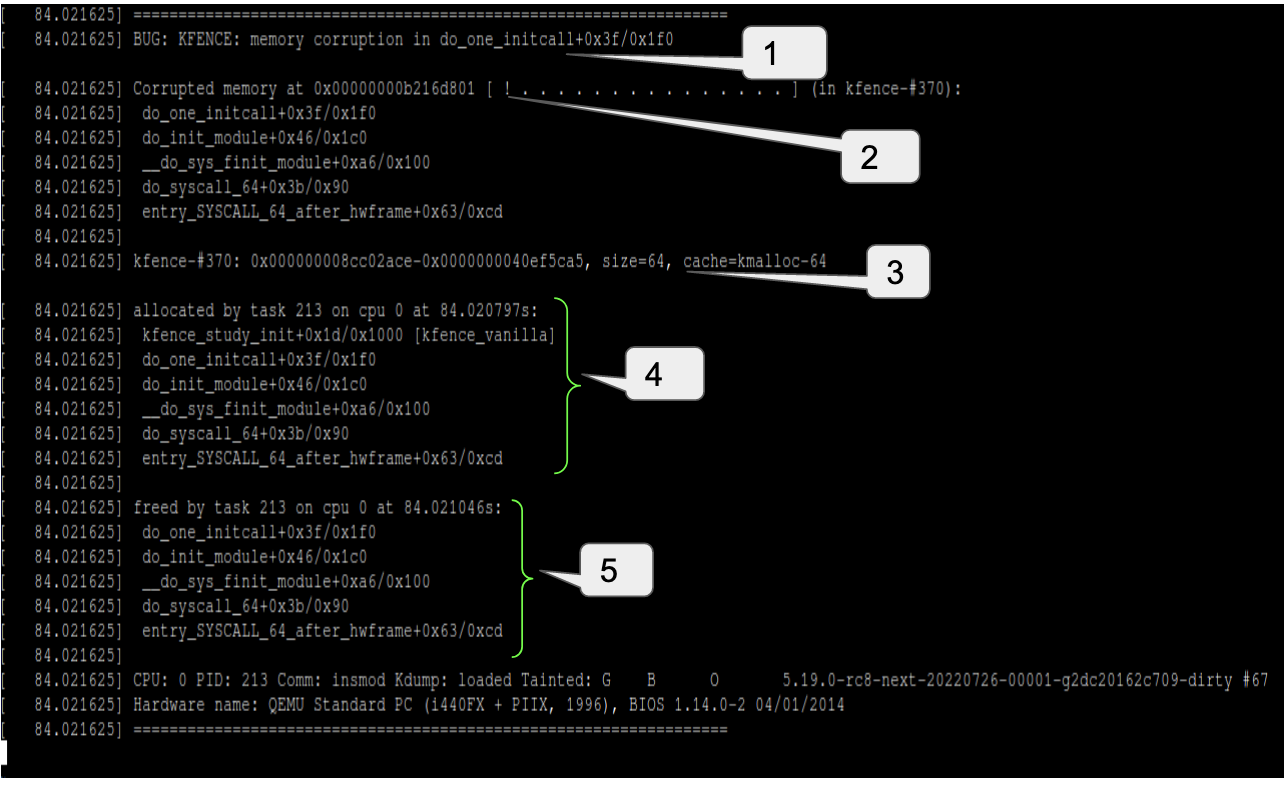
Here’s another example of a OOB access error reported by KFENCE:
-
OOB access (memory corruption) detection point
-
Extent of OOB access (1 ! indicates 1 byte OOB access)
-
OOB access for a kmalloc-64 object
-
Allocation call stack
-
Freeing call stack
In the above snippet a kmalloc-64 (i.e. 64 byte) object was allocated at the beginning of the page. We wrote 1 byte beyond this object but the error was not reported at the time of writing. The error was reported at the time of freeing the object (that’s why we can see the call stack corresponding to the freeing of the object).
Further if we compare it with the earlier OOB report we can see that this has been reported as a “Corrupted memory” error. This is because KFENCE did not catch this error at the time of access (write) but detected it later at the time of freeing. The one ! at the beginning of [ ! . . . . . . . . . . . . . . . ] indicates that one byte was corrupted and the succeeding dots indicate that bytes after this corrupt 1 byte are all good. If the kernel was booted with no_hash_pointers we would have seen the actual value written at the corrupt byte.
UAF access
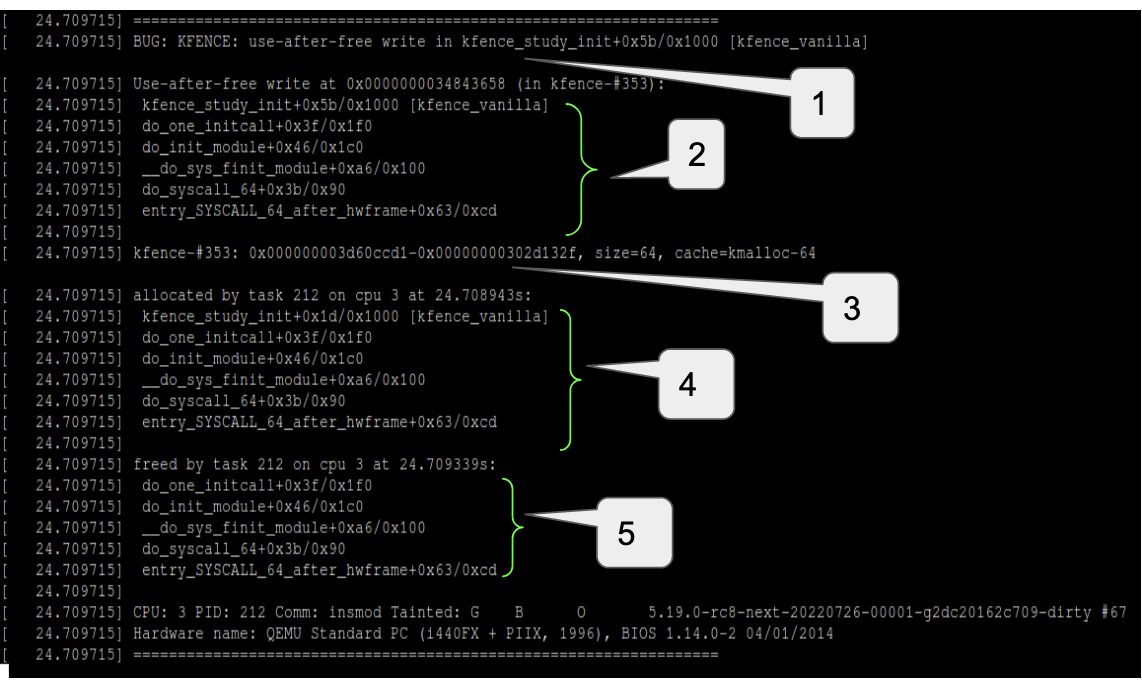
KFENCE uses a page fault mechanism to detect a use-after-free (UAF) error. When a KFENCE object gets freed, the page table entry for the containing page is marked as invalid. So a subsequent access to the freed object causes a page fault which is then used by KFENCE to report errors. One example of a UAF report has been given below:
-
Type of error and location of detection
-
Call stack leading to UAF detection
-
Description of impacted object
-
Allocation call stack
-
Freeing call stack
Double free and Invalid free
KFENCE reports both double-free and invalid free (pointer being freed, not pointing to a KFENCE object) as invalid free errors. For each KFENCE object, a kfence_metadata object exists and it contains several pieces of information about the corresponding KFENCE object. Two such pieces of information being the allocation state of the KFENCE object and its starting address. At the time of freeing a KFENCE object if it’s found that object is not in a KFENCE_OBJECT_ALLOCATED state or if the address being freed here is not the starting address of a KFENCE object, an invalid free error is flagged.
For example the following snippet shows that we are freeing an already freed object. We know the object has been freed because the KFENCE report contains the freeing stack trace and also the hash at the start of the KFENCE object (kfence-#367) matches with the hash of the address for which the error was reported (see the line beginning with “Invalid free of”).
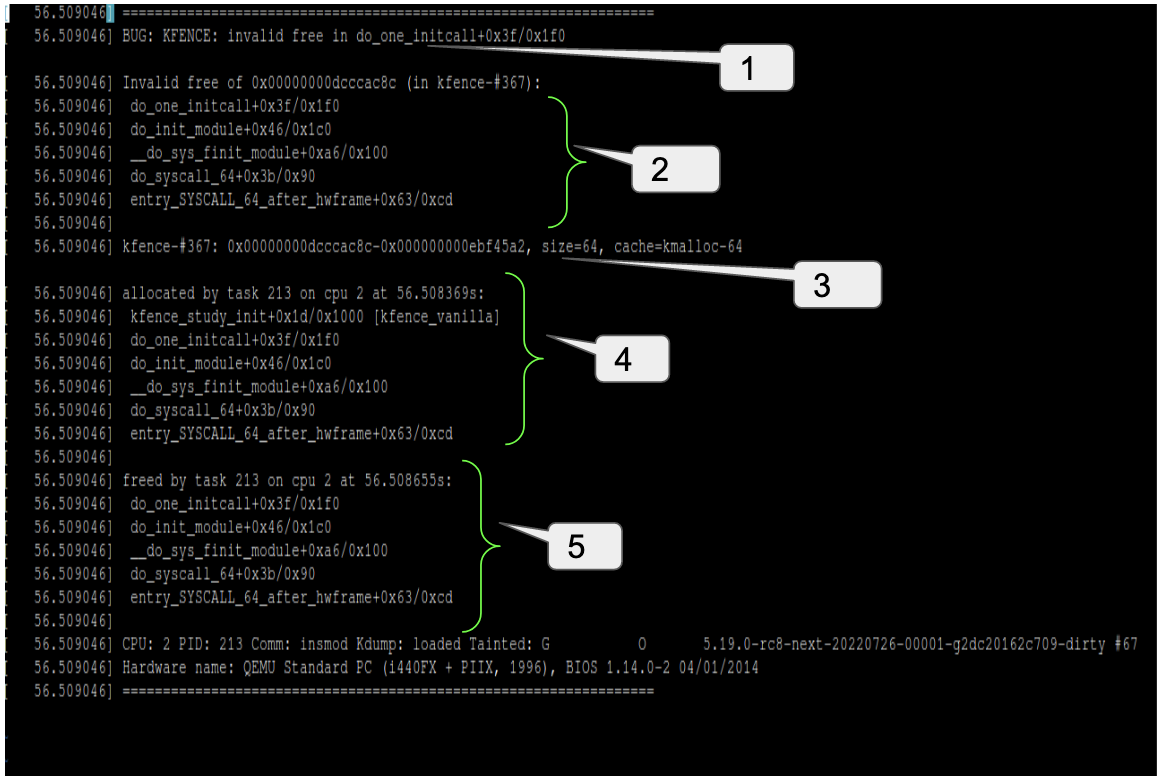
-
Type of error and location of detection
-
Call stack leading to invalid free
-
Description of object for which error was detected
-
Call stack for last allocation of this object
-
Call stack for last freeing of this object
How to enable
To enable KFENCE, configure the kernel with:
CONFIG_KFENCE=y
If we just want to build the kernel with KFENCE support but keep KFENCE disabled by default we should configure the kernel with:
CONFIG_KFENCE_SAMPLE_INTERVAL=0
This is 100 by default which is the duration of the KFENCE sampling window. The KFENCE sampling window determines the frequency of heap allocations from the KFENCE pool. A sampling window of 100ms means that in a time window of 100ms only one allocation will happen from the KFENCE pool
If the kernel was configured with CONFIG_KFENCE_SAMPLE_INTERVAL=0 and we want to enable KFENCE some time later, or if we want to change the sampling interval we can do so by writing a non-zero sampling interval into the module parameter named sample_interval:
For example to set a 200ms samplling interval perform the following:
echo 200 > /sys/module/kfence/parameters/sample\_interval
Similarly if the kernel was configured with a non-zero value for CONFIG_KFENCE_SAMPLE_INTERVAL (i.e. KFENCE was enabled at boot) but we want to disable it later, we can do so by writing 0 into sample_interval:
echo 0 > /sys/module/kfence/parameters/sample_interval
Pros and cons
Because of its very low overhead KFENCE can be used in production systems. KFENCE is sampling based so it may not detect all memory errors. The idea here is that with enough uptime it should be able to catch one or more wrong memory accesses. It works only for objects of size PAGE_SIZE or less.
Conclusion
Over recent articles we have covered three mechanisms that can be used to debug memory error issues involving slub objects. If we compare these mechanisms we can see that KASan is the most capable mechanism to debug such issues but it has a lot of overhead involved because of extra checks corresponding to memory read/writes. This high overhead makes KASan pretty much unusable in a real production environment but it is the perfect candidate if one wants to catch bugs early by running different workloads over multiple machines in a test farm. slub_debug is not as instant or sureshot as KASan but its overhead is significantly low and the probability of a bug being caught by slub_debug is more than it being caught by KFENCE. KFENCE is the only one amongst these three that can be used on a production system without worries but its a sampling based method so the chance of it catching bugs is significantly lower than KASan or slub_debug.
Usage and limitations of each of these three debugging mechanisms can be summarized in the following table: