The previous article focused on how to use SLUB debugger for analysing memory issues with SLUB objects. We saw that the main limitation with SLUB debugger is that it does not report errors right at the time of occurence and depends on the occurence of other events to eventually report the detected errors. This article will focus on using KASan to debug memory issues involving SLUB objects. KASan provides a synchronous way of detecting and reporting memory errors.
KASan
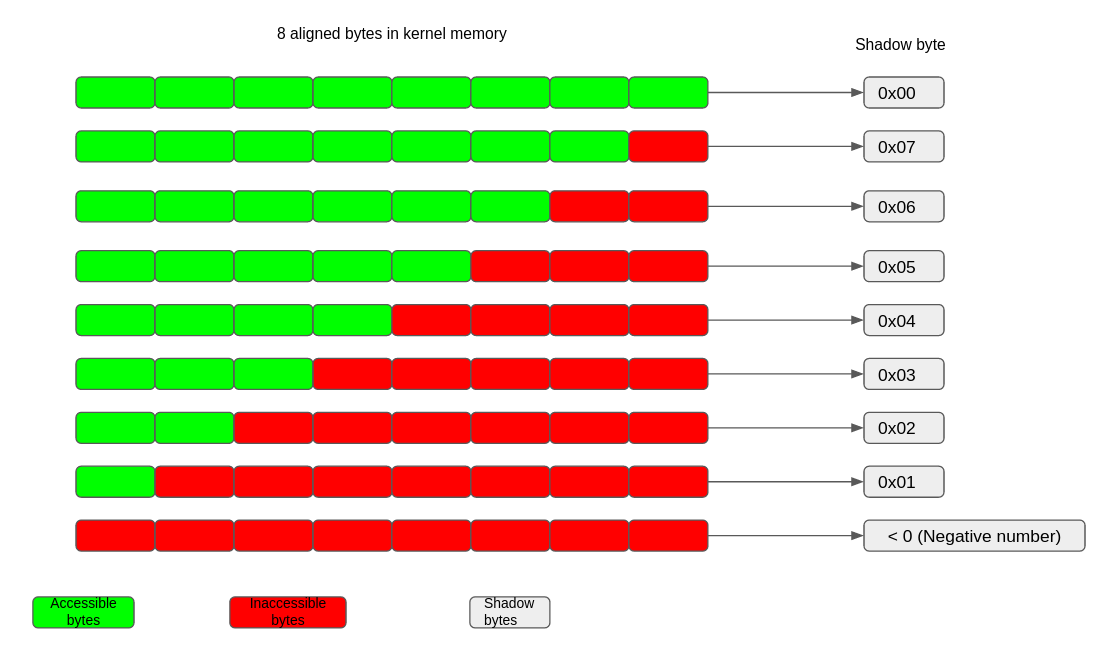
KASan (Kernel Address Sanitizer) (https://www.kernel.org/doc/html/v5.19-rc4/dev-tools/kasan.html) is a dynamic memory error detector. It can be used for detecting use-after-free, out-of-bound access and/or double-free bugs for SLUB objects. KASan has 3 implementation flavors: Generic, S/W tag based and H/W tag based. For the purpose of this article we will only cover the generic KASan flavor and from this point onwards any reference to KASan would indicate generic KASan. KASan uses shadow memory to maintain metadata which indicates whether a memory access is safe or not. It uses compiler instrumentation to check this metadata before corresponding memory access. 1 byte of shadow memory tracks 8 aligned bytes of kernel address space. A value of 0 in this shadow byte indicates that all 8 bytes of the corresponding memory chunk are accessible while a value of N (1 <= N <= 7) indicates that only first N bytes are accessible and the remaining 8 – N bytes are not accessible. A negative value in the shadow byte indicates invalid access. Different negative values indicate different types of inaccessible memory like freed memory or redzones etc.
Error detection
Error detection by KASan mainly consists of 2 parts
- Maintaining the state of an 8 byte chunk in a shadow byte
- Use compiler instrumentation to instrument each 1, 2, 4, 8 or 16 byte memory access with the KASan callbacks and report errors as per the result of these callbacks
For example the snippet below shows KASan callbacks just before an 8 byte memory access:
ffffffff810015ae:       49 83 c6 18             add    $0x18,%r14

ffffffff810015b2:       e8 99 b5 2f 00          callq  ffffffff812fcb50 <__asan_load8>  <—- KASan callback

ffffffff810015b7:       49 8b 7e f0             mov    -0x10(%r14),%rdi   <—- 8 byte read

ffffffff810015bb:       44 89 ea                mov    %r13d,%edx
As another example the snippet below shows KASan callbacks just before a 4 byte memory access:
ffffffff81009656:       48 89 df                mov    %rbx,%rdi

ffffffff81009659:       e8 b2 33 2f 00          callq  ffffffff812fca10 <__asan_load4>  <—- KASan callback

ffffffff8100965e:       44 39 33                cmp    %r14d,(%rbx)  <—- 4 byte read

ffffffff81009661:       0f 84 a7 00 00 00       je     ffffffff8100970e <amd_pmu_cpu_starting+0x13e>
The compiler instrumentation can be either outline (KASan checks are done in a callback) like the examples above or it can be inline (all KASan checks done inline before actual memory access). The core functionality of KASan does not depend on the type of instrumentation. Inline instrumentation gives a bigger image but is faster, because of no overhead of calling the KASan callbacks, while outline instrumentation gives a smaller image but is slower. KASan hooks with the SLUB allocator to maintain the shadow bytes corresponding to a SLUB object. KASan also leverages some parts of the slub_debug framework (described earlier).
With KASan a SLUB object looks like below:
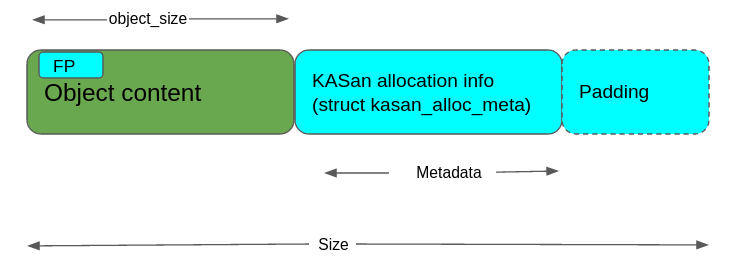
Like slub_debug, KASan makes use of the idea of REDZONE, but in a different way. With KASan an optimum REDZONE size is calculated based on the object_size. KASan uses the REDZONE area to store allocation metadata (i.e. information about the context that allocated and freed the object) so KASan makes sure that REDZONE is big enough to hold this metadata.
Important point to note here is that with slub_debug the content of the REDZONE is checked to validate the memory access but with KASan only shadow bytes corresponding to the REDZONE is checked to validate the memory access and thus it leaves the REDZONE area to be used for other purposes.
Just after the creation of an object, corresponding shadow bytes are poisoned and they get unpoisoned after the allocation of that object. Freeing the object, poisons the corresponding shadow bytes again and this allows the catching of UAF errors. The shadow bytes corresponding to the pseudo REDZONE, around slab object, remain poisoned throughout and this allows the catching of OOB access.
Having seen different parts of the KASan implementation, let’s look at some examples to see how KASan’s error detection mechanism works for the SLUB objects.
A sample KASan report has the following format:
==================================================================
BUG: KASan: <type of error> <point of error detection>
<short description of error>
<call stack leading to point of error detection>

<Allocation call stack if available>

<freeing call stack if available>

<description of buggy address>

Memory state around the buggy address:
<state of shadow bytes>
==================================================================
OOB access
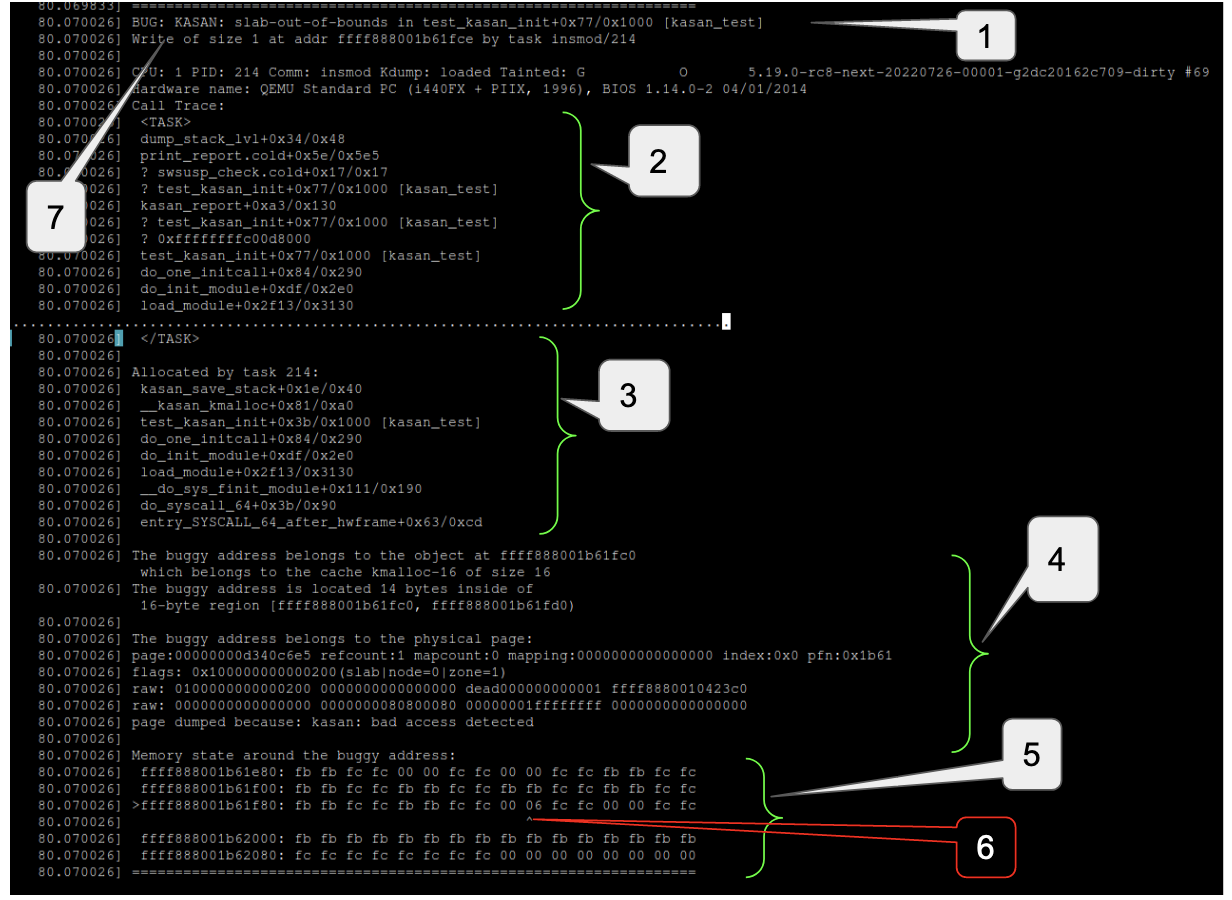
In case of OOB access, the KASan callback ends up reading the shadow bytes corresponding to the REDZONE and from the corresponding value, KASan is able to detect OOB access errors. For example the following snippet shows an OOB access error:
-
Type of error and location of its detection
-
Call stack leading to erroneous access
-
Allocation call stack
-
Description of address at which erroneous access happened
-
State of shadow bytes for and around the address of erroneous access
-
Shadow byte corresponding to the address of invalid access. 06 indicates that only the first 6 bytes from this 8 byte chunk are accessible
-
Type, extent and address of erroneous access
As we can see in the above report, KASan reported an OOB access error because we are writing 1 byte beyond the size of the object. The report also mentions the problematic address. Looking at the state of the shadow bytes we can deduce some more information but for that we first need to learn how to interpret the part of the KASan report that describes the state of the shadow bytes i.e. the part of the KASan report that begins with “Memory state around buggy address”. Each line in this section of the report describes the state of the shadow bytes corresponding to the 128 bytes starting from the address given in the first column and from the second column onwards each column indicates the value of a shadow byte corresponding to an 8 byte chunk.
For example in the above snippet the first row of this section indicates the value of the shadow bytes for address 0xffff888001b61e80 to 0xffff888001b61eff, the second row indicates the value of the shadow bytes for address 0xffff888001b61f00 to 0xffff888001b61f7f, the 3rd row indicates the value of the shadow bytes for address 0xffff888001b61f80 to 0xffff888001b61fff and so on and so forth. Further from the first row we see that the shadow byte for 8 byte chunk 0xffff888001b61e80 to 0xffff888001b61e87 contains a negative value (0xfb) so none of these 8 bytes are accessible. Same goes for the next 8 byte chunk from 0xffff888001b61e88 to 0xffff888001b61e8f. Going further in the same row we can see that the shadow bytes for 2 consecutive 8 byte chunks, 0xffff888001b61ea0 – 0xffff888001b61ea7 and 0xffff888001b61ea8 – 0xffff888001b61eaf are each 0 i.e. all 8 bytes in these 2 chunks or these 16 consecutive bytes are accessible.
Further the 128 byte chunk in which erroneous access happened is marked by ‘>’ and the shadow byte is marked by ‘^’. In the above snippet we can see that the problematic access happened somewhere in the 128 bytes starting from 0xffff888001b61f80. Further in the same row the shadow byte corresponding to the chunk 0xffff888001b61fc8-0xffff888001b61fcf is marked with ‘^’ and has the value 06 which means only 6 bytes of this chunk were accessible (this is expected because we are dealing with a 14 byte object here, 8 bytes from previous chunk and 6 bytes from this chunk make those 14 bytes). So we can see that an OOB access error was reported because there were only 14 bytes available but code was trying to write to the 15th byte.
Even if we ignore (or can’t deduce) the state of shadow bytes, the KASan report contains enough information about the error source but having a clear understanding of shadow byte states helps in getting a much clearer picture.
UAF access
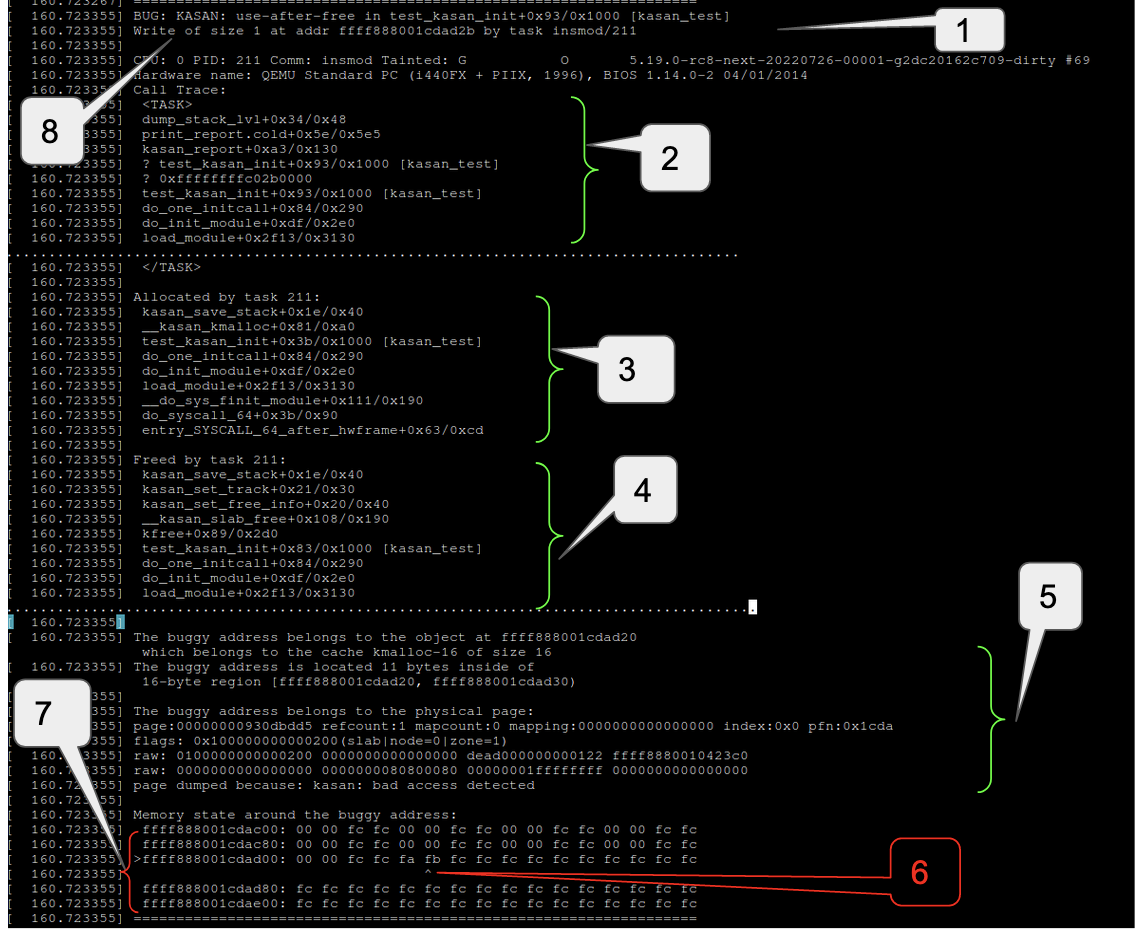
As mentioned earlier once an object gets freed, the shadow bytes corresponding to it are filled with the poison pattern 0xFB (KASAN_SLAB_FREE). If the freed object is accessed, KASan callback detects that the shadow bytes of this object contains the poison pattern corresponding to a freed object and KASan signals a UAF error.
Following snippet is an example of a UAF error report:
-
Type of error and location of detection
-
Call stack leading to erroneous access
-
Allocation call stack
-
Freeing call stack
-
Description of buggy address
-
Shadow byte for buggy address contains 0xfb (KASAN_SLAB_FREE) indicating that object is free
-
Shadow bytes around buggy address
-
Type address and extent of erroneous access
Double free and Invalid free
Double free detection works pretty similar to the UAF detection but in this case the error is not detected by the compiler instrumented callbacks. As mentioned earlier KASan hooks itself with the slub allocator APIs. One of these hooks (____kasan_slab_free) is invoked in kfree and it detects whether the shadow bytes corresponding to the object already have a poison pattern corresponding to a freed object. After this KASan signals a double free error.
If the pointer passed to kfree or kmem_cache_free is not a pointer to a slub object, KASan flags such freeing as an invalid free. In this case as well KASan relies on ____kasan_slab_free to check whether the pointer points to a valid slub object or not and signals an error accordingly.
Since the report of double or invalid free looks pretty similar to the UAF case, I have not attached any examples here. Of course in these cases the start of the report will state that it is a “double-free” or “invalid-free” error.
How to enable KASan
To enable KASan configure the kernel with:
CONFIG_KASAN = y
And choose between CONFIG_KASAN_OUTLINE (outline instrumentation and default) and CONFIG_KASAN_INLINE (inline instrumentation).
KASan compiler instrumentation can be disabled for specific files or directories as well.
To disable it for a file (foo.c) add a line similar to the following in the corresponding kernel Makefile:
KASAN_SANITIZE_foo.o := n
For all files in a directory add the line :
KASAN_SANITIZE := n
Pros and Cons
Out of all the debugging methods, used to detect memory errors involving slab objects, KASan provides the best coverage simply because it instruments each relevant memory access. As we saw in the above reports KASan detects and reports errors right at the time of occurence and also it provides the full call stack right upto the point of erroneous access. This aspect of KASan is much more useful, compared to slub_debug, when it comes to catching the culprit context that is causing memory corruption. The major drawback of KASan is its performance overhead. There are some other limitations as well such as KASan can not detect UAF after reallocation, it cannot detect uninitialized memory access and it should also be noted that with KASan the freed objects are put into a quarantine list and they move to freelist from there after some time or under certain conditions. This in turn means that KASan delays or sometimes suppresses occurrence of use-after-free errors.
Summary
This concludes how to use KASan to assist analysing debugging memory issues with slub objects. The next and final article in this series will focus on using KFENCE.
References
KASan – https://www.kernel.org/doc/html/v5.19-rc4/dev-tools/kasan.html