SLUB allocator debugging
The previous article covered the internals of the SLUB allocator. It described the organization, allocation and freeing of objects from a slab-cache (managed by the SLUB allocator). It also touched upon the fact that different types of memory corruption involving SLUB objects can lead to undesired system behaviour. The SLUB allocator on its own is not able to detect these errors but we can use different debugging mechanisms to debug memory corruption issues involving SLUB objects. These debugging mechanisms are the focus of these next articles.
At the time of writing there are 3 ways to debug memory errors involving SLUB objects:
- slub_debug (or CONFIG_SLUB_DEBUG_ON)
- KASan (Kernel Address Sanitizer)
- KFENCE (Kernel Electric-Fence)
In this article we will focus on the first technique SLUB debugger.
SLUB debugger (slub_debug)
SLUB debugging relies on the technique of memory poisoning to detect different types of memory bugs. There are multiple options that can be enabled when using SLUB debugger, all of which are optional. Also, if needed, SLUB debugger can be enabled only for specific SLUB caches.
The main debugging options available with slub_debug are as follows:
-
Z : Provide RED (guard) zones around SLUB objects
-
P : Poisoning (object and padding)
-
F : Perform sanity checks on SLUB objects
-
U : User tracking (free and alloc)
-
– : Switch all debugging options off
Besides the above options, there are also options for tracing (T) and for turning off (O) debugging for caches that would cause higher minimum slab order.
slub_debug options
Let’s see how each of these debugging options can help.
Z (Provide RED zone around SLUB objects)
slub_debug=Z enables SLAB_RED_ZONE in the kmem_cache->flags and this results in the creation of adjacent RED zones on both sides of the object. These RED zones are filled with markers to indicate the allocation state of an object. The RED zones of the allocated objects are filled with the value 0xcc (i.e SLUB_RED_ACTIVE) and the RED zones of the free objects are filled with the value 0xbb (i.e SLUB_RED_INACTIVE). An out of bound access can change these marker values. The next memory operation on this SLUB object checks and finds that RED zone markers have changed and this in turn means that an out of bound (OOB) access has happened.
P (Poison object and padding)
slub_debug=P enables SLAB_POISON in the kmem_cache->flags and this causes the object payload and padding areas to be filled with a poison pattern. Just after the allocation, the object’s payload area is filled with POISON_INUSE (0x5a) and just after being freed all of the object’s payload area (except the last byte) is filled with POISON_FREE (0x6b) and the last one byte is filled with POISON_END (0xa5). The poison values are selected such that they don’t represent a valid pointer. The presence of 0x5a, in the object payload area, indicates an error involving access of an uninitialized SLUB object. Similarly the presence of 0x6b indicates use-after-free (UAF) error.
F (Sanity check)
slub_debug=F enables SLAB_CONSISTENCY_CHECKS in kmem_cache->flags. This enables consistency checks for the SLUB objects. Some of these consistency checks are basic and are always performed (i.e even when other slub_debug options are not enabled). The basic consistency checks involve checks such as checking that the freelist is not corrupt, checking the number of inuse slab objects is not more than the allowed limit and checks involving the state of this object’s slab. These checks are not enough to ensure that there is nothing wrong but these are minimal checks and do not need any additional memory in slub objects. The other consistency checks depend on the presence/absence of debug options. For example for slub_dbug=Z, RED zones of both allocated and freed objects are checked to see if they have expected values (SLUB_RED_ACTIVE or SLUB_RED_INACTIVE). Similarly for slub_debug=P, the payload area of the free objects are checked to see if they contain expected values (POISON_FREE and POISON_END). If we have enabled the other slub_debug options but have not enabled the consistency checks then SLUB debugger will not be able to signal an error at runtime. For such cases we can still use other mechanisms like vmcore and check the objects to see if they are showing any error pattern.
U (User tracker)
slub_debug=U does not detect bugs on its own but it provides additional information for bugs detected by the other options. If this option is enabled, the SLUB allocator tracks the last allocator and/or freer of a SLUB object by storing the corresponding information (allocation/freeing call stack) in the metadata area. In older kernels (prior to 5.19), stack frames were stored as an array in metadata. This way of storing stack frames was not efficient (due to the same stack trace getting stored in multiple arrays). From v5.19 onwards stackdepot is being used for this purpose.
If user tracking is enabled, SLUB debugger includes stack traces, corresponding to the last allocation and freeing of an object in the bug reports.
Errror detection
So far we have seen some of the different options available with slub_debug and how they can be used to detect errors and provide relevant information. A slub_debug error report has the following format:
===============================================
BUG <slab cache affected>: <What went wrong>
-----------------------------------------------

<start address of corruption>-<end address of corruption> <more info>
Allocated in <kernel function> age=<jiffies since alloc> cpu=<allocated by
   cpu> pid=<pid of the process>
Freed in <kernel function> age=<jiffies since free> cpu=<freed by cpu>
   pid=<pid of the process>
Slab <address> <slab information>
Object <address> <object information>
Redzone <address and content of Redzone if it's present (can span multiple lines, depending on size of left Redzone>
Object <address and payload of affected object (can span multiple lines, depending on object_size)
Redzone <address and content of right Redzone>
Padding <address and content of padding bytes, this too can span multiple lines>
A stackdump leading to the point of error detection
Fix <slab cache affected> : <corrective action taken>
Depending on the slub_debug options, currently in use, some lines from the above snippet may be absent. For example information about Redzone is available only for slub_debug=Z. Similarly information about the last allocator and freer (i.e Allocated in, Freed in) is present only if slub_debug=U has been set. The line starting with “Fix” i.e. the last line indicates what corrective actions were taken by the SLUB allocator to ensure continued operation of the system.
Lets have a look at some example reports, in order to understand this mechanism better. In the following examples I am assuming that slub_debug=FPZU options were enabled.
OOB Access
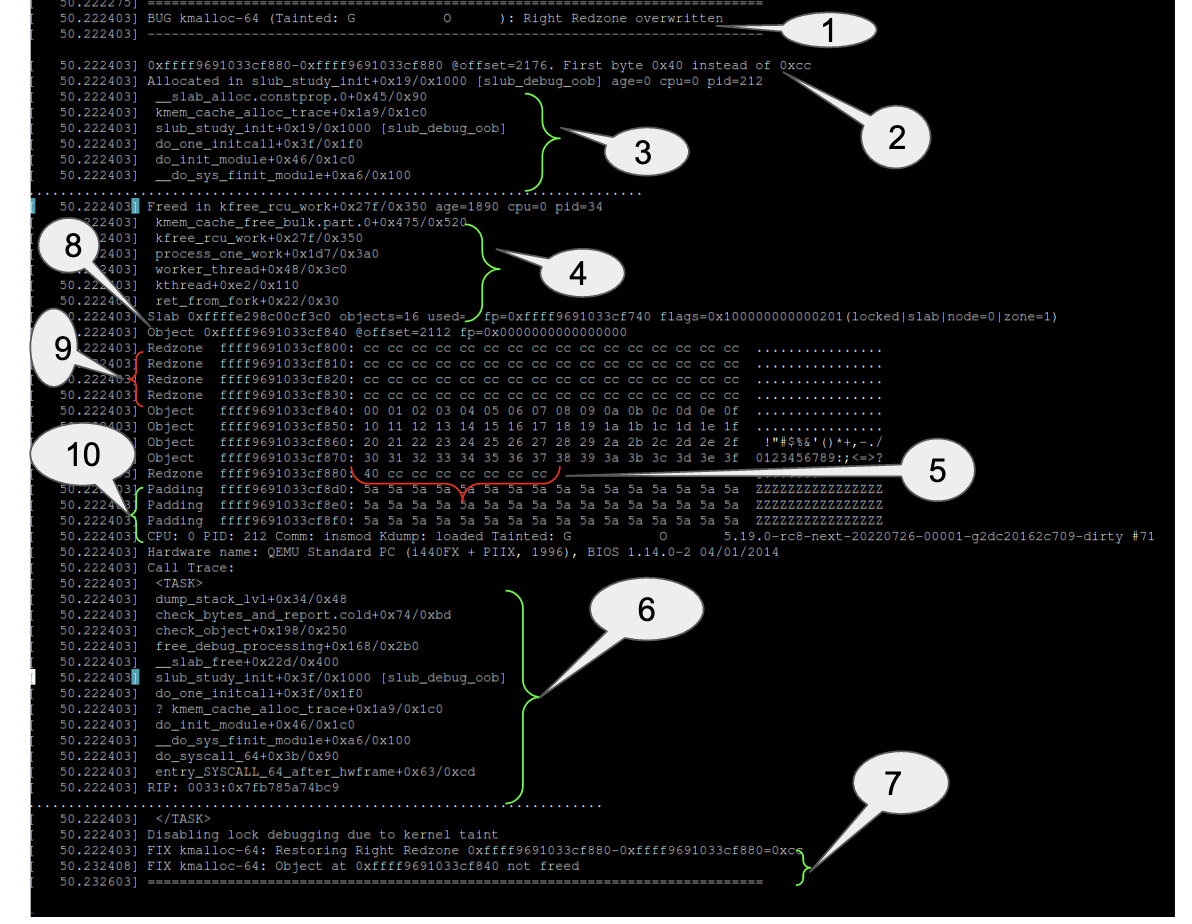
The slub debugger can detect out-of-bound (OOB) access at the time of freeing the object. At the time of freeing the object the RED zone bytes are checked. Ideally these bytes should have SLUB_RED_ACTIVE (0xcc) but if one or more of these bytes have some other value, it indicates an OOB access.
It must be noted that this OOB access is not reported at the time of occurrence but later on at the time of freeing the object. If the object is not freed then the error is not reported.
For example the following snippet shows a 1 byte OOB access for a kmalloc-64 object and this was detected at the time of freeing the object:
-
Redzone after the object was overwritten
-
Slub debugger expected 0xcc (SLUB_RED_ACTIVE) but found 0x40 (overwritten value)
-
Call stack for current allocation
-
Call stack for current free
-
Redzone (first byte) overwritten
-
Slub debugger found OOB error at the time of freeing the object
-
Corrective action taken by slub debugging subsystem
-
Object for which OOB write happened
-
Left Redzone of an active (not yet free) object
-
Padding of an active object
At the end of this report we see that as a corrective action the Redzone was restored and the object was not freed at this point of time.
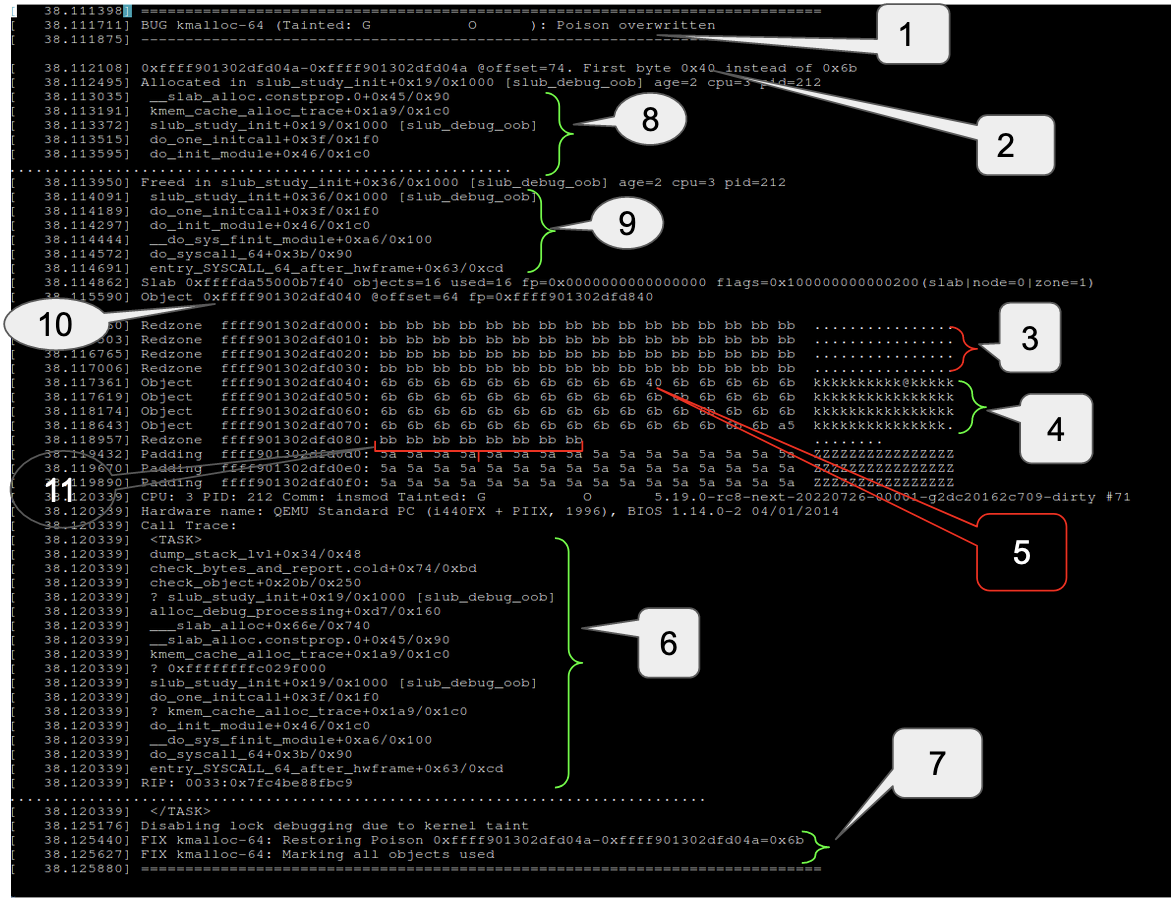
UAF Access
Slub debugger detects a use-after-free (UAF) error at the time of reallocation of the object. Just after being freed the object’s content area (except the last byte) is filled with POISON_FREE (0x6b) and the last byte of the object’s content area is filled with POISON_END (0xa5). If at the time of reallocation of the object, slub debugger sees that one or more bytes in the object’s payload area have some other value, it indicates a UAF error. In this case as well UAF is not detected right at the time of occurrence but later on at the time of reallocation of the object.
The following example shows that a kmalloc-64 object was used after being freed and 0x40 was written into it at offset 10.
-
Poison pattern in the object payload area was overwritten (UAF error)
-
Slub debugger expected 0x6b or POISON_FREE (because the object had been freed) at this address but got 0x40
-
Left redzone. 0xbb (SLUB_RED_INACTIVE) indicates a free object
-
Object payload area. 0x6b (POISON_FREE) indicates a free object
-
Object payload area. 0x6b (POISON_FREE) indicates a free object but at offset 10, 0x6b has been overwritten with 0x40 due to UAF error
-
Slub debugger found UAF at the time of (re)allocating the object
-
To avoid problems in future mark all objects of this slab as used. This will avoid touching any object
-
Allocator call stack
-
Freeing call stack
-
Address of object
-
Right redzone
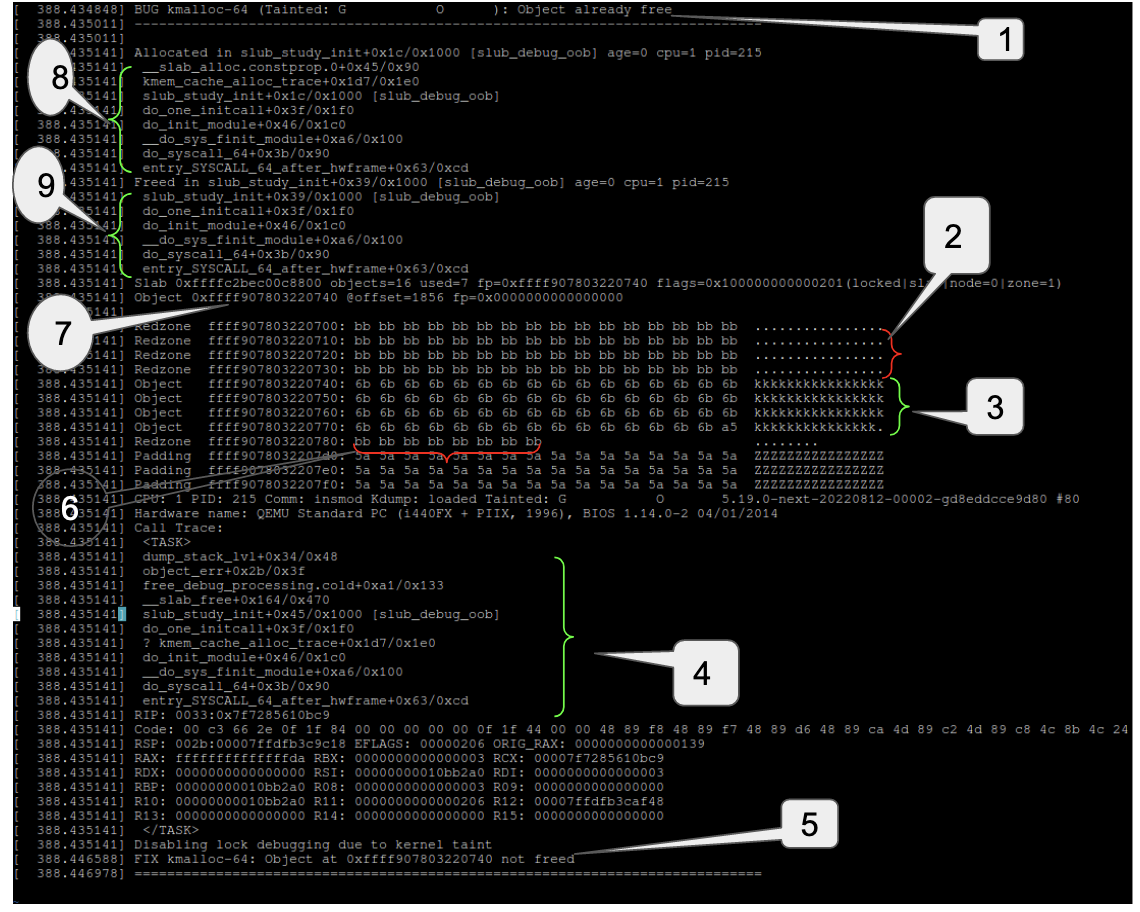
Double free and Invalid free
At the time of freeing the object slub debugger checks if the object is already on the freelist. If the object is already on the freelist, this means it has already been freed and a double free error is signaled as shown in the below snippet:
-
Double free error
-
Left redzone filled with 0xbb(SLUB_RED_INACTIVE) i.e the object is free
-
Payload area filled with 0x6b(POISON_FREE), indicates free object
-
Slub debugger found double free error at the time of freeing the object
-
To recitfy the situation slub debugger decided not to free the object
-
Right redzone
-
Object address
-
Allocator call stack
-
Freeing call stack
In this case the error was reported right at the point of occurrence. Besides double free, slub debugger can also detect invalid frees, where the pointer being freed does not point to a slab object. At the time of freeing the object, the slub allocator checks if the pointer (i.e the object address) resides outside of the slab or if the pointer is not pointing to the beginning of an object. If either of these cases are true slub debugger flags an invalid free error.
How to enable
The SLUB allocator always includes full debugging support but it is off by default. SLUB debugging can be switched on either by building a kernel with the SLUB_DEBUG_ON option set or by adding slub_debug= to the kernel command line. SLUB_DEBUG_ON enables all of the above mentioned debugging options and for all of the slabs. slub_debug= enables specified options for all SLUB caches by default but it can also be used to enable debugging for specified SLUB caches (Please see: https://www.kernel.org/doc/html/v5.19-rc4/vm/slub.html to see how slub_debug can be enabled for specific caches). In kernels older than v5.9 slub debugging could be enabled for selected slab-caches via the sysfs interface but this method was not bug free and hence the sysfs interface has been made readonly in later kernels.
Pros and Cons
slub_debug has moderate overhead and this comes due to 2 reasons: 1. The slub debugger needs to do some preprocessing during both allocation and freeing of the objects and this means fastpaths for allocation and freeing (described in previous article) can’t be used. The amount of preprocessing depends on what slub_debug options enabled. 2. Also depending on the slub_debug options, the slub allocator needs to provide additional area, in each object, to accomodate related metadata. This increases memory consumption of slub objects.
Despite these aspects, SLUB debugging has significantly less overhead when compared to KASan (described in a subsequent article) and can be used for selected caches if needed. This makes it usable in some production environments as well.
Despite its uses SLUB debugging has some limitations. These limitations should be clear if we look at the above description of how SLUB debugging mechanism works. I have summarized these limitations below:
- Error reporting is not synchronous. As can be seen for Z and/or P options, a bug can change the markers but the bug is not reported at that point of time. The bug is reported when the SLUB allocator checks these regions during the next allocation or freeing of these objects. If the SLUB allocator does not allocate this object again or if the object is not freed we will not know about these errors.
- If an OOB access ends up writing the same values as the markers, these OOB writes will not be detected. Similarly if an object holds the same value as the POISON values (0x5a or 0x6b) we can’t detect use-after-free or uninitialized access errors.
- As made obvious from the above points, most of the bad reads go undetected by SLUB debugger.
Summary
This article covered the first of three debugging mechanism available to assist discovering memory errors related to slub objects. Subsequent articles will focus on the other two mechanisms namely KASan and KFENCE.