Introduction
Real-time data is the heartbeat of informed decision-making, and acting on real-time data is like driving with high beams on, it illuminates the path ahead. In this article we will work with streaming ATM data and predict whether a particular component of the ATM will go out of order or not. This will help banks to take pro-active maintenance of the ATMs thereby keeping the customers’ trust intact and also gaining new customers since the ATMs are in good condition and also have cash available all the time.
ATM Sensors
To work with a stream of data from ATMs we need to install sensors for different components of the ATM. The components we want to keep a check on are – the card reader, the cash dispenser, keyboard sensor, display sensor, temperature and humidity. Sensors will be installed for each of the mentioned components. The data feed from the components will be fed into Oracle Stream Analytics, in this case it is in the form of a CSV file. Let us understand how it works.
Oracle GoldenGate Stream Analytics
Oracle GoldenGate Stream Analytics (OSA) is available in the OCI Marketplace on OCI. Just a little background on OSA: It is an intuitive, web-based interface, powered by the Continuous Query Language (CQL) engine on Spark Streaming and Apache Kafka Messaging runtime, and the interface enables you to explore, analyze, and manipulate streaming data sources in real-time. To get started we will need a stream of data and the reference data for ATM machines. The assumption is that the reference data(ATM machine details) is stored in a database, in our case it is MySQL database. We will start by creating a connection with the database after signing into OSA.
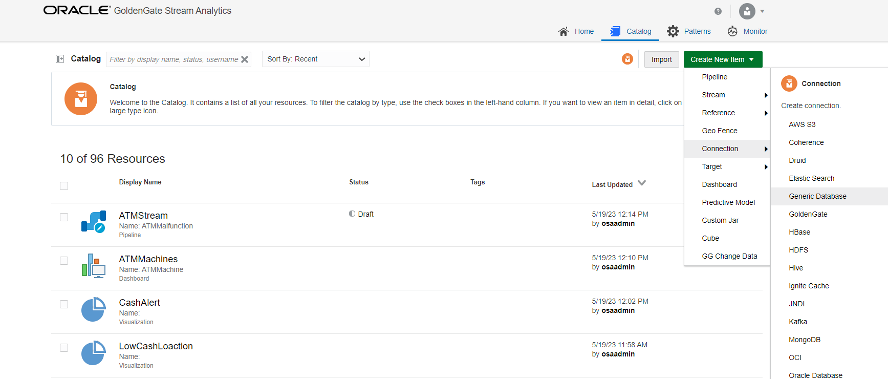
- Click on the Catalog
- Click on the Create new Item drop down
- Select Generic Database from Connections menu
In the connection popup enter the name of the connection and select the connection type. In the connection details, select the database, in this case MySQL and set the JDBC URL. Test the connection.
Once we have created the connection to the database, we create a reference to the database table.
- Click on the Create new Item drop down
- Select Database Table from Reference
- Fill in the four sections in the Create Reference form.
In the Source Detail select the connection created above and in the Shape select the table to be referenced. The table attributes and the data type will be displayed.
Next we will create a stream. We will run a csv file in loop for this article. The stream can be from a File, Goldengate, JMS or Kafka. We do not need to make a connection for running a file in loop.
- Click on the Create new Item drop down
- Select File from Stream menu
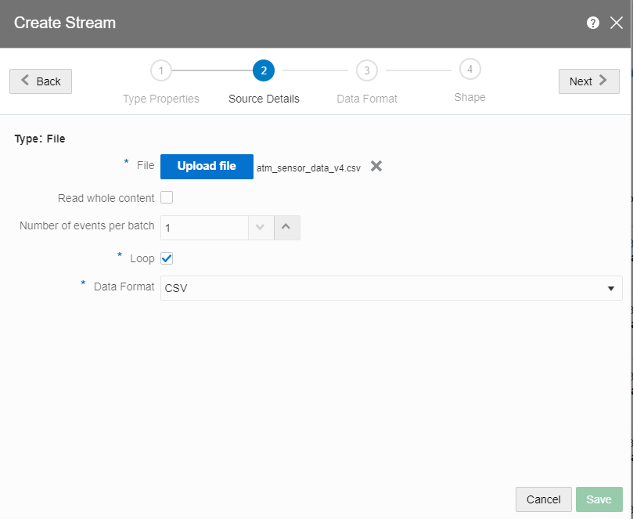
- Create Stream has four sections
- Enter the name of the stream and select stream type as file in Type properties section
- In the Source Details section, upload the csv file and select the data format as CSV. It can take CSV and JSON as the formats.
- Let the Data Format be default and check the box for First Row as Header
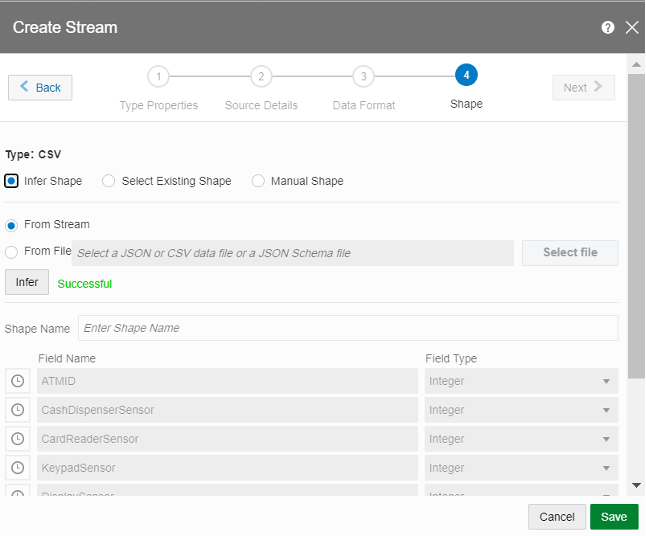
- In the Shape section, click on the Infer Shape and From Stream. It will display the columns in the CSV file.
- Let the Data Format be default and check the box for First Row as Header
- In the Shape section, click on the Infer shape and From Stream. It will display the columns in the CSV file.
We have created the reference and the stream of data, this will be visible in the catalog.
Before creating the pipeline, we need a machine learning model to predict whether any part of the ATM is about to go bad. The predictive model will score the data from each of the sensors installed in the ATM. The model can be created in OCI Data Science services and saved as ONNX format. The model will be uploaded in pipeline later. OSA can accept models in PMML or ONNX format. Save the model in your local drive or any other location to upload it in OSA.
- To upload the model, Click on the Create new Item drop down
- Click on the Predictive Model
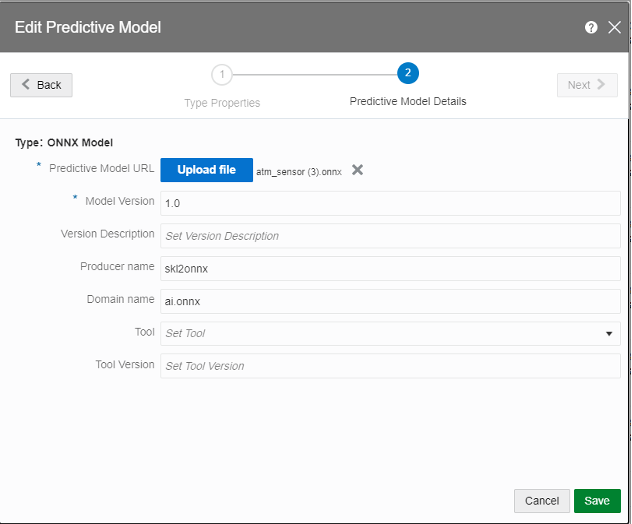
- In the Type Properties section, name the Model and select the Predictive Model Type as ONNX
- In the Predictive Model Details section, upload the ONNX file and enter the version.
We can now start to develop the pipeline.
- Click on the Create new Item drop down
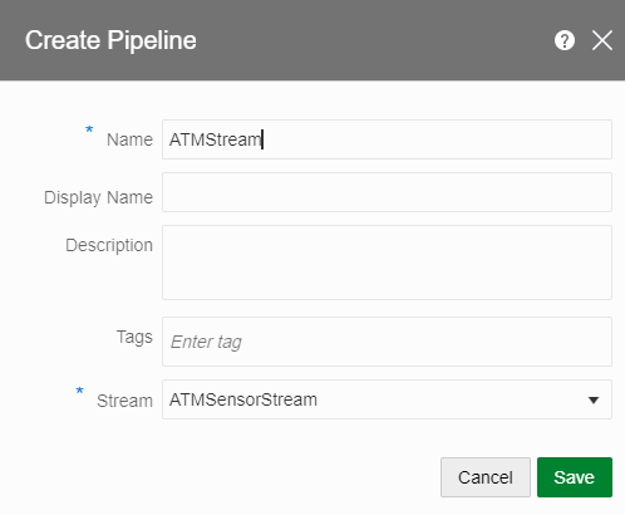
- Click on the Pipeline
- Name the Pipeline and select the Stream created above.
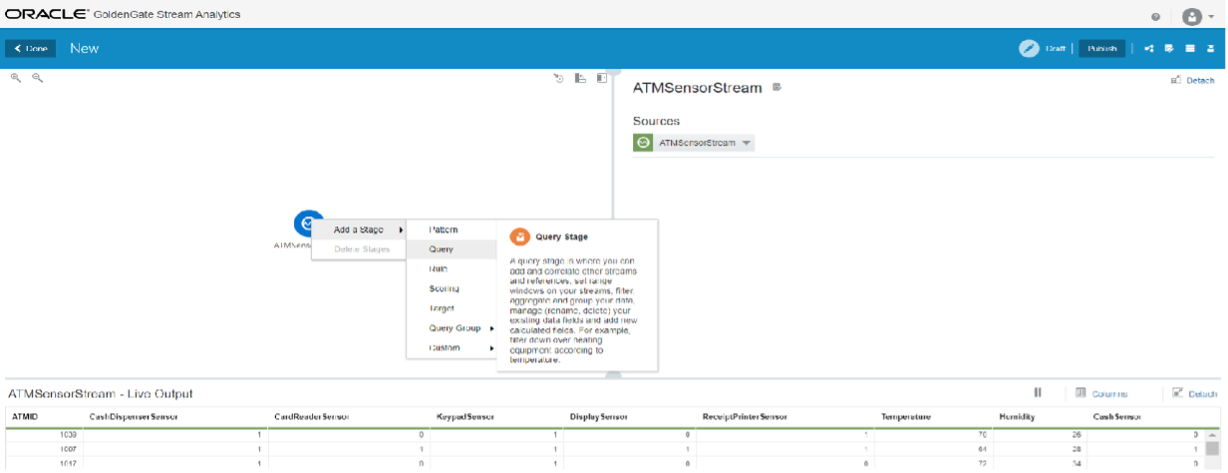
There will be three sections on the console, one where we will create the pipeline, second is where we see the properties for each of the stages in the pipeline and the one at the bottom shows the real time data in tabular form.
Right click on the stream and select Query Stage. We will join this with a reference machine data to get the machine details.
Once we have the machine details and the stream data merged in a stream, we will select a scoring stage and select the predictive model saved in the catalog. Next we will select Query Group and Stream.
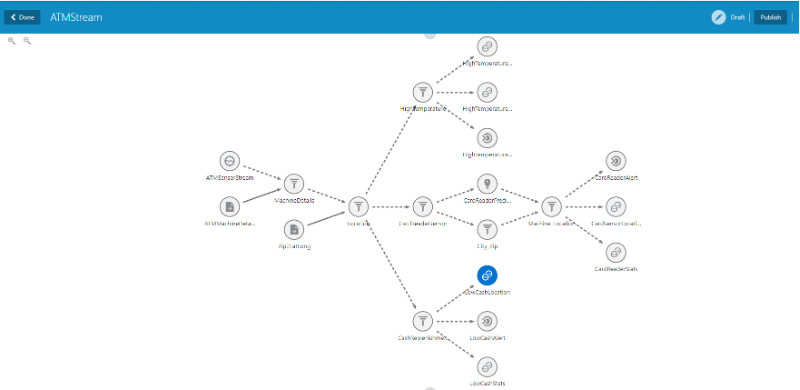
This is to create the visualization. The above diagram shows the full pipeline, it has more than one branch, but for simplicity, we are just going to create one branch for card reader sensor data. You can name the stream and then select the visualization. OSA provides variety of visualizations – pie chart, graphs, area under the curve and many more. We have latitude and longitude for each machine, so we plot it on the map as well besides selecting the pie chart.
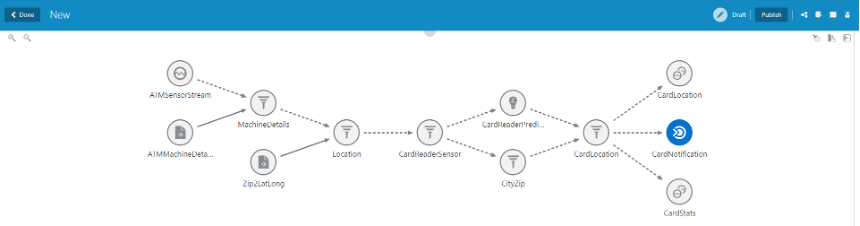
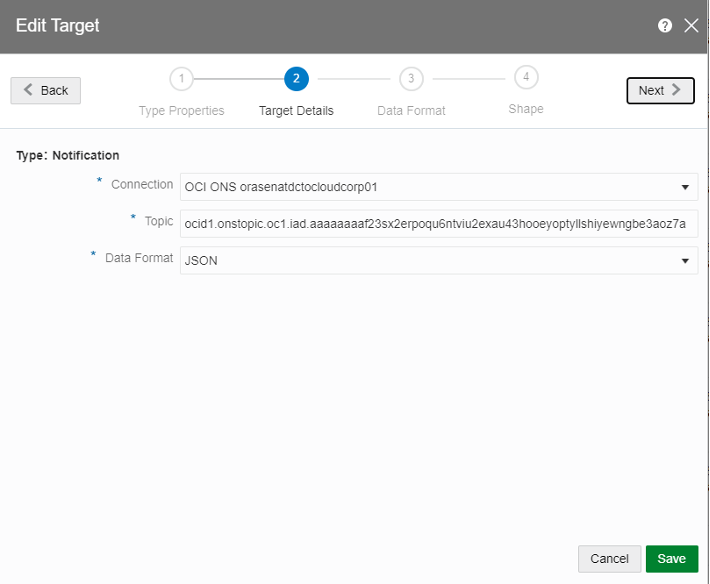
In the above pipeline, we create notification to alert the banker of machine about the malfunction. This can be done by selecting the target on the query stage. In the OCI notification service, we create topic and add the email of the relevant person. In the Target we add the connection (as created above) and the URL of the Topic.
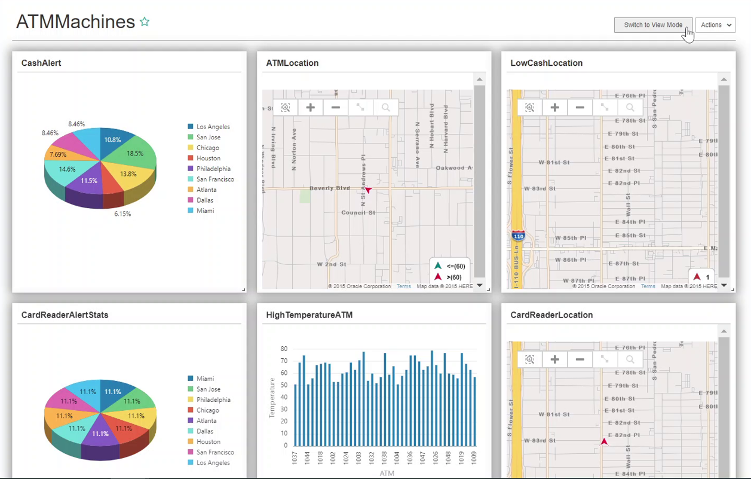
Once the pipeline is created, we want to see different charts in a dashboard. To create a dashboard, click on the Create New Item, select Dashboard. In the dashboard section, select the visualizations created above. The data will not be displayed on the dashboard till the pipeline is published. Publish the dashboard from the console, it will ask for the controller, executors and few more parameters. On selecting the parameters, it will take some time before the data starts showing on the dashboard. Below is the screen shot of the dashboard showing the stats for Card reader and the temperature on the map and the graphs.
Summary
This article attempts to simplify the steps involved in processing the streaming data and develop real time insights. The rich and powerful UI of Oracle Stream Analytics makes it very user friendly for anyone to develop the pipelines and infer insights from it.
Data
The stream data and the machine data used for above pipeline is provided here: