In this article, I’ll cover why you should monitor GoldenGate, what to monitor,, and how to monitor easily with the GoldenGate build-in capabilities.
In Real-Time Replication, the three key metrics concentrate on ensuring that changes from the source system to the target system are replicated as swiftly as possible. Service Level Agreements are based on:
- Health (Process status)
- Lag
- Throughput
It’s evident that the observables are interdependent: lag increases when throughput is insufficient or when processes are down. Low throughput may suggest that the source database is experiencing a heavy workload or that the system is limited by limited resources. You should only conduct a more in-depth analysis in the event of an incident, problem, or violation of a Service Level Agreement. Oracle GoldenGate’s robust features for system diagnostics and performance tracking allow you to proactively tackle potential issues.
Performance monitoring, the process of continuously tracking and analyzing the performance of your (database) system, GoldenGate application, or network, is important to ensure your system operates efficiently and effectively. Performance monitoring of your environment is crucial for several reasons:
- Identify Bottlenecks: To pinpoint areas that slow down performance, allowing for targeted optimizations.
- Resource Optimization: To track resource usage (CPU, memory, etc.) and make adjustments that improve overall efficiency.
- Early Detection of Issues: To catch and address errors or anomalies in real time, minimizing disruptions before they escalate into major problems.
- Ensure Reliability: To detect issues before they lead to outages, ensuring the application remains available and responsive.
In a longer term, you might also be interested in:
- Capacity Planning: To analyze usage patterns and anticipate future needs, enabling proactive scaling.
GoldenGate offers a variety of tools for performance monitoring, which have been enhanced over time and are functioning effectively. Some of these tools are considered basic features, as they are utilized by commands or included in report files. Others are part of the new GoldenGate Microservices Architecture, providing even greater capabilities. Additionally, there are specialized tools designed for both the core GoldenGate product and the Oracle Database.
- GoldenGate basics: report file, parameter settings, and commands.
- Performance Metrics Service
- Heartbeat table (enhanced in GoldenGate 21c)
- Stats-D Integration (new in GoldenGate 23ai)
- Integrated Diagnostics (available since GoldenGate 23ai)
- AWR Report (enhanced in Oracle Database 23ai)
The following discussion outlines the methodology to use based on the three key metrics. Performance degradation can arise from various factors, including resource constraints like CPU or I/O limitations and memory shortages. It can also be impacted by specific environmental conditions, such as high workloads during Black Friday/Cyber Monday or seasonal demands like annual statements and tax season. Furthermore, older systems that haven’t been adequately maintained or patched can exacerbate these issues. While there is no universal solution, you will receive a set of common best practices to guide you.
1. Health (Process status)
Let’s get started with the status of the process first:
It is obvious that the Extract, DistPath, and Replicat processes must be up and running.
You monitor the status within the WEB-UI, Command line tool, or directly with REST API calls:
Program Status Group Type Lag at Chkpt Time Since Chkpt
ADMINSRVR RUNNING
DISTSRVR RUNNING
PMSRVR RUNNING
RECVSRVR RUNNING
EXTRACT RUNNING EXTN INTEGRATED 00:00:02 00:00:01
EXTRACT RUNNING EXTS INTEGRATED 00:00:02 00:00:01
REPLICAT RUNNING REPN PARALLEL NONINT 00:00:00 00:00:05
REPLICAT RUNNING REPS PARALLEL NONINT 00:00:00 00:00:02
OGG> INFO DISTPATH ALL
DPNS running
DPSN running
Detailed information can be retrieved by addressing the process directly:
OGG> INFO REPLICAT dpns DETAIL
OGG> INFO REPLICAT repn DETAIL
In general, you should consistently monitor the ggserr.log and report file for errors and warnings. Informational messages can also provide valuable insights into your system. Regularly checking the ggserr.log and report file is essential. If a process occasionally restarts, you’ll likely see this reflected in the report file as well.
2. Lag
Replication lag refers to the delay between when a change is made in the source database and when that change appears in the target database during the data replication process. In real-time replication, lag is a critical factor in replication environments. While you can obtain some lag information from the process status, the lag command offers more detailed insights.
Sending getlag request to Extract group EXTN …
Last record lag 3 seconds. At EOF, no more records to process
OGG> DBLOGIN USERIDALIAS ggsouth
OGG> LAG REPLICAT repn
LAG AGE FROM TO PATH 6.14s 7.05s cdb23:CDB1_PDB1 CDB23:CDB1_PDB2 EXTN ==> servernorth:9232:DPNS ==> REPN
Sending GETLAG request to Replicat group REPN …
Low watermark lag: 6 seconds High watermark lag: 6 seconds
At EOF, no more records to process
With this command, I am checking the lag for both the Extract and Replicat. By connecting to the database using DBLOGIN beforehand, Replicat provides extra details about the processing window (low and high watermark) of the process.
To prevent the need to run the command multiple times, you can utilize the HEARTBEATTABLE. As noted in the previous command, even the lag command offers additional insights about the heartbeat. The GoldenGate WEB-UI includes a page that presents the lag history in a single view:
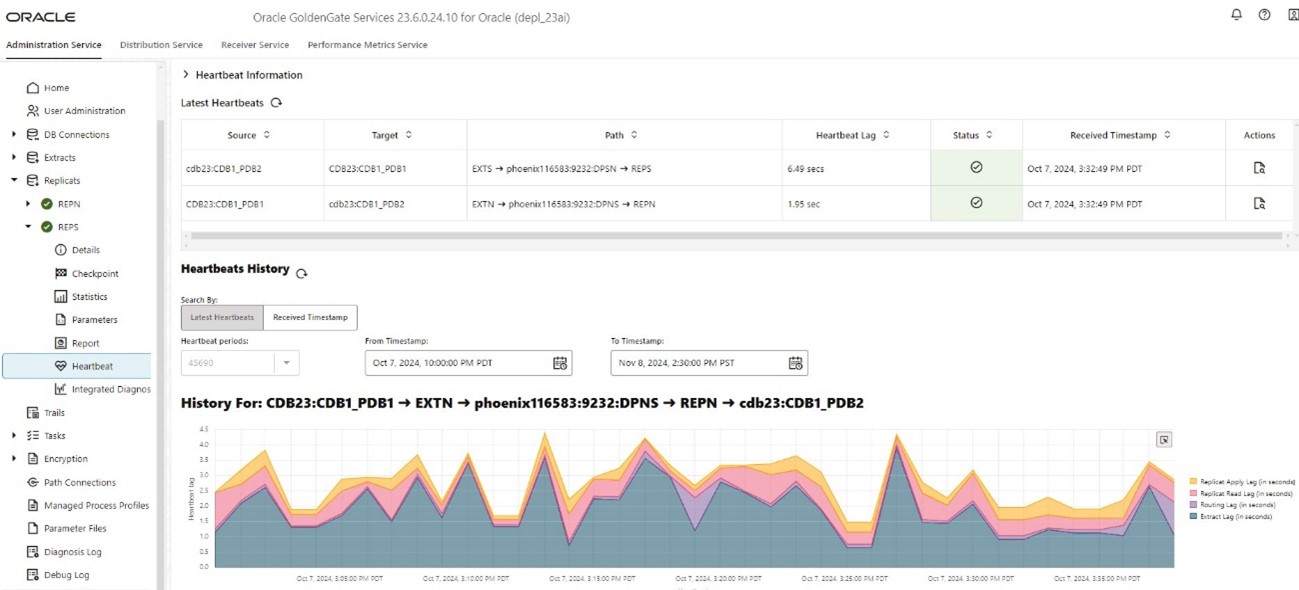
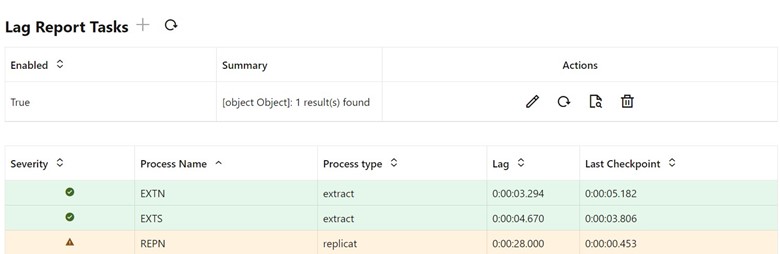
The Heartbeat table not only displays the End-to-End lag but also indicates which component—Extract, DistPath, or Replicat—is causing the lag. This information allows you to quickly identify the root cause and conduct a more in-depth analysis. If you wish to receive alerts when the lag exceeds a certain threshold, you can set up a task that periodically checks the lag and provides additional details if it becomes too high:
If the Extract lag is high, you may want to determine whether this is due to the Extract program within GoldenGate or the database components of the LogMining Engine and Capture. For the database side, you can utilize the enhanced AWR report or the Integrated Diagnostics (both covered later) to pinpoint the bottleneck.
One possible cause of Extract lag is the presence of long-running or large transactions, which can be identified through the Extract parameter settings.
Transactions at the source database being open for more than 1 hour will be alerted in a 15 minute interval. In a second step, you might check, if this transaction is also large (containing many changes).
If the transaction is long and very large, there is a likelihood that Extract performance is impacted.
3. Throughput
Let’s dive into the 3rd topic: Throughput. Throughput is a measure of how many units of information a system can process in each amount of time.
As mentioned earlier it is essential to check the report file for monitoring GoldenGate.
First, useful informational messages are displayed, warning and errors are alerted. With additional parameter settings, you also get throughput information for the process.
In my report files, I usually use the following setting:
Adding the RATE keyword to the setting changes the output from providing the absolute numbers to the change of numbers, which is more important when struggling with Performance:
2,053,693,920 records processed as of 2017-02-21 18:20:42 (rate 3800, delta 3989)
2,054,458,560 records processed as of 2017-02-21 18:30:42 (rate 3797, delta 1274)
The range shows you the changes per second from the time you started the process, while the delta provides the throughput rate per second within the last measurement interval (here: 10 minutes).
From this information, you can already make following conclusion:
- If overall throughput lower than within the last interval, the system is performing well.
- If overall throughput lower than within the last interval, there might be an impacting change.
To dive deeper into the analysis, you might want to get more detailed statistics about the tables being modified. For this reason, you can run statistics:
Additionally, statistics are available in the report file when the Extract or Replicat process stops.
While the previous (lag) example is from the category of environmental factors (source database workload), there might be other cases such as configuration issues. Assuming you have a very high workload at your source database, you might consider using the Extract parameter settings:
In a previous blog, I already discussed the Replicat statistics using Parallel Replicat. Please have a look at it as the statistic information for Parallel Replicat is elaborated.
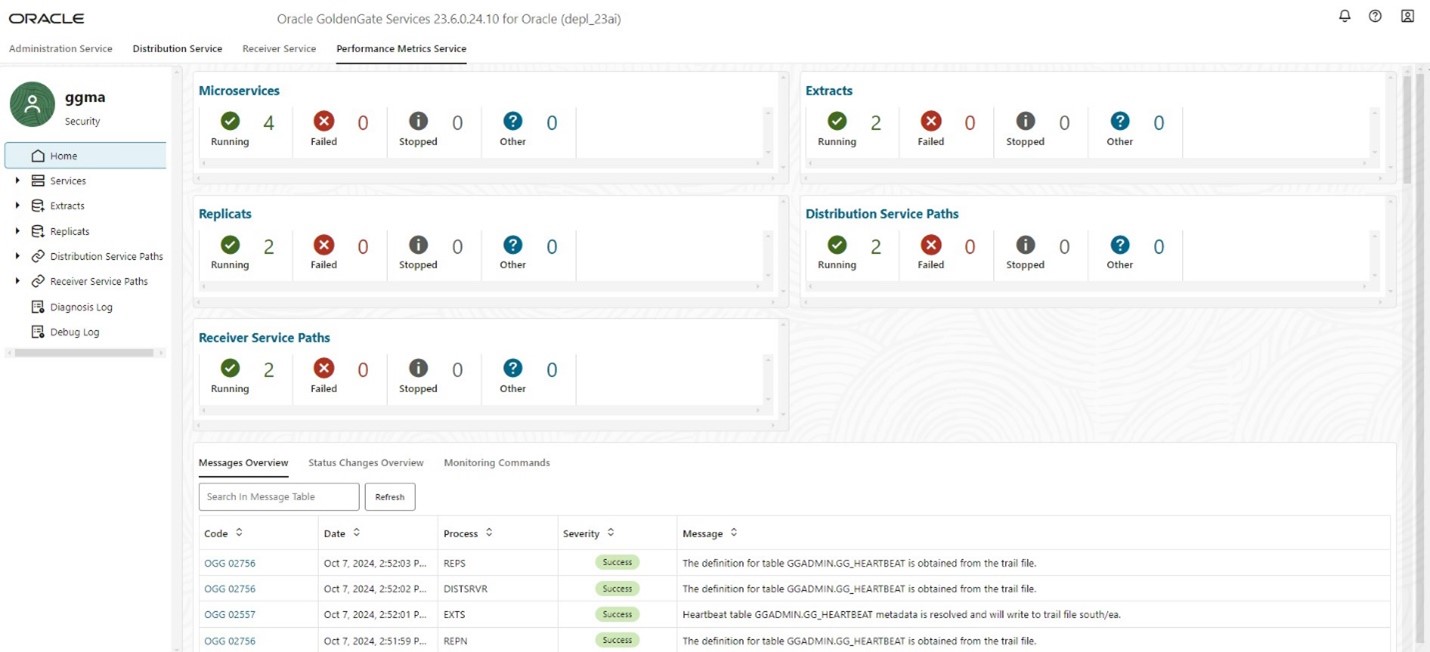
Rather than constantly running commands from the terminal, you can also leverage from the Performance Metrics Service that provides you this information. The Performance Metrics Service in Oracle GoldenGate allows users to monitor the Real-time performance of all processes from a single interface:
- Performance metrics collection for services and processes:
- Process Performance & Process related statistics
- Thread Performance
- Database Statistics
- Trail File Information
- Status Information
With the Performance Metrics Service, you can already drill down into a deeper analysis.
You easily identify the problematic component and retrieve information from the process and even the related threads.
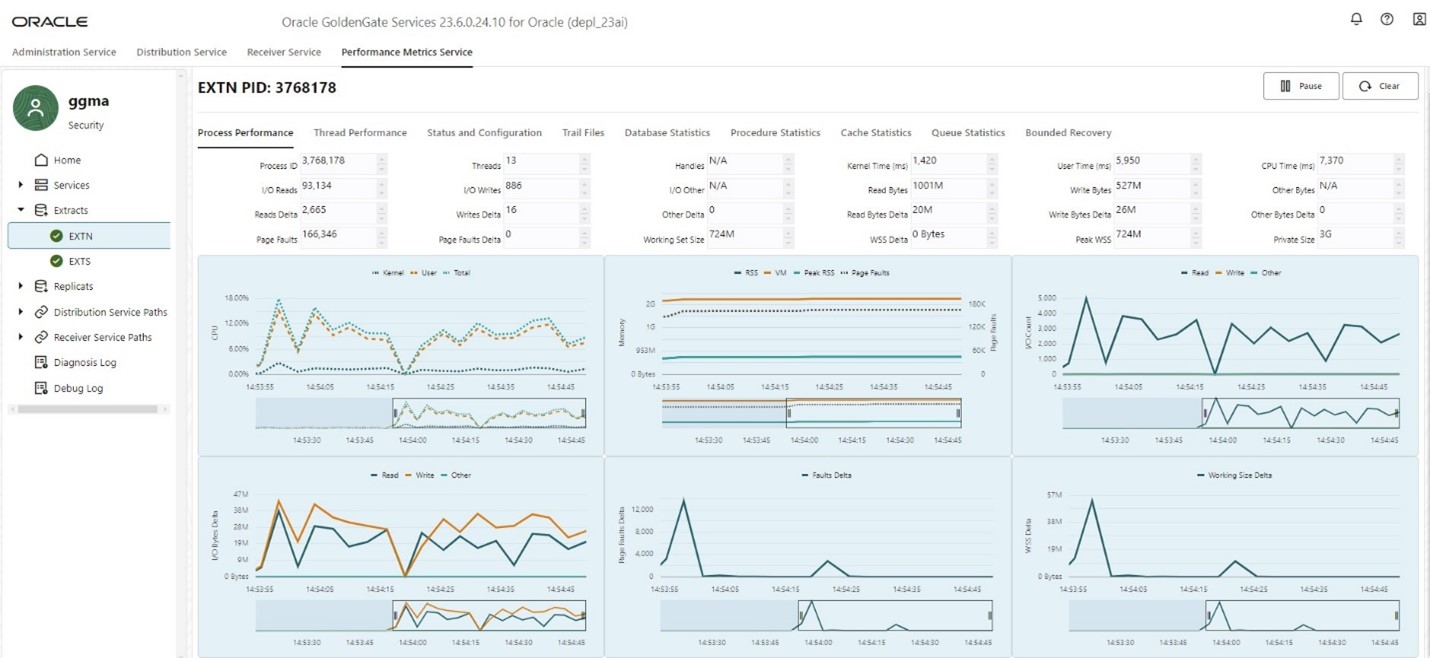
Beside the Throughput, you are also interested to measure the lag within GoldenGate. The lag tells you how far behind the target database is in time related to source database changes. The Performance Metrics Services only displays the actual Real-Time data.
There is no historical information available. If you need this information for a historical analysis or for a Dashboard, you might want to use the option to store the information in an additional repository out of your production environment. There is a blog available with a sample implementation using an ELK Dashboard. With Oracle GoldenGate 23ai, you also have the option to enable StatsD at deployment time or later. There is also a blog available showing how the telemetry data is pushed to a telegraph application that is used by influxdb and visualized via Graphana.
|
|
|
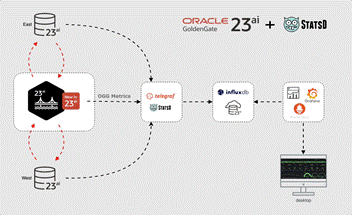
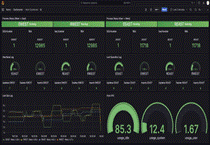
If you have a fleet of GoldenGate environments and want to monitor many processes even in different deployments, you can use such a dashboard that provides the key metrics for all environments in a single dashboard.
I would also like to focus on the database and highlight recent enhancements. Within Oracle Database 23ai, the Replication section is enhanced, and it provides additional information such as resource utilization, foreground/background wait events, and SQL statistics.
Even in environments where non-replication-related business components are causing significant performance issues, the Replication section now supplies all the essential database-centric performance data.
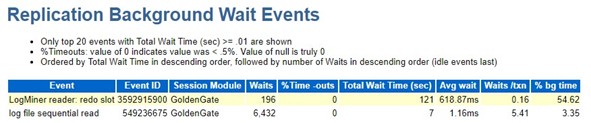
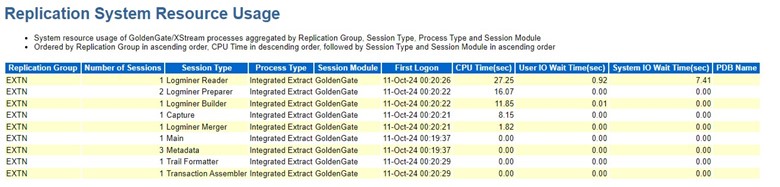
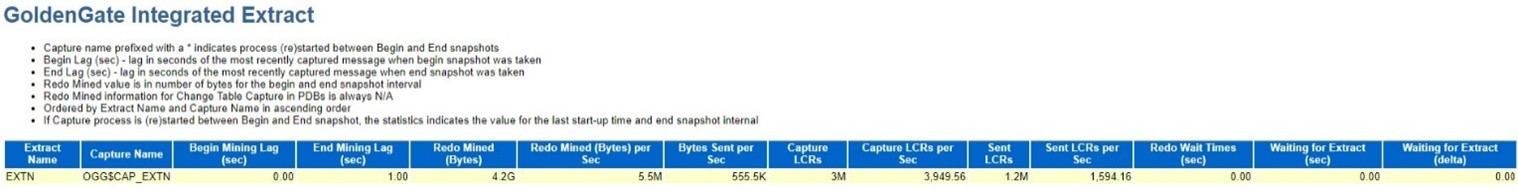
Here, I also want to highlight the Information for the Integrated Extract where you see the “input” (Reading from the Redo- or Archive log files), processing, and “output” (sending logical change records to the Extract).
While the AWR report shows information about the full database and you are already able to drill deeper into the GoldenGate components, you might want to use the Integrated Diagnostics to have a full understanding of the database component of Integrated Extract.
The integrated Diagnostic tool replaces the older Replication Performance Advisor (UTLRPADV) and you can to drill down into the sophisticated LogMing and Capture engine and retrieve all necessary information user-friendly organized for an in-depth examination. This might be discussed in a further blog.
Before concluding, I want to emphasize that all outputs can be accessed through REST API calls. Information such as report files, heartbeat tables, statistics, Performance Metrics services, and Integrated Diagnostics can be easily retrieved and processed programmatically.
In this blog, I outlined the key metrics essential for monitoring GoldenGate performance. I also discussed various methods for measuring performance and highlighted the specific tools suitable for both general and in-depth analysis. Performance monitoring and, in particular, performance tuning are complex subjects. I’ve highlighted the key features without delving into the finer details. Each of these topics could be explored further in future discussions. Some subjects are already connected to other blog posts, while additional ones may be added soon.