Graph analysis is a powerful tool for discovering hidden connections and traversing complex relationships in your data. And now, starting with Oracle Database 23ai (formerly Oracle Database 23c), you can easily use SQL to create and analyze property graphs using your existing database tables. This means you can now seamlessly join your graph analytics to other enterprise data for insights that otherwise would be difficult to achieve. Even better, you can get started using the new graph capabilities for FREE using the latest Autonomous Database Container image or with an Always Free instance.
Let’s take a look at some of these new capabilities. We’ll create a property graph view over existing data about users, the content they post, and their engagement with other users and posted content. We’ll then use the new SQL clause (SQL:2023 GRAPH_TABLE and MATCH clause) to express graph patterns and find the users with the most interactions and the posts with the most or least engagement.
Why you should use SQL property graphs in Autonomous Database
The graph model using the SQL property graph works like a ‘view’ on data and unifies property graphs with other database content such as JSON, Vector, and Spatial, eliminating the need to deploy, secure, manage, and synchronize a separate graph database. Since data is not replicated, changes to data (i.e., inserts, updates, and deletes) in the source tables are instantly reflected in the graph. This enables applications using business data, like financial transactions, to identify hidden connections and patterns within data in real time while benefiting from the scalability, consistency, security, and autonomous operations offered by Autonomous Database.
How to get insights from your property graphs
The following two videos show how to work with SQL property graphs using standard database tools. In the first video, we use Database Actions SQL Worksheet available in the Autonomous Database Container Image.
Graph Studio is a fully managed, self-service graph data management and analytics environment, with a visual interface that makes it easy to work with graph tables and models. It is a feature of Oracle Autonomous Database Serverless (ADB-S) to store, manage, and analyze data as a graph. The second video shows how you can use Graph Studio to create and query the sample graph used above in an Always Free instance of Autonomous Database.
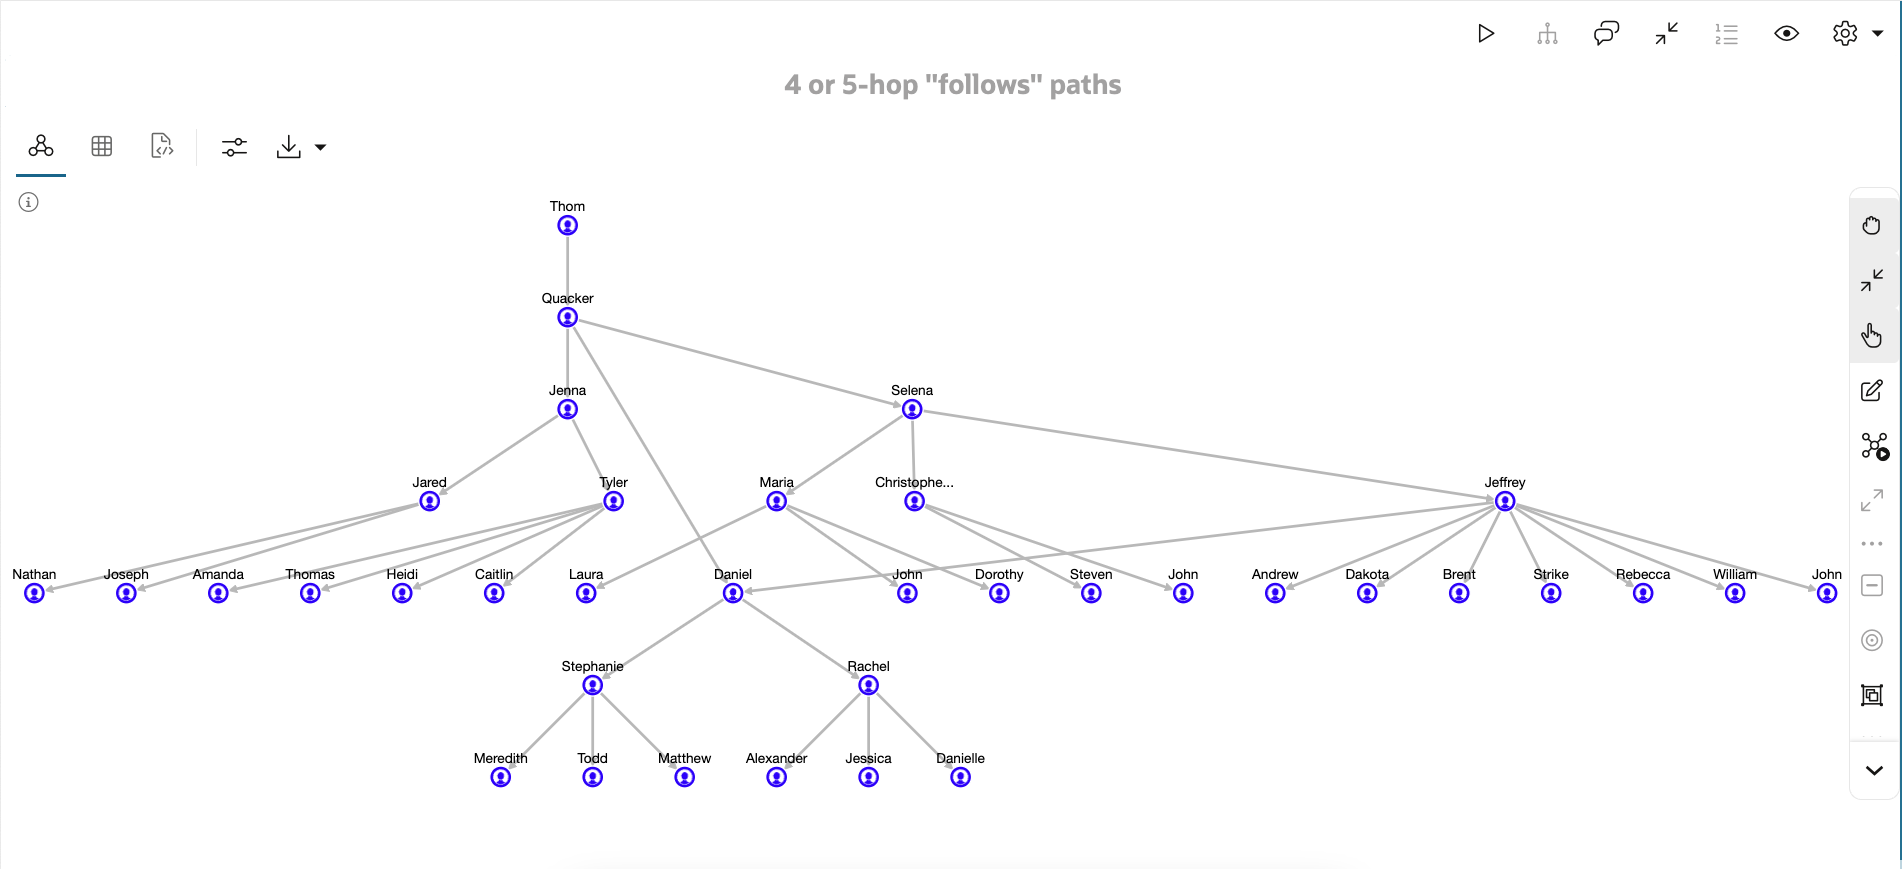
With the built-in Graph Studio, you can create intuitive, interactive graph visualizations that make viewing relationships and detecting patterns simple. For example, you can filter the graph to focus on a subset or expand selected nodes to further explore their connections. The following example shows how Graph Studio visualizes the Follows relationships among Users that are either 4 or 5 hops long. That is, paths of the form “A Follows B Follows C Follows D Follows E” or “A Follows B Follows C Follows D Follows E Follows F.”

Summary
With the introduction of SQL property graph in Oracle Database 23ai, you can now use standard SQL and all existing database tools you are familiar with to create and query property graphs. While property graphs have been supported in Autonomous Database for years, the earlier versions required using PGQL, which is a precursor to the new SQL standard. Though PGQL will continue to be supported, the new SQL syntax greatly expands the range of tools and frameworks available for developing graph analytics applications.
Explore the new SQL support for property graphs. Get started with Autonomous Database Free Tier on Oracle Cloud or download the Autonomous Database Free Container Image.
Dig deeper – Additional resources
- Discover Oracle Database 23ai: Announcement blog
- Find out more about Oracle Graph: Feature page
- Read more about SQL property graph:
- Technical brief: SQL Property Graph in Oracle Database 23ai
- Webinar: Mastering the MATCH clause: New SQL syntax for graph queries
- Documentation: SQL Property Graphs
- Find more about Autonomous Database Free Tier and Autonomous Database Free Container Image

