The modern telecom provider platform requires integrating multi-vendor solutions, supporting multiple domains, and managing multiple network layers for physical, logical, service and customer topology views. A unified topology view is required for supporting technologies like SDN, NFV, and 5G with complex end to end (e2e) network slicing and supporting unified services to B2B, B2C and B2B2X customers.
In addition, the growing size of communications networks, with both physical and virtual components, need to work in unison to deliver the guaranteed network experiences that the world has come to expect.
Oracle Communications Unified Topology for Inventory and Automation (UTIA) is an open, standards-based cloud-native application that provides these powerful network topology management capabilities. It is part of Oracle’s Unified Inventory and Topology solution, and is built on Spatial and Graph technology in Oracle Database.
UTIA delivers unified service, network, and resource visibility across diverse network technologies, enabling real-time views of networks for automated and accurate management of network operations. Network engineers and designers can quickly get a view of how networks are interconnected, aiding automated orchestration and trouble resolution. In addition, UTIA provides sophisticated high-definition visualization capabilities so that a network engineer can effectively visualize and gain insights from the topology of networks.
Use of Oracle Graph
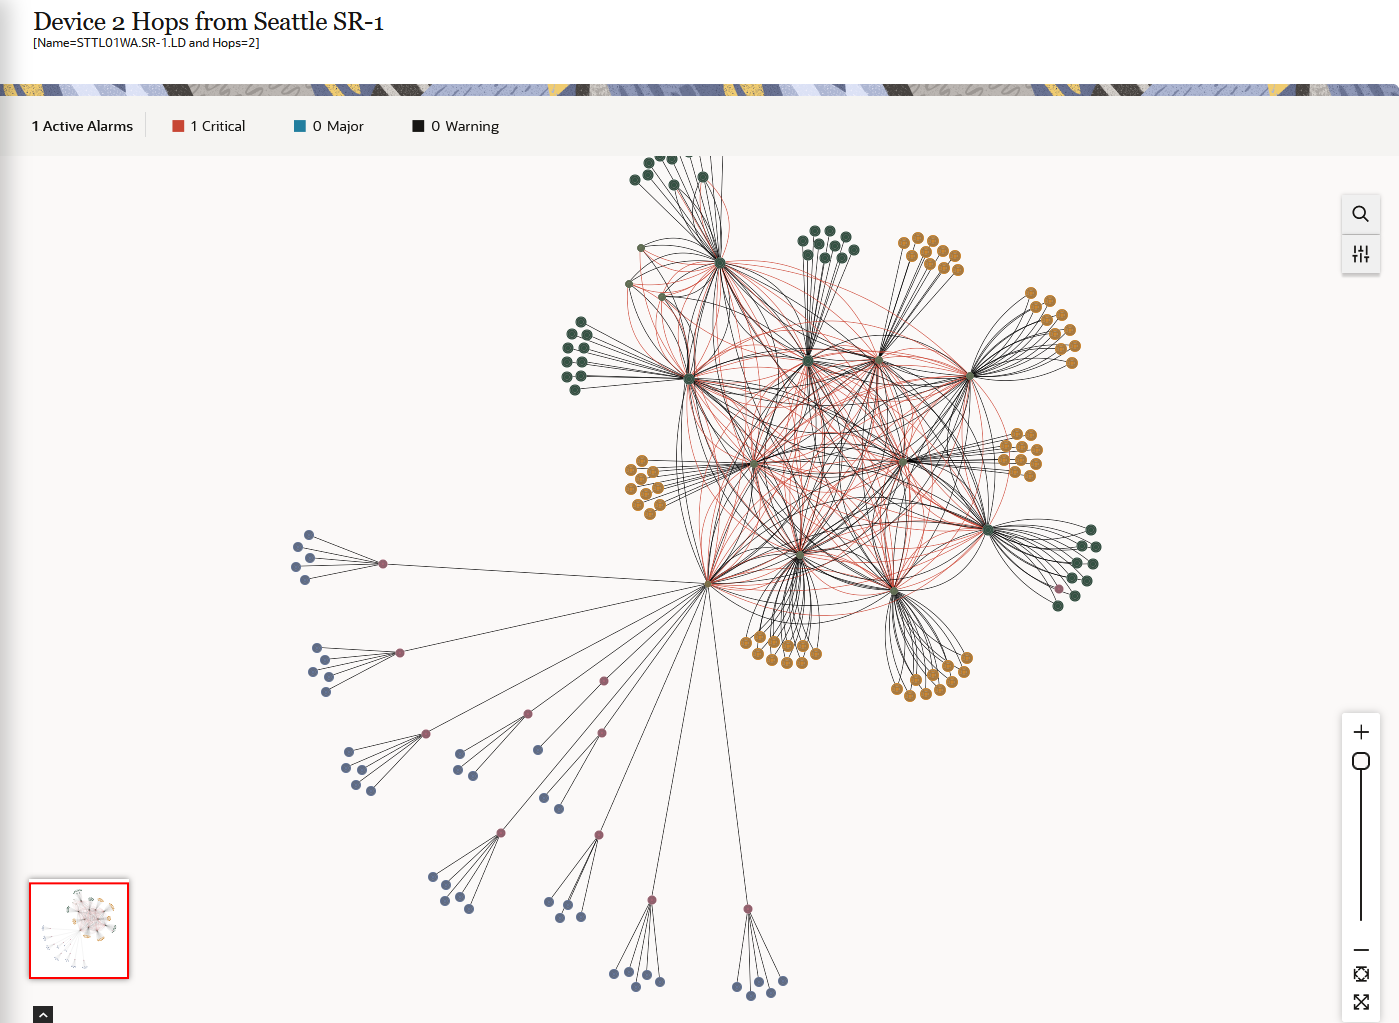
Modeling networks and interconnections between networks as a graph enables a variety of queries. Finding devices that are n hops away (or by distance), finding neighboring network nodes, finding the shortest path between nodes, finding the cheapest path between nodes are just some of the graph operations used by UTIA. When computing the cheapest path the cost function captures transmission costs such as latency, jitter, distance, and packet loss, giving network engineers and designers the tools to effectively make decisions.
Not only is this helpful for network engineers and designers, the path analysis API provides additional automation capabilities to bypass alarms and systematically support trouble resolution without human intervention. “Telecom data is a natural fit for modeling as a graph,” says Lee Latham, architect for this solution at Oracle Communications.
The graph database architecture includes a deployment of Oracle Graph Server (PGX) for high speed path analysis. The graph size used in our simulations is 40 million nodes and 15 million edges, which represents the estimated network size for a large service provider. Oracle Graph Server (PGX) can handle severe spikes of 25k to 30k per minute with no impact on resource usage. New data is added to Oracle Database and loaded into Oracle Graph Server (PGX) via the synchronization API, which syncs about 350k changes per hour.
The scalability of Oracle Graph Server (PGX) enables UTIA to deliver an orders of magnitude performance advantage over an earlier implementation of their solution when rendering network views. This advantage increases as the number of network nodes increases. Rendering of 10,000 nodes that took over 10 minutes now takes seconds.
The solution scales in other ways as well. The number of transactions per second remains the same when the dataset is doubled. The same hardware can process the increased number of transactions as the number of users increase.
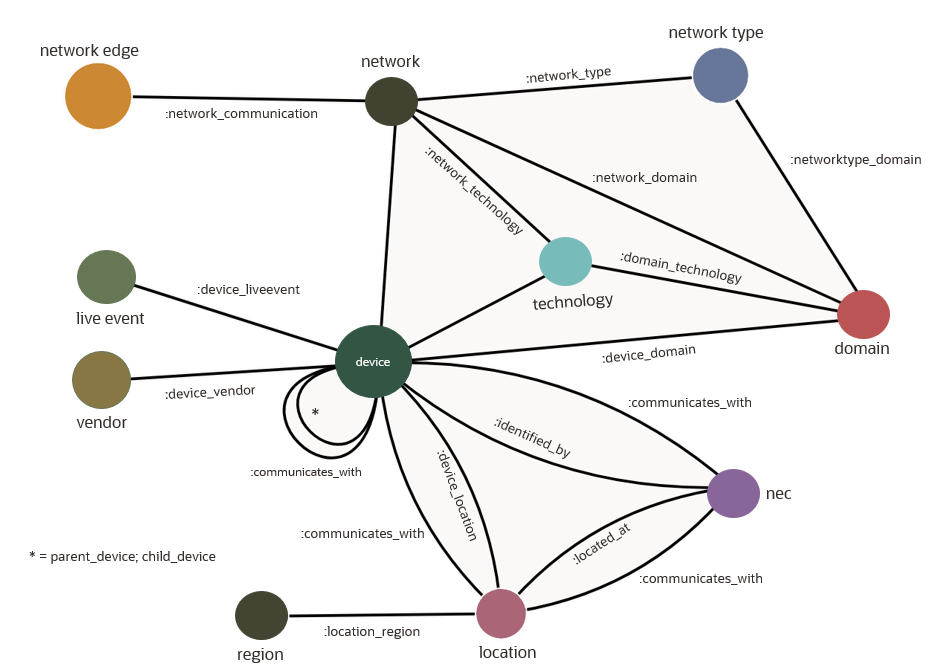
UTIA Property Graph Model
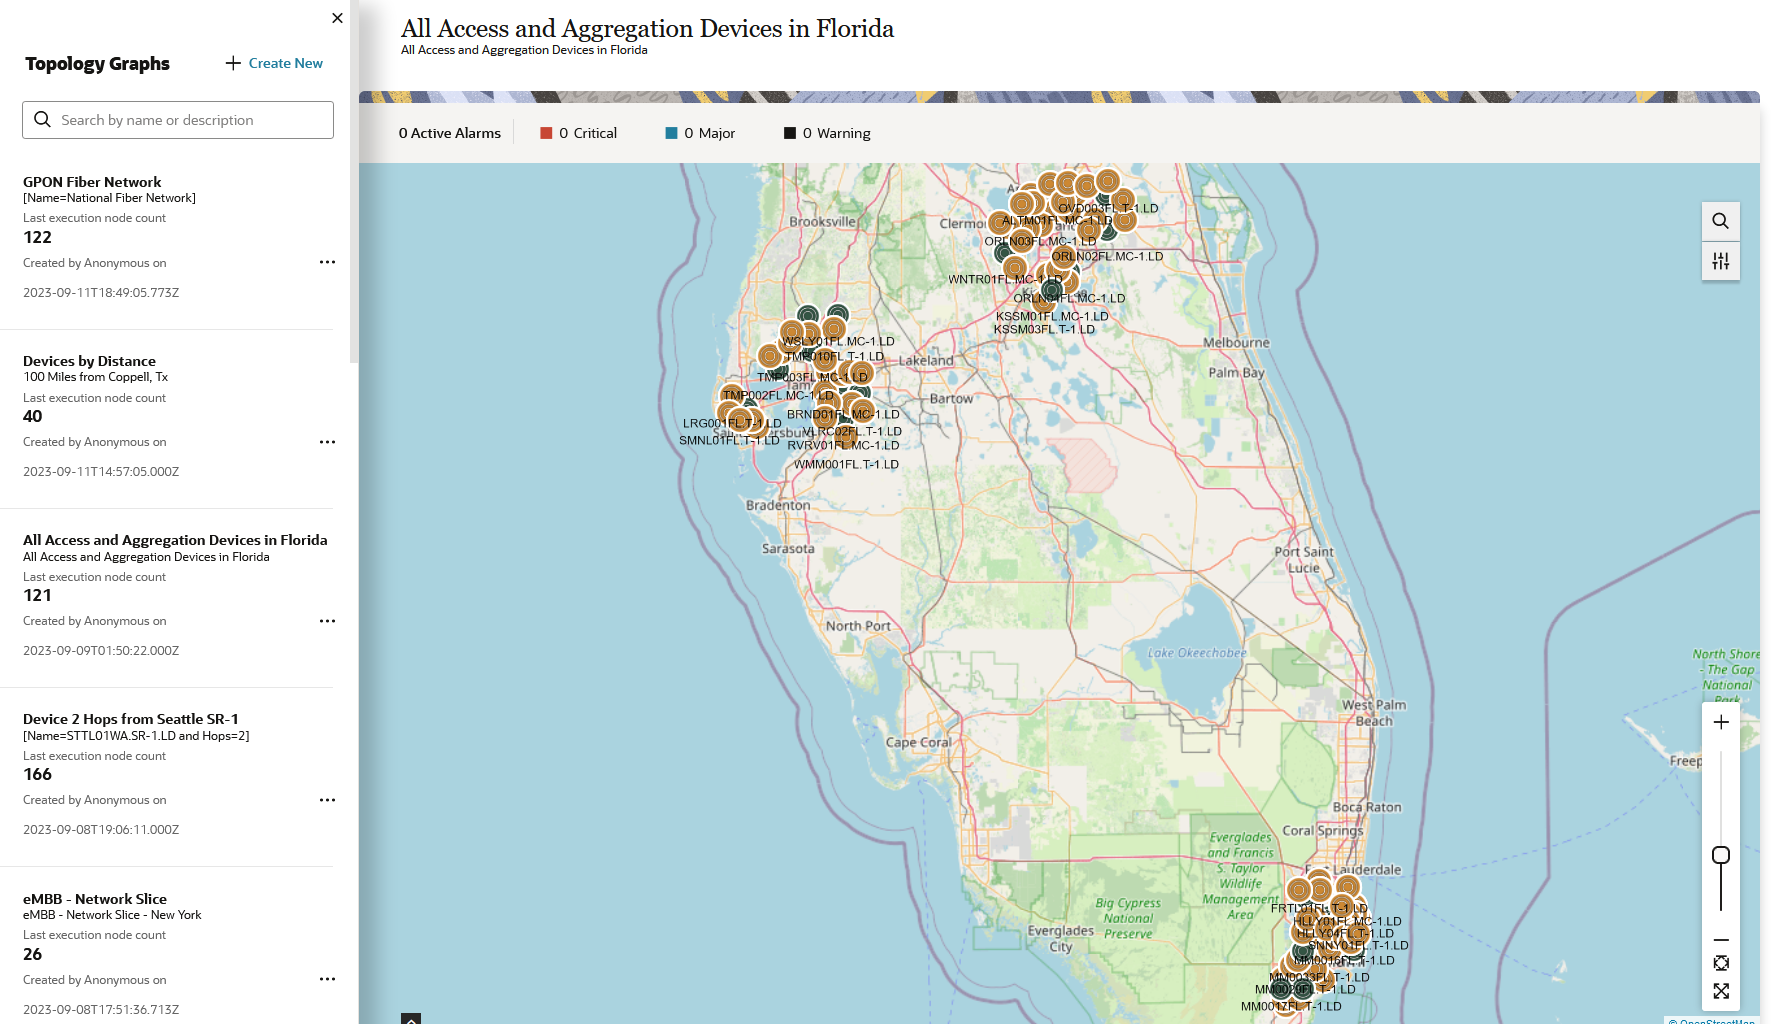
The path analysis done by UTIA runs the gamut – ANY PATH, ANY SHORTEST PATH, ALL SHORTEST, TOP K SHORTEST, ANY CHEAPEST, TOP K CHEAPEST, ACYCLIC paths, and more. With the capabilities of Oracle’s converged database UTIA also leverages Oracle Spatial to plot network nodes on a map and to find the closest network resource to support a specific service.
Oracle Communications plans future enhancements such as using sub-graphs to segregate a company’s network by city, state, region, and domain, using graph machine learning to support service impact analysis and closed loop resolution, and implementing automated detection and persistence of network rings.