Welcome to Dashboards
Brand new in Oracle Cloud Infrastructure (OCI) are Dashboards. This no-cost feature of OCI is easy to find; once you log into your OCI account, on the homepage, you will see a new tab in the top left entitled Dashboard.
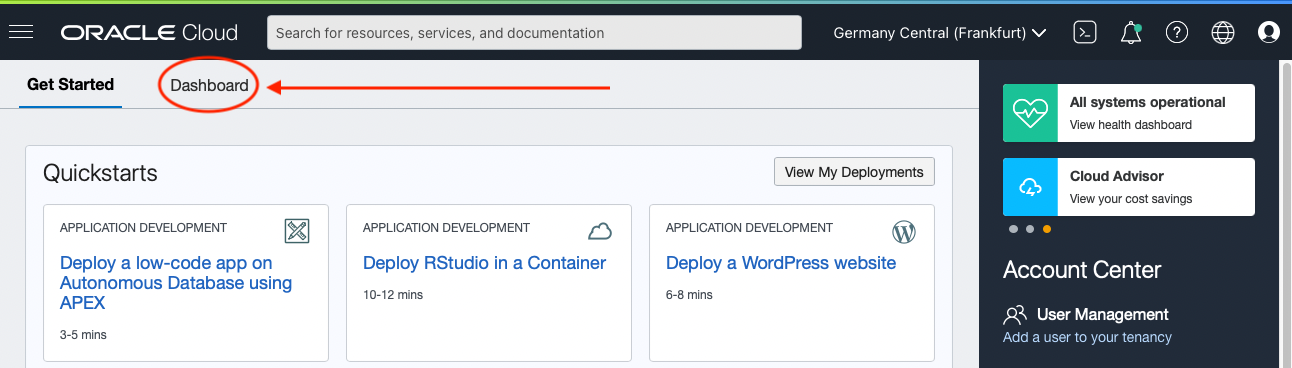
Click the link and off you go; create dashboards that show key metrics for all your services in one place. So how can we use this for Cloud Native application and database monitoring? To start, remember that out of the box, the services in OCI can produce logs and/or metrics. We can leverage this built-in framework when creating these dashboards.
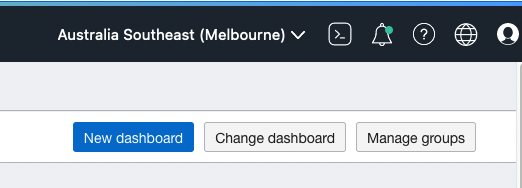
When you initially land on the Dashboard page, you can create a new dashboard by clicking the New Dashboard button on the upper right of the page.
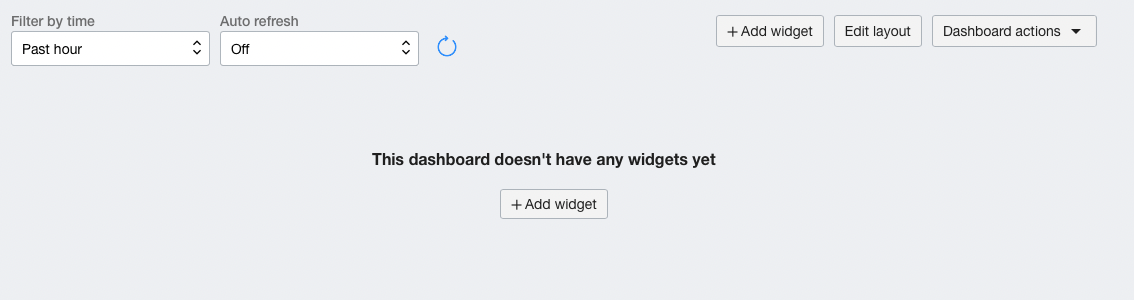
Give your dashboard a name, place it in a compartment and add it to a new dashboard group and click the Create button. We now have a blank canvas to start adding widgets.
Monitor the Estate
We can use Dashboards to monitor our entire enterprise application deployment; each individual component getting a widget to show critical metrics. In this example, we are going to monitor an Oracle REST Data Services (ORDS) deployment. The major components in this architecture are the compute instance where ORDS is running, ORDS itself and the cloud database back-end.
Starting with the compute instance, we can create a new widget with the +Add widget button.
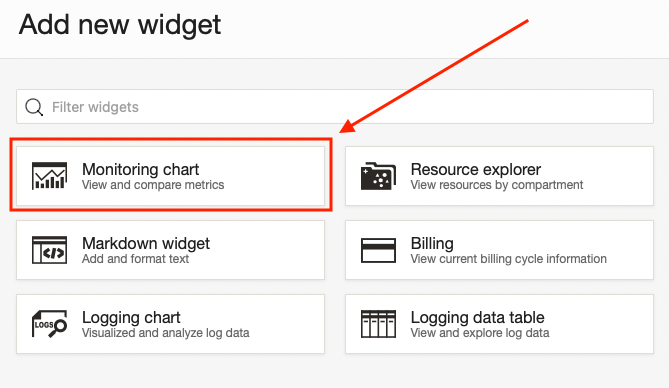
Here we are presented with a few options, but we want to select the Monitoring chart.
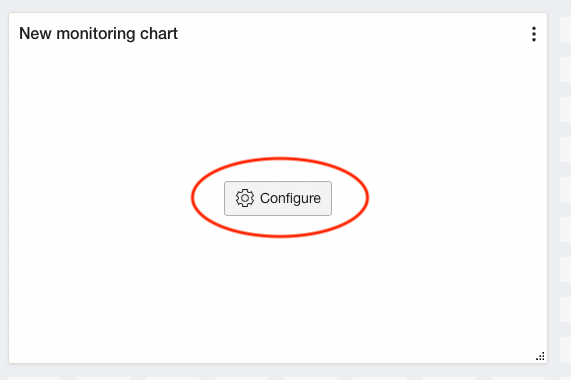
Once selected, you will see it on your dashboard. Just click Configure to get started with our first widget.
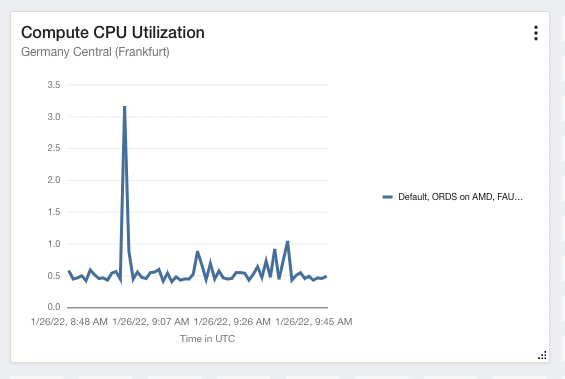
Using the Monitoring Widget Configuration slider, we start at the top with the Name. Our first metric we can capture is the CPU utilization of this compute instance so simply change the name to Compute CPU Utilization. Next, move down to the Configure metric query section. The first dropdown is Region and yes, you can have metrics on a single dashboard from not only multiple regions, but multiple compartments in those regions! Pretty useful if you say want to see the status of all your Autonomous Databases in multiple regions or how your load balancers are doing in Phoenix and Tokyo.
Ignoring Region for now, move to the next dropdown, Namespace. Using this dropdown in a region and compartment where you have a compute instance, we can see three entries relating to a compute instance.
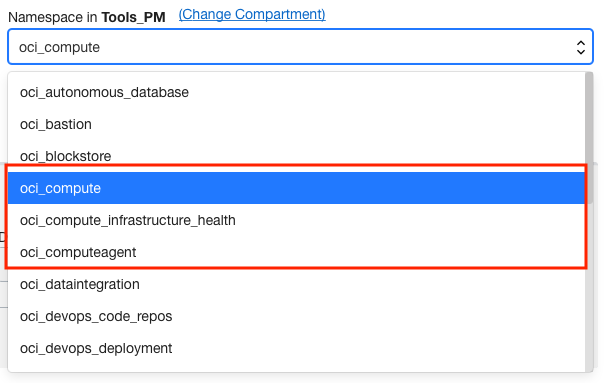
We want to look at the oci_computeagent namespace. This namespace allows us to display metrics the compute agent is sending from the compute instance itself and where we will find metrics such as Memory and CPU utilization, disk IOPS and the load on the VM.
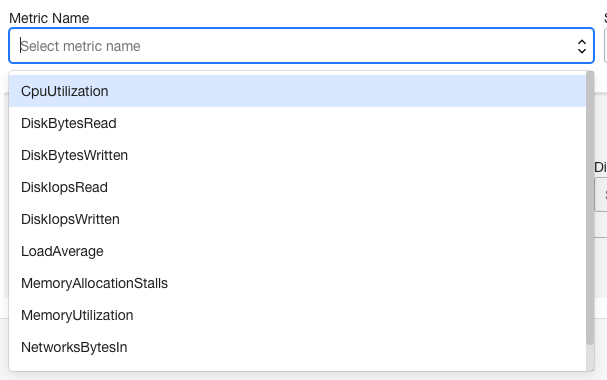
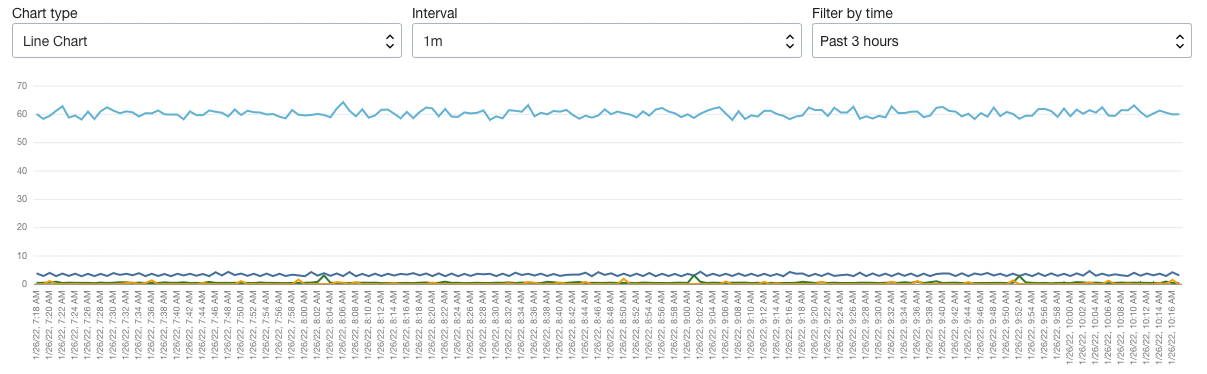
Choose CpuUtilization and set the next dropdown, Statistic, to mean. The upper region will refresh, and we will see a sample of what the chart will look like.
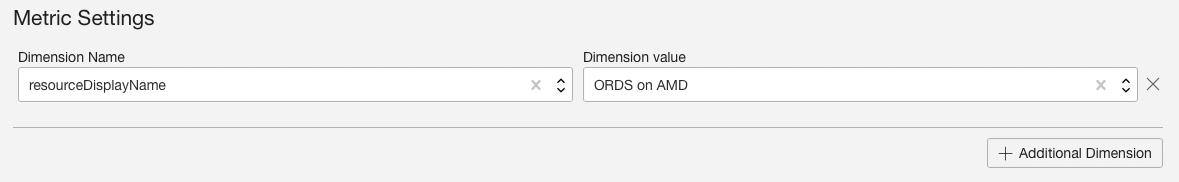
If you have multiple compute instances in this compartment, you can filter them out using the Metric Settings, choosing resourceDisplayName as the Dimension Name and then the name of the compute instance you want to monitor as the Dimension value.
And we are done; just click the Submit button on the bottom left of the slider to see it on your dashboard.
Everyone Loves a Log
Next up are the ORDS logs. To get the logs into OCI logging there is a little pre-work that needs to be done. You can see how to do that in the Oracle DB Tools Development Group’s GitHub repository here.
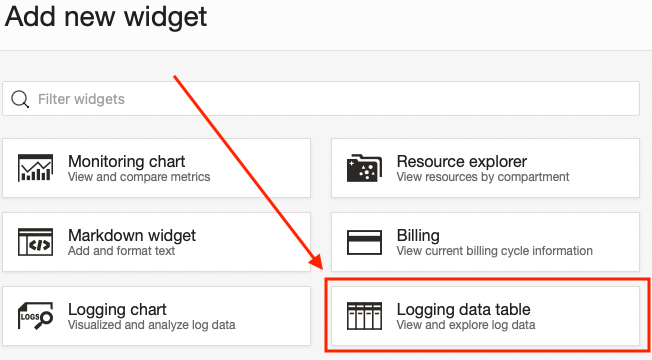
Clicking the +Add widget button in the upper right of the page and using the Add new widget slider, choose Logging data table.
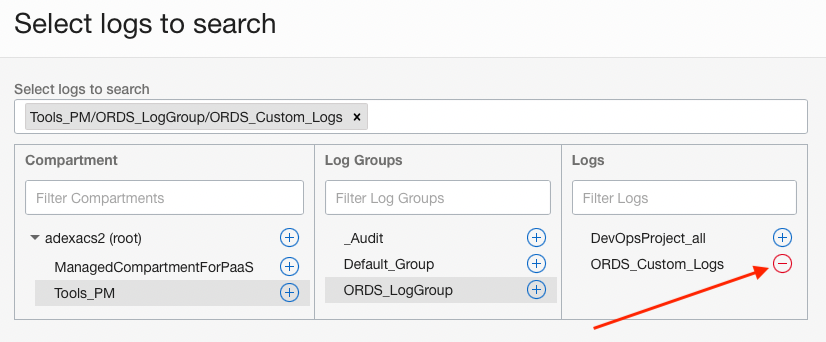
With the widget on the dashboard, click the Configure button as you did before. Using the Logging Data Table Widget Configuration slider, use the Name field to name the widget ORDS Logs. next, use the Select logs to search field to find the log holding the ORDS logs. Here my ORDS_Custom_Logs are in the ORDS_LogGroup in the Tools_PM compartment. Use the plus sign to the right of the log to add it to the logs to search section.
Once the log is selected, click the Continue button in the lower left.
Back on the main slider, with our log selected,
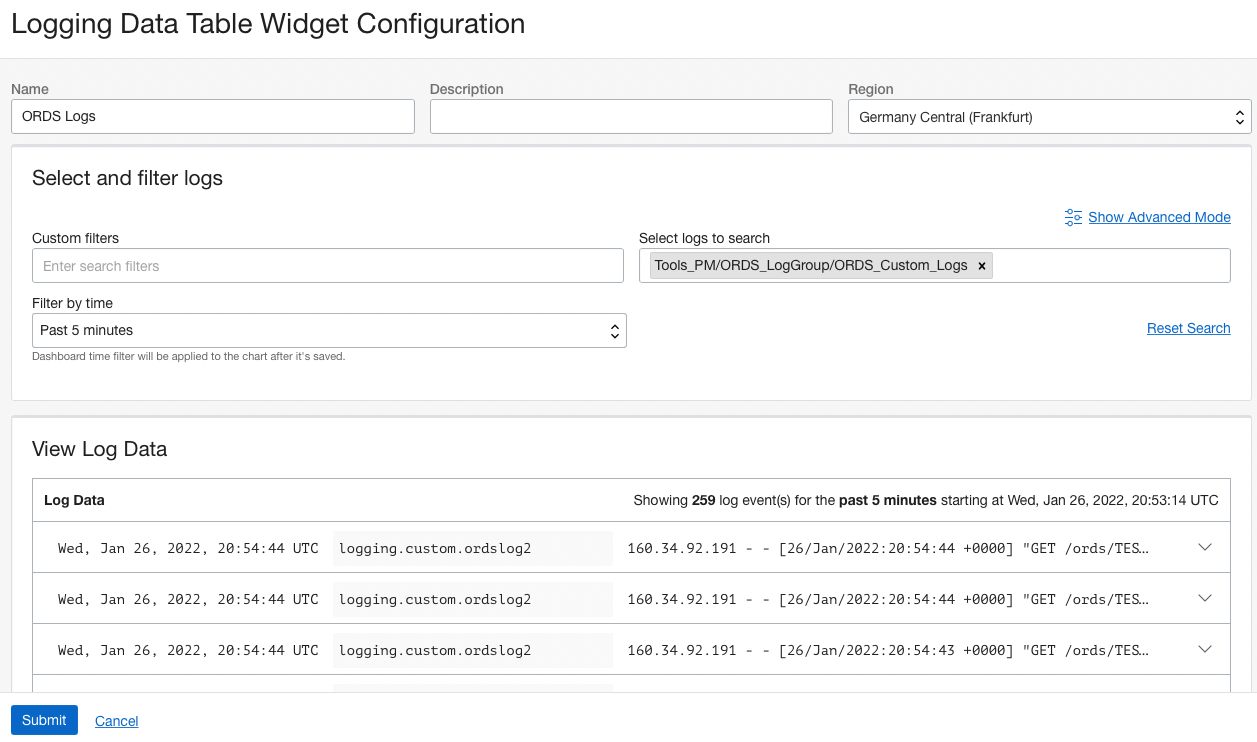
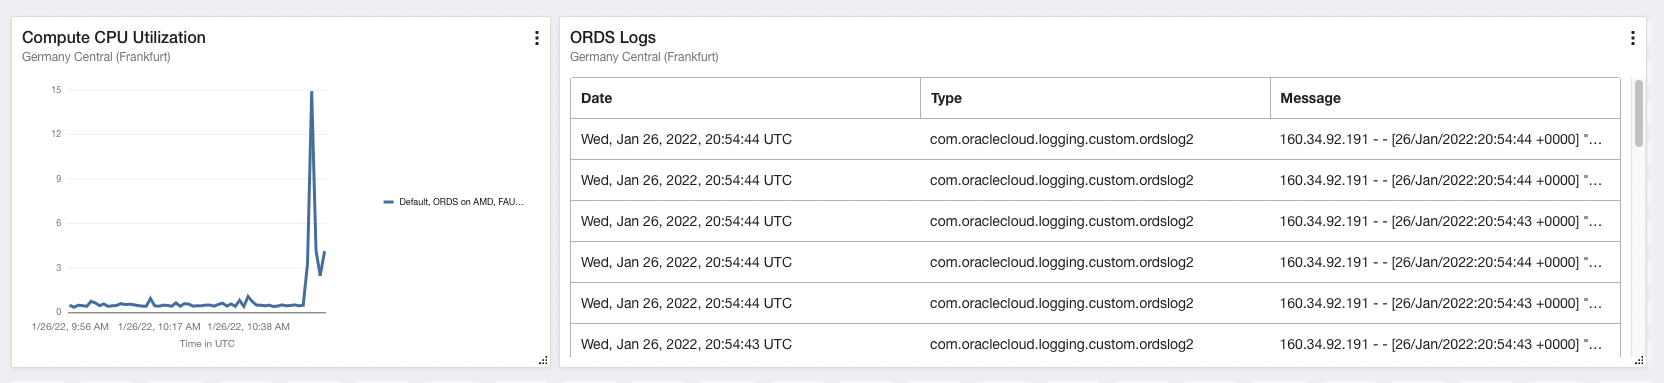
we can click the submit button in the lower left. We now have 2 widgets on our dashboard.
Time to add a Database one.
All the Flavors of Database
The last widget we are going to add is a database one. Now we have our choice here of adding any Cloud Database we want. In fact, Autonomous Databases have many metrics you can choose from right from the start. If you want to see metrics for a Cloud Database VM or a database on an Exadata Cloud Service there is a few prerequisites that need to be done before hand. In this example, we will be using a Cloud Database VM.
Just as before, click the +Add widget button in the upper right of the page and using the Add new widget slider, choose Monitoring chart.
With the widget on the dashboard, again click the Configure button.
Start with the Name field in the Monitoring Widget Configuration slider. We are interested in the database IOPS so name the widget Database IOPS. Now in the Configure metric query section, use the Namespace dropdown, and select oracle_oci_database.
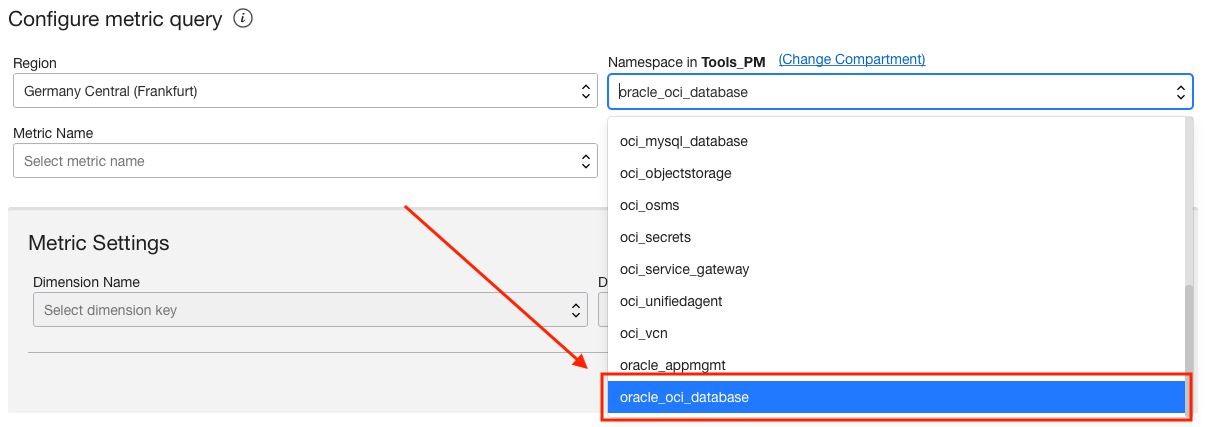
And for the Statistic, choose Max. The widget is done, just click Submit in the lower left of the slider to finish.
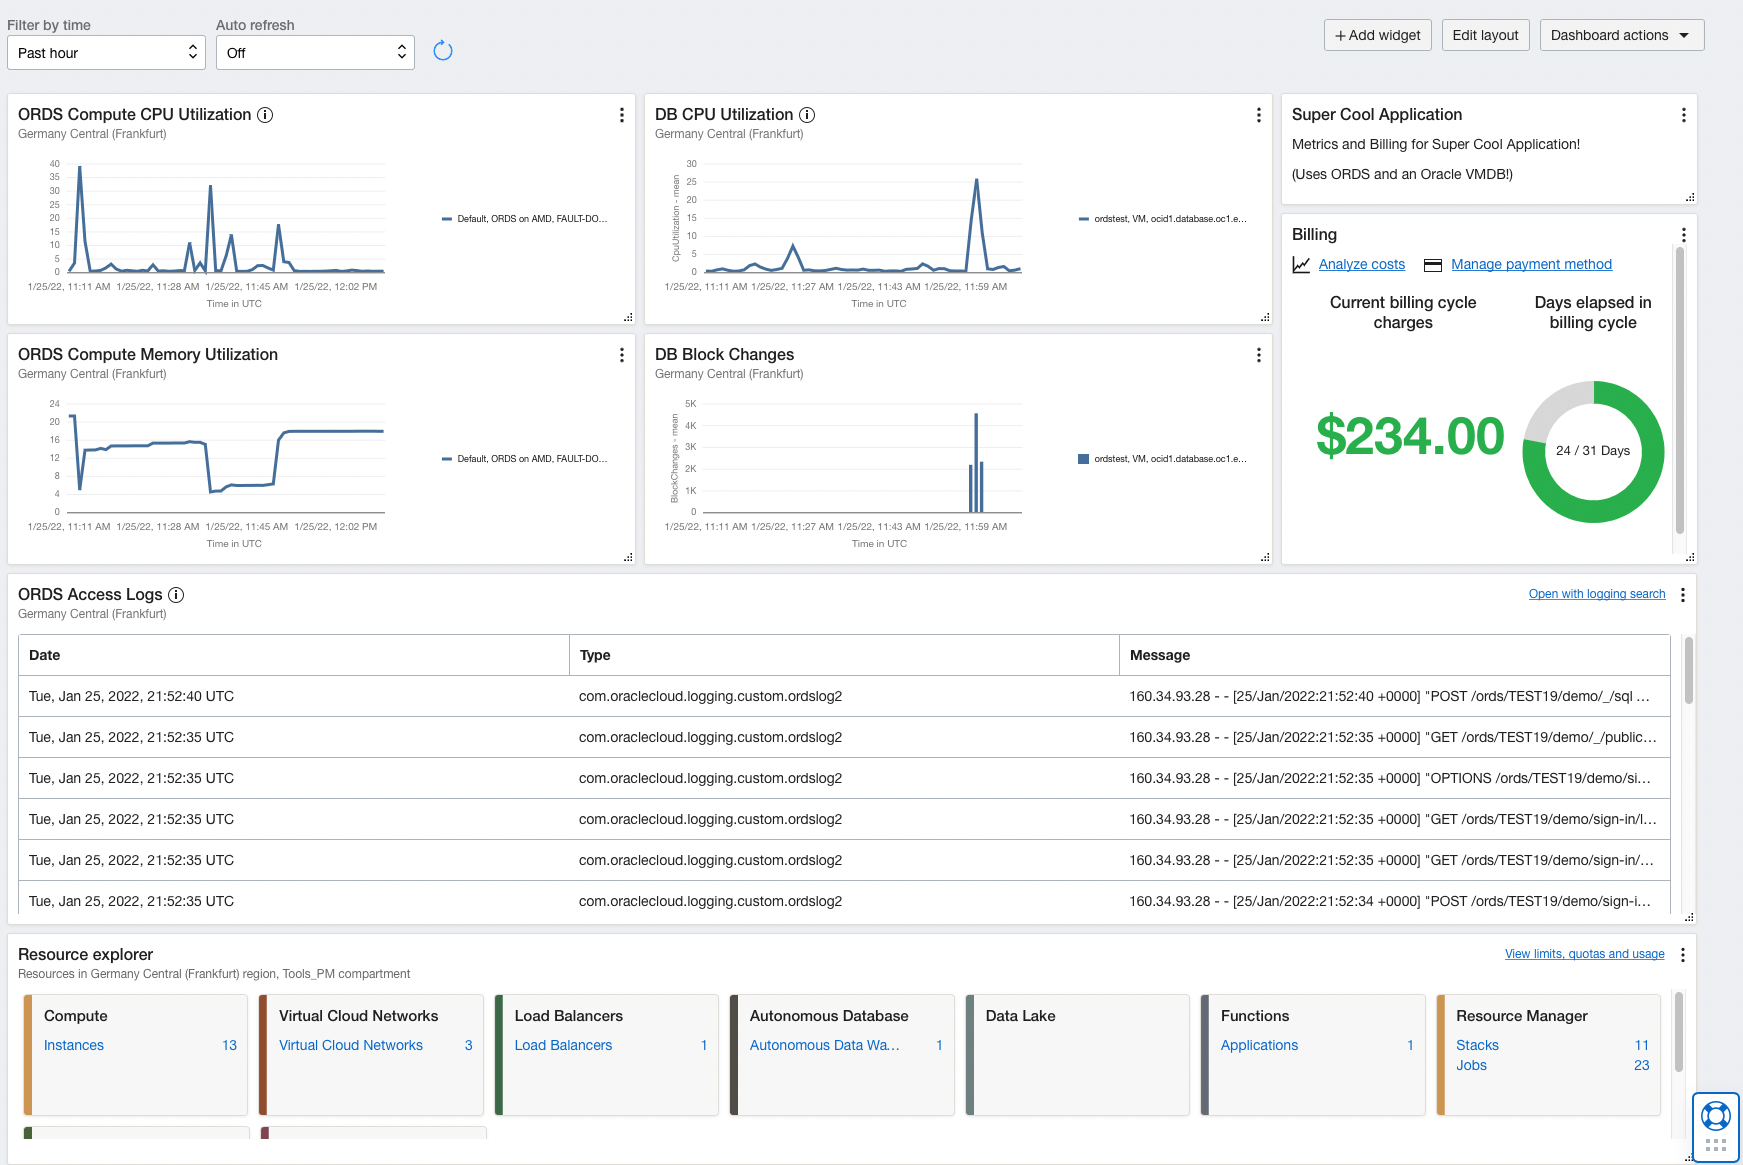
Now that you have the basics of creating these dashboards to monitor our ORDS implementation, explore more metrics and see what you can come up with!
Warning, Squirrel on the Tracks!
One final note to mention. Observability & Management in OCI can create alarms on any of the metrics you can use in the Dashboard for an extra level of monitoring. Set an alarm for thresholds or a state change of a service and be notified immediately. You can read more about this here.