In the world of data-driven enterprises, Oracle Autonomous Database on Dedicated Exadata Infrastructure and Cloud@Customer (ADB-D and ADB-CC) has established itself as a game-changer, offering a fully automated service that simplifies the development and deployment of application workloads. While it provides users with a user-friendly experience and advanced features like compute auto-scaling, RAC, and Autonomous Data Guard, there’s a critical aspect that operates behind the scenes: automated resource management.
This complex mechanism often remains hidden from users, sometimes leading to a sub-optimal understanding of how some of the features work or how the Exadata resources are utilized. In response to this, ADB-D is introducing Enhanced Resource Usage Tracking. This feature enables customers to gain granular insights into resource consumption, empowering them to optimize capacity utilization effectively.
Understanding the Resources
Before going deeper into how Enhanced Resource Usage Tracking improves capacity planning, let’s get acquainted with the critical resources within an Autonomous Exadata VM Cluster:
- CPU Count per VM or Node: This denotes the CPUs allocated to the cluster.
- Maximum Number of Autonomous Container Databases: This influences the local storage reservation and dictates how many Autonomous Container Databases you can create in the cluster.
- Database Memory per CPU (GB): The memory allocated per CPU within the cluster.
- Database Storage (TB): The data storage allocated for Autonomous Databases within the cluster.
Memory is always allocated in relation to CPU, so in this blog we’ll focus on enhanced usage tracking for CPU, Number of Autonomous Container Databases and Database Storage. Let’s dive into these key aspects and their enhancements.
Enhanced CPU Resource Management
Understanding CPU components provides users with valuable insights into how CPU resources are allocated and managed within the Autonomous Exadata VM Cluster. Reserved CPUs play a vital role in supporting various operations, including auto-scaling and VM failover, while reclaimable CPUs offer opportunities for efficient resource utilization.
Enhanced Resource Usage Tracking now helps you grasp this thoroughly by providing these metrics:
- Total CPUs: The CPUs allocated to the Autonomous Exadata VM Cluster.
- Available CPUs: CPUs available for creating or scaling Autonomous Databases.
- Provisioned CPUs: Total CPUs allocated to all Autonomous Databases.
- Reserved CPUs: CPUs reserved for auto-scaling, failover, and life-cycle management of empty Autonomous Container Databases.
- Reclaimable CPUs: CPUs that can be reclaimed after Autonomous Databases are terminated or scaled down.
Let’s look at the resource usage tracking enhancements that allow you to better track your CPU usage across different OCI console views.
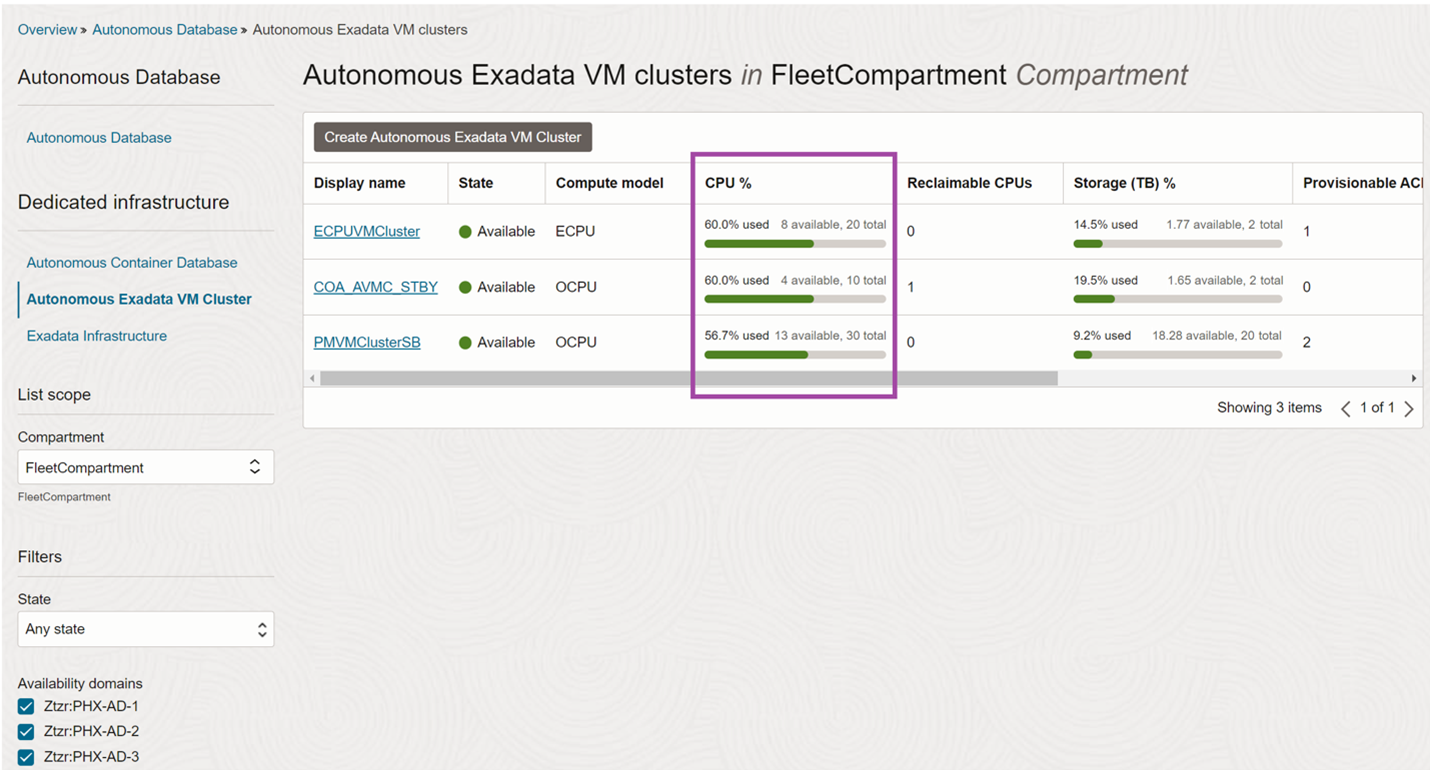
Autonomous Exadata VM Cluster list view
Navigate to “Navigation Menu >> Oracle Database >> Autonomous Dedicated Infrastructure >> Autonomous Exadata VM Cluster” and the list view will show the Used CPU percentage along with Available CPU and Total CPU as a color-coded bar chart. The Bar chart shows green for usage less than 70%, yellow for 70-90% and red for above 90%.
Autonomous Exadata VM Cluster details page
Select the Autonomous Exadata VM Cluster in the list view to open the details page. The resource allocation section will show the same color-coded bar chart for CPU usage.
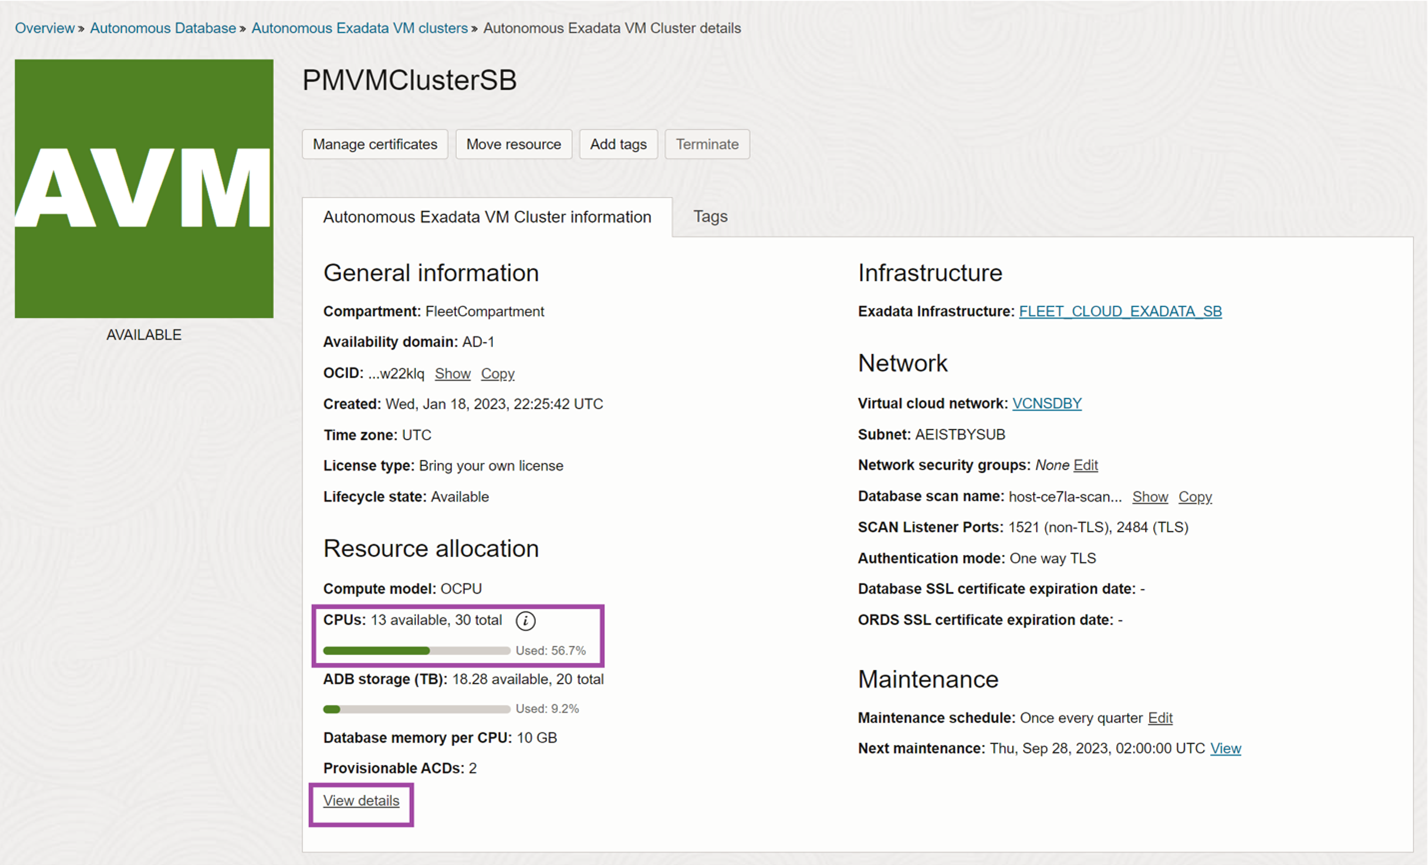
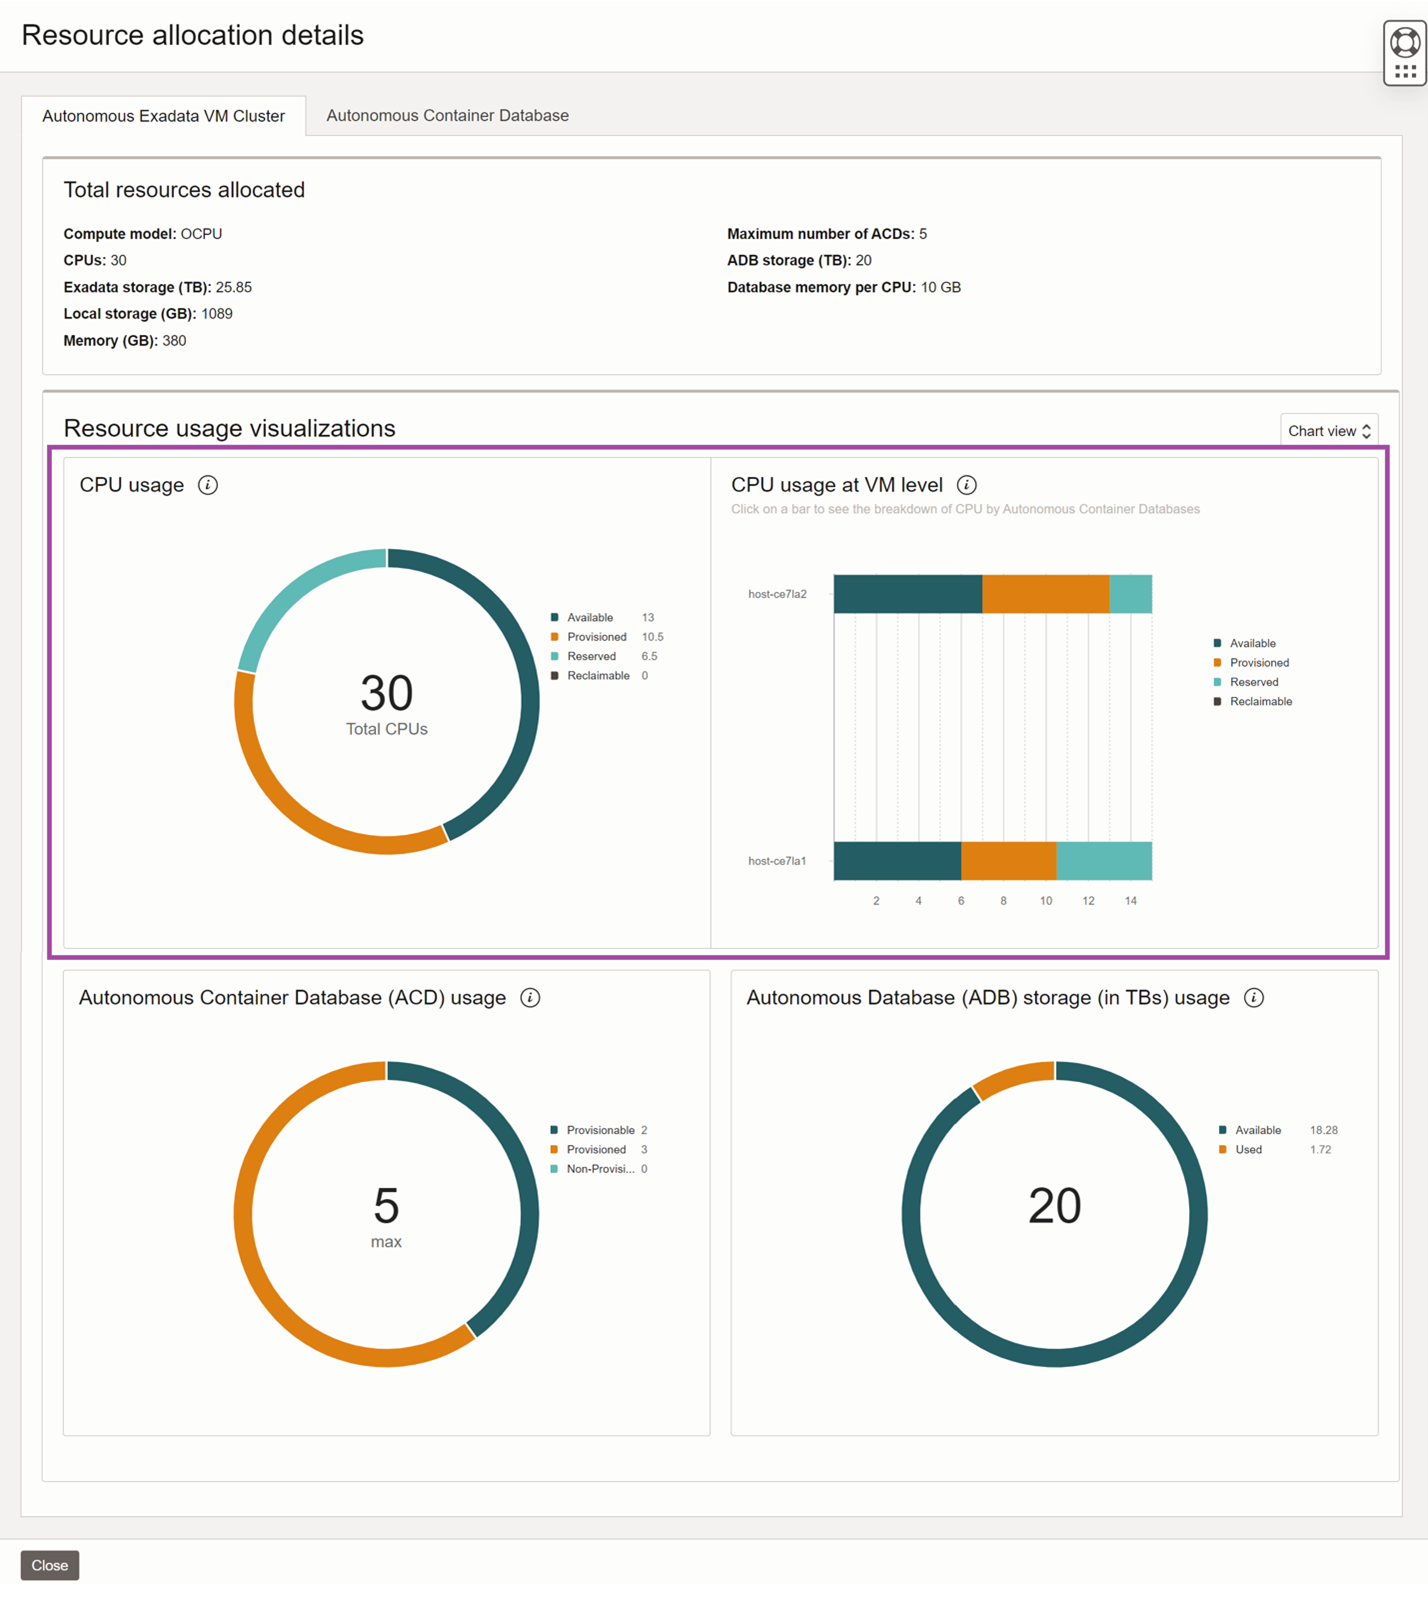
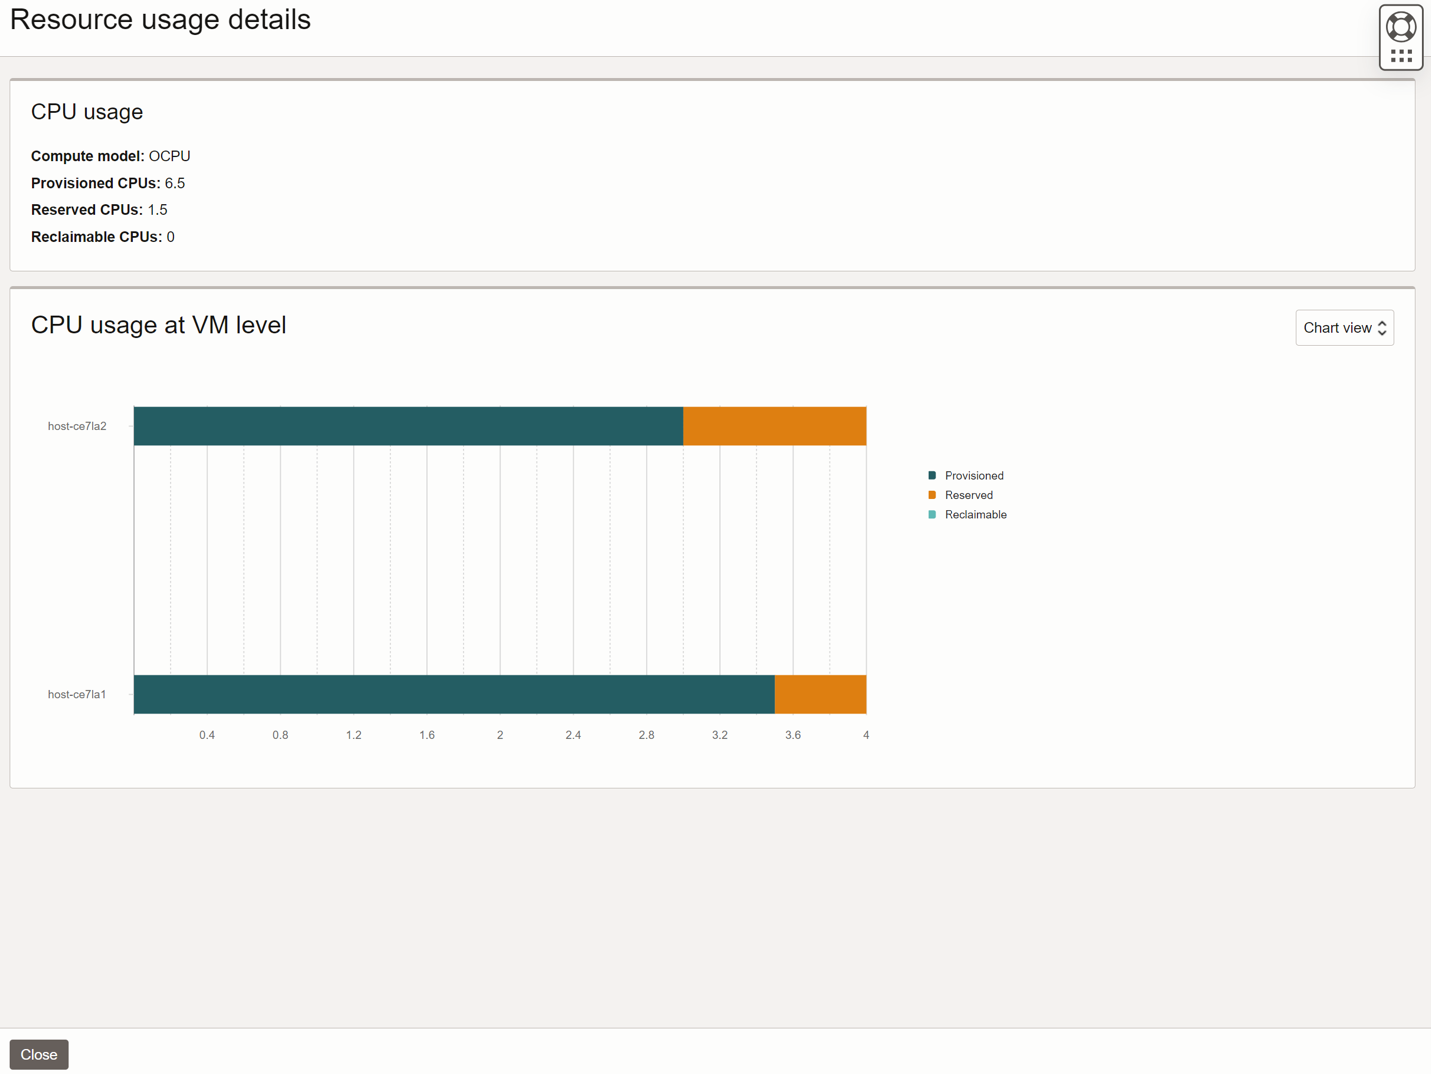
Autonomous Exadata VM Cluster resource usage advanced view
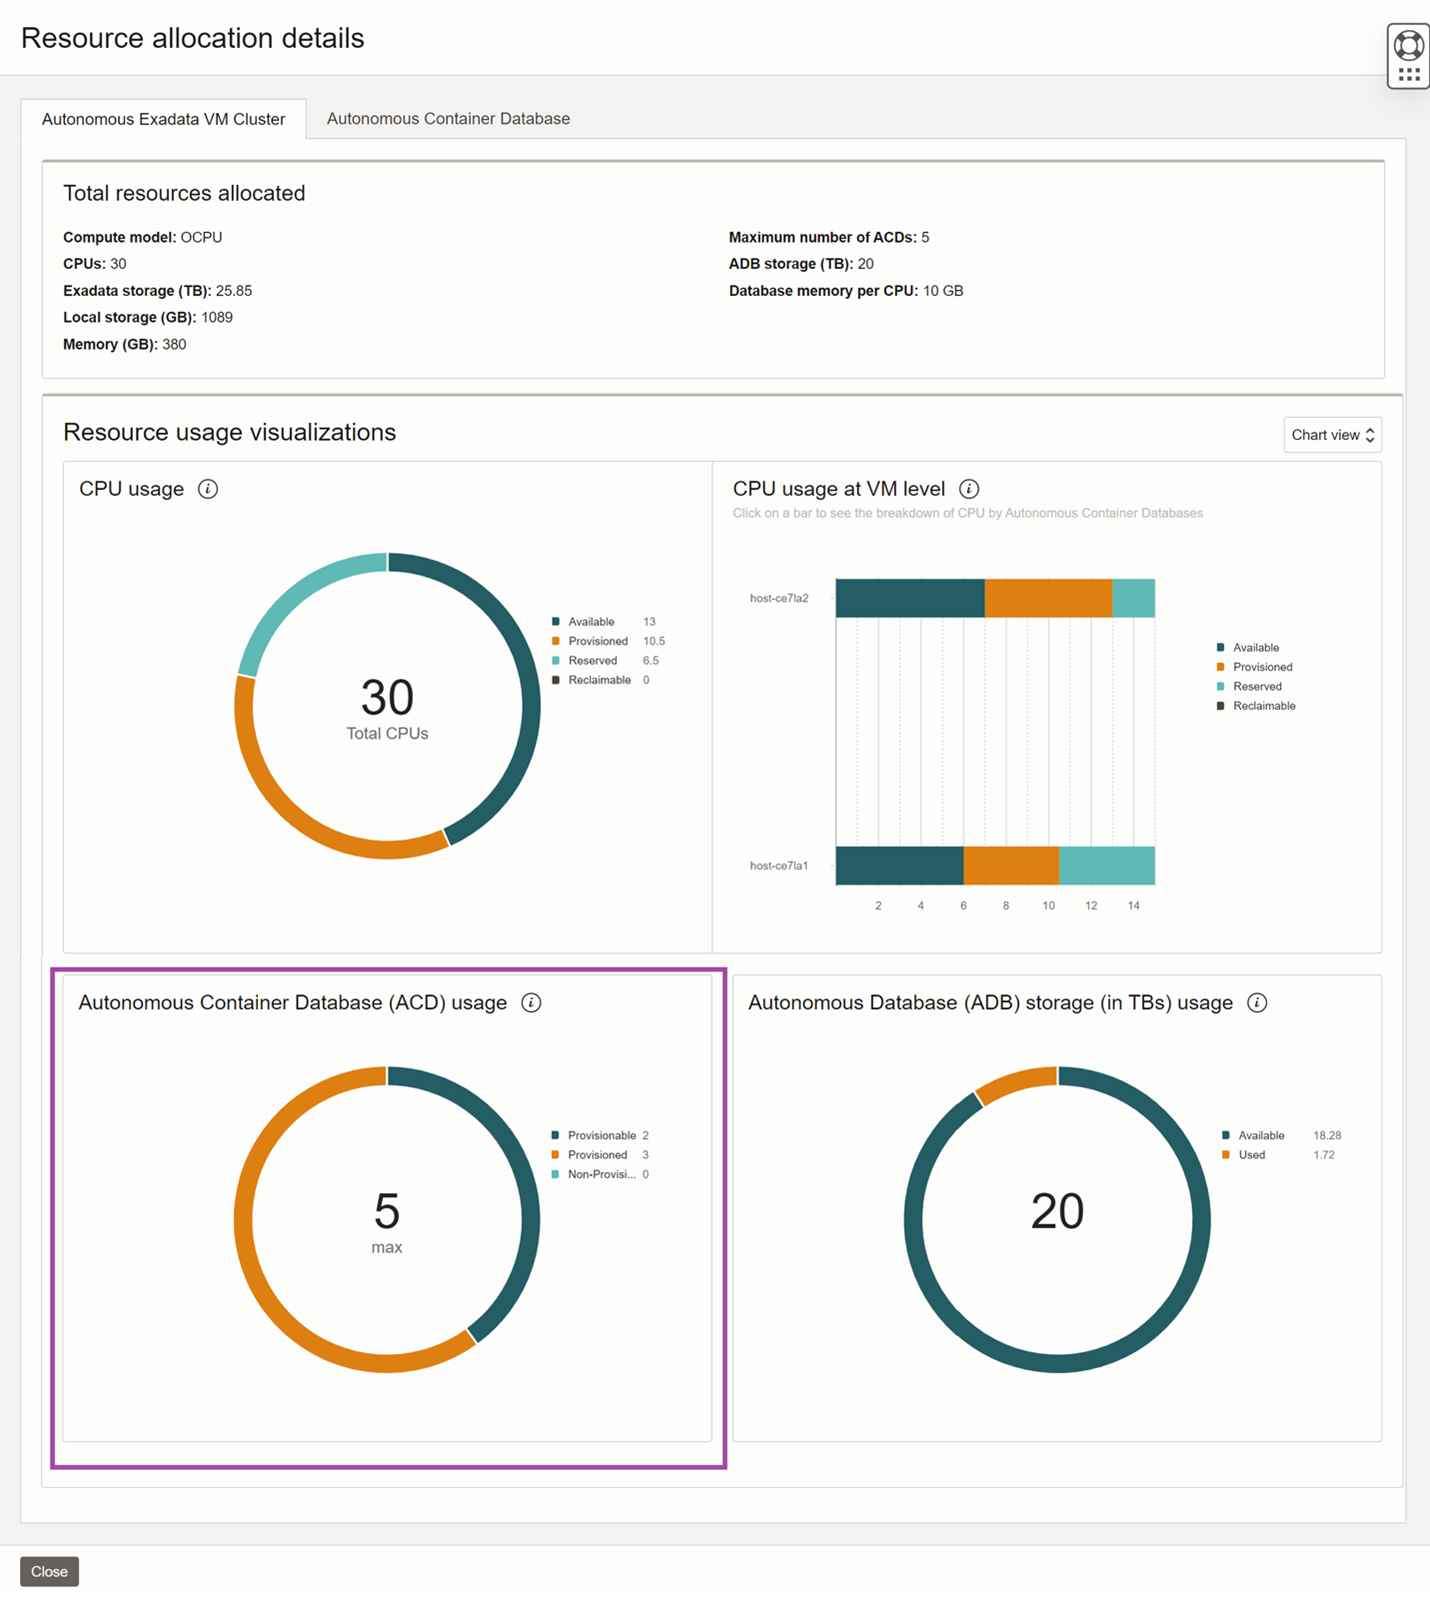
Select the “View details” button to get the resource usage advanced view. CPU section is broken down into two charts. The doughnut chart shows the breakdown of all the CPU components for the Autonomous Exadata VM Cluster. The bar chart on the right gives the breakdown of all the CPU components for each Autonomous Virtual Machine. This view helps you understand which Autonomous Exadata VM Clusters have excess reserved or reclaimable CPUs and take necessary action to optimize capacity utilization.
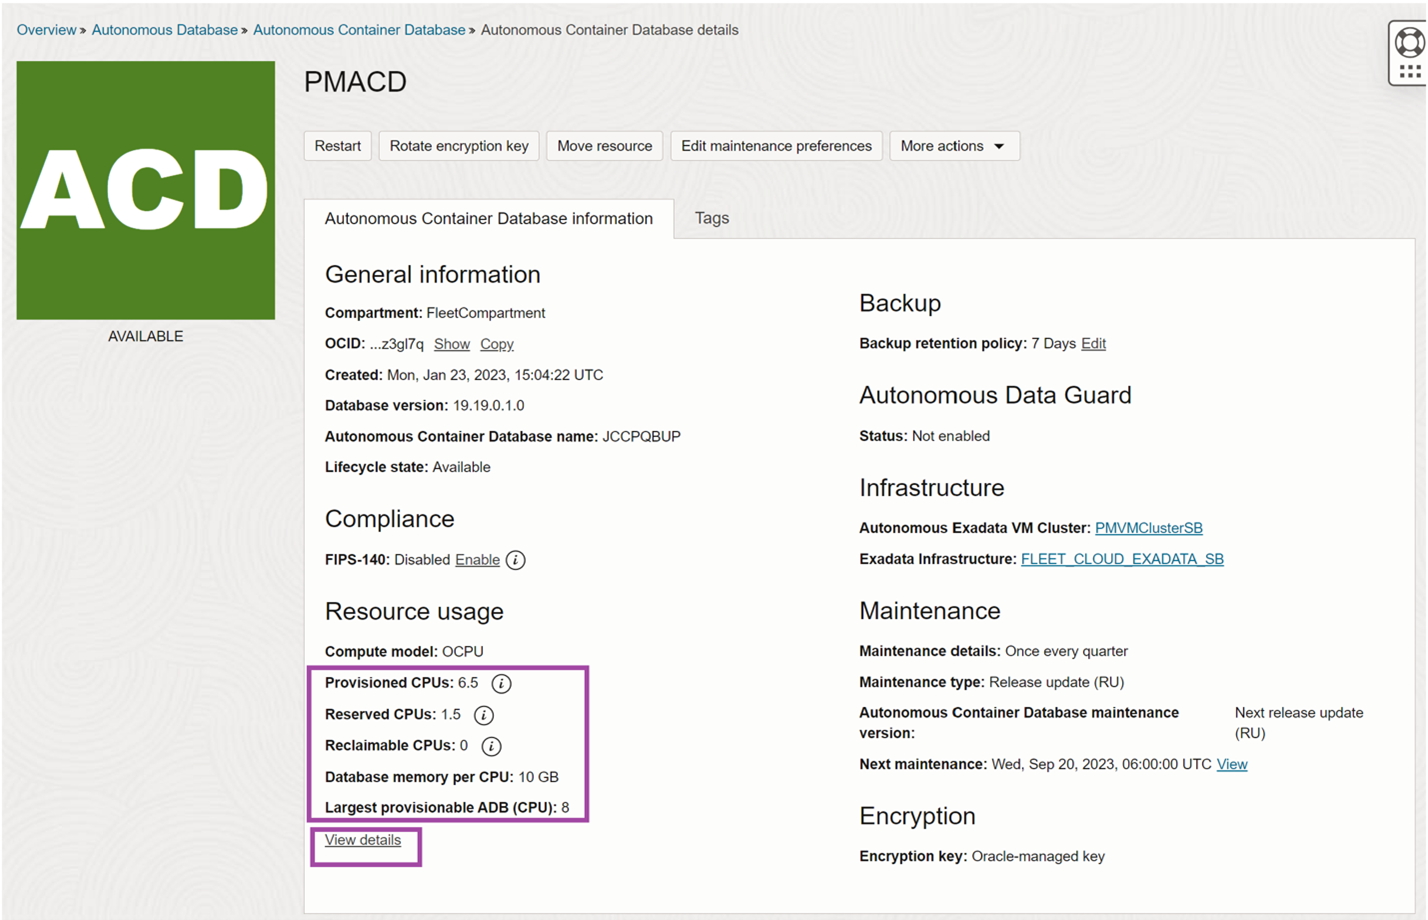
Autonomous Container Database details view
The Autonomous Container Database details page will also show all the CPU components in the Resource allocation section. “View Details” will show the resource usage advanced view.
Autonomous Container Database resource usage advanced view
The advanced view will show the breakdown of each CPU component across all the VMs in graphical format.
Enhanced Autonomous Container Database Usage Tracking
Enhanced resource management also extends to the Autonomous Container Databases within an Autonomous Exadata VM Cluster. These metrics allow users to effectively manage their ACDs and optimize resource allocation based on their needs:
- Maximum Number of ACDs: The maximum number of ACDs a user can create in a cluster.
- Provisionable ACDs: The number of ACDs that can be created within the cluster.
- Provisioned ACDs: The number of ACDs that have been created within the cluster.
- Non-Provisionable ACDs: ACDs that cannot be created due to a shortage of available CPUs in the cluster.
Autonomous Database service allows you to set the maximum number of Autonomous Container Databases you want to create in your Autonomous Exadata VM Cluster and based on this value the service will reserve the local storage needed. You need local storage and a minimum of two OCPUs per VM to create an Autonomous Container Database. While the local storage on the Autonomous Exadata VM Cluster is reserved for your Autonomous Container Databases, the CPU is not. If you use all your available CPUs to create Autonomous Databases, then you will not be able to create additional Autonomous Container Databases in that cluster.
You can track the Autonomous Container Database usage on the Autonomous Exadata VM Cluster resource usage advanced view. The doughnut chart shows the maximum value at the center and the remaining components on the outer ring.
Enhanced Database Storage insights
Understanding database storage is crucial for effective resource management. Enhanced Resource Usage Tracking is now expanded to provide these metrics:
- Exadata Storage (in TBs): The total storage allocated to an Autonomous Exadata VM Cluster, including user data storage, recovery area, and internal database service storage.
- Autonomous Database Storage (in TBs): Data storage specifically allocated for Autonomous Databases within the Autonomous Exadata VM Cluster, including user data storage and the recovery area.
- Available Database Storage (in TBs): The storage space available for creating or scaling up Autonomous Databases.
- Used Database Storage (in TBs): The storage currently in use by Autonomous Databases within the Autonomous Exadata VM Cluster.
These metrics offer a comprehensive view of how storage resources are allocated and utilized. It’s important to note that ADB-D allows storage overprovisioning, allowing the sum of allocated storage for all Autonomous Databases in the cluster to exceed the total allocated database storage for the Autonomous Exadata VM Cluster. This flexibility enables efficient database management. Let’s look at how to tap into this.
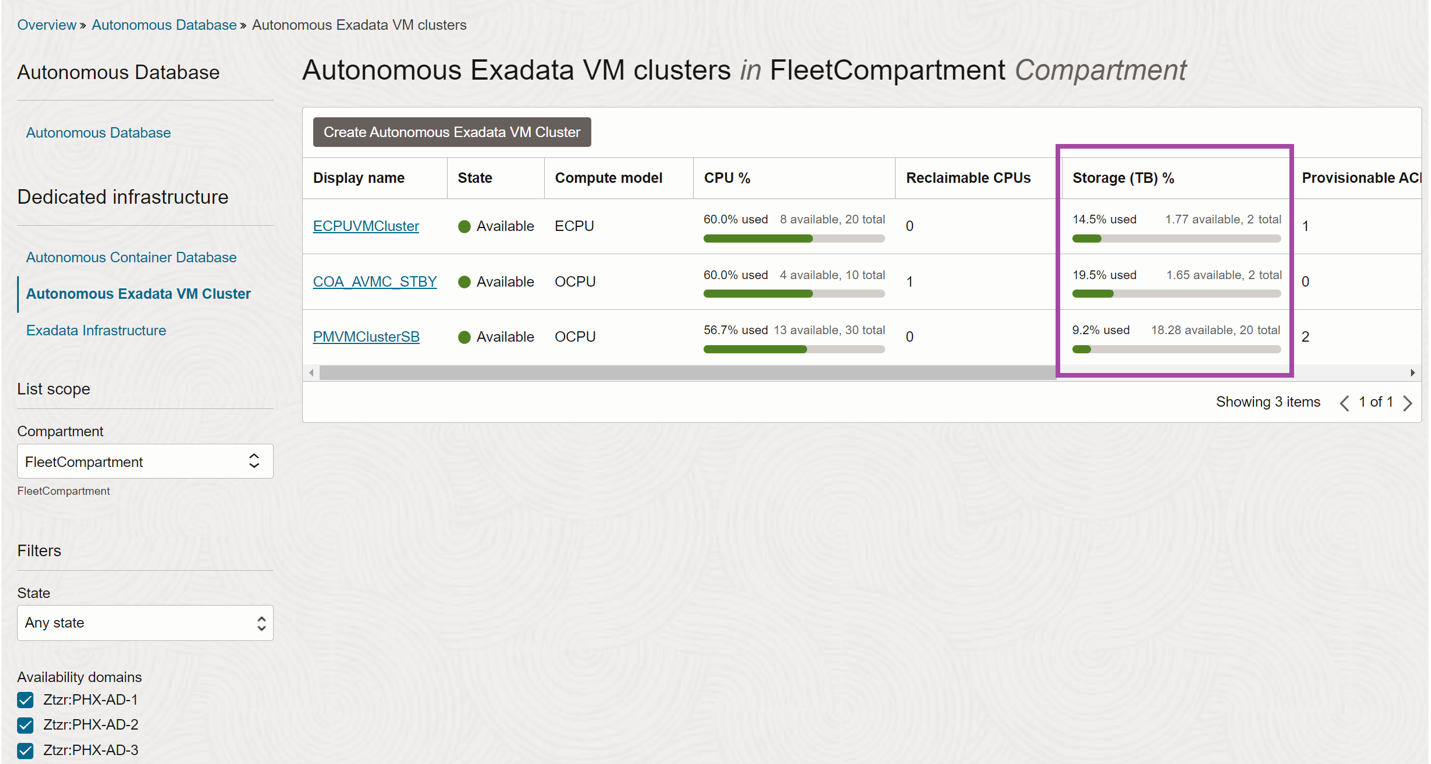
Autonomous Exadata VM Cluster list view
Navigate to “Navigation Menu >> Oracle Database >> Autonomous Dedicated Infrastructure >> Autonomous Exadata VM Cluster” and the list view will show the Used Database Storage percentage along with Available Database Storage and Total Database Storage as a color-coded bar chart. The Bar chart shows green for usage less than 70%, yellow for 70-90% and red for above 90%.
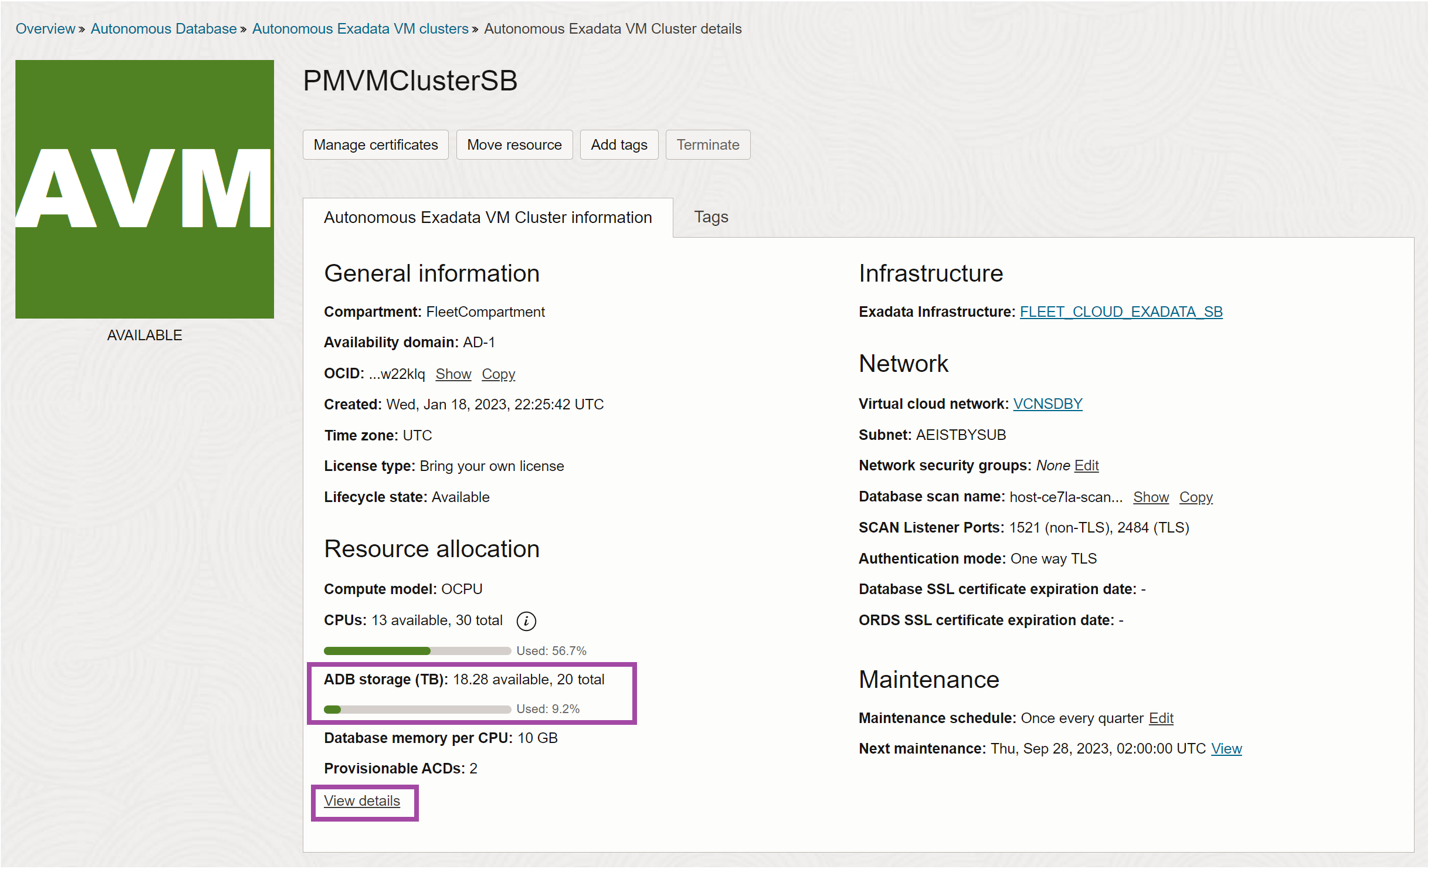
Autonomous Exadata VM Cluster details page
Select the Autonomous Exadata VM Cluster in the list view to open the details page. The resource allocation section will show the same color-coded bar chart for Database Storage.
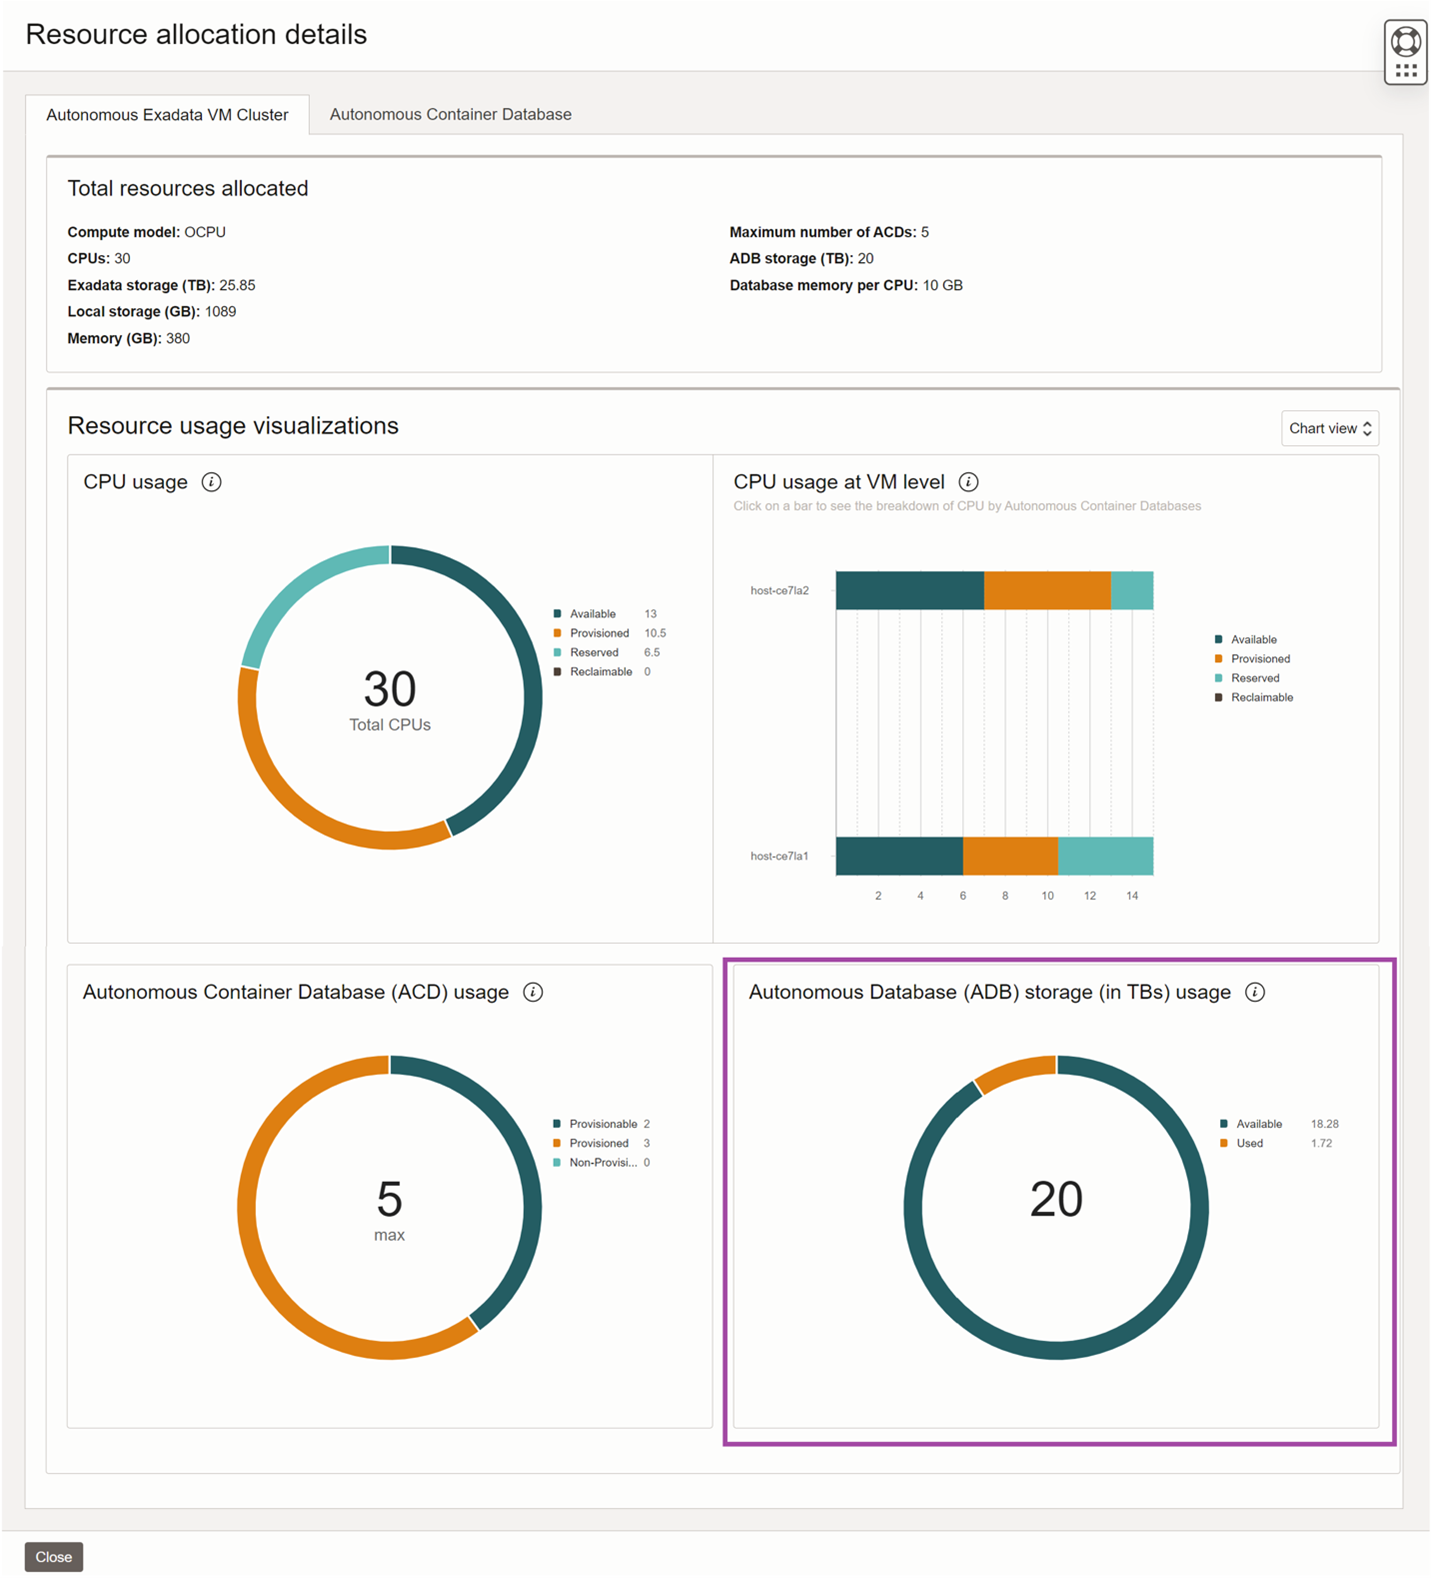
Autonomous Exadata VM Cluster resource usage advanced view
Select the “View details” button to get the resource usage advanced view. The advanced view gives you info about all the resources on the cluster in the graphical or tabular format. Database storage is shown as a doughnut chart with the total Autonomous Database Storage in the center. The rings are composed of available and used database storage.
This covers all the resource usage tracking enhancements in this release. However, it doesn’t end here – we are constantly working on enhancing user experience and there is a lot to come. Keep an eye on this space for all future announcements!
Resources
Summary
Autonomous Database service performs automated resource management to support complex features such as compute auto-scaling to optimize cost and RAC and Autonomous Data Guard to protect against issues ranging from node failures to regional outages. However, not all aspects of resource management are exposed to the customers, and this may result in a sub-optimal understanding of how some of the features work or how the Exadata resources are utilized. Enhanced Resource Usage Tracking exposes how advanced features make use of your resources and allows you to optimize your capacity utilization even further. Knowing how your resources are utilized is the basic input needed for efficient capacity planning. Learn more about Autonomous Database here.