Oracle Autonomous Health Framework (AHF) is released with new features monthly, so as we come to the end of 2024, we wanted to share a summary of all new features throughout this year.
AHF empowers customers to maximize application resilience, performance, and security using cutting-edge AI to prevent and resolve issues.
It’s available at no extra cost as part of your existing software support agreement.
Here’s a recap of new features AHF delivered during 2024
The AHF team has focused on helping DBAs and Fleet Admins to:
DBA experience
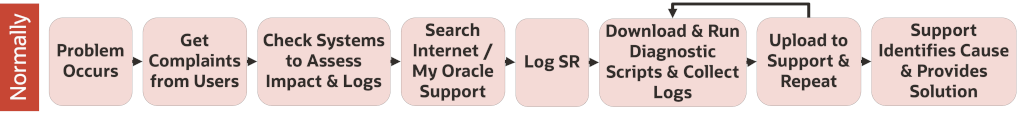
Before AHF, a typical DBA experience used to look like this:
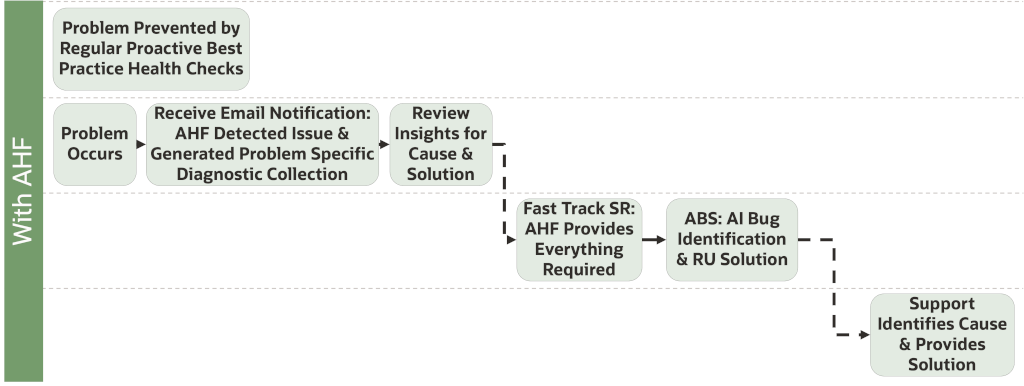
Here’s what that experience is like now with AHF:
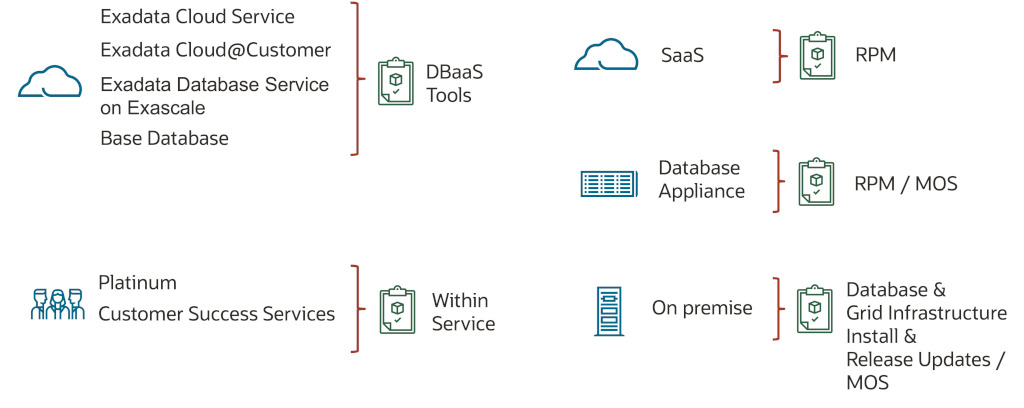
AHF is deployed everywhere and easily upgradable.
Preventing critical problems
AHF includes Exachk for Exadata and Orachk for all other systems. Customers love AHF for health checks because, in their own words it:
“Saves time and effort of manually capturing information”
“Helps to stay on top of critical issues and lets you know before they become outages”
Each month during 2024 AHF has released new best practice health checks, which enable DBAs to proactively prevent problems before they occur. AHF segments these health checks based on the following levels:
- Critical – severe impact – should be fixed ASAP
- Failure – risk to availability, integrity or disaster recovery – should be fixed within the next quarter
- Warning – potential to improve system, but does not pose a risk to availability, integrity or disaster recovery – should be fixed when possible
- Info – useful proactive updates or information – fix if relevant
Explore all checks in detail via the Health Check Catalogs:
Security health checking
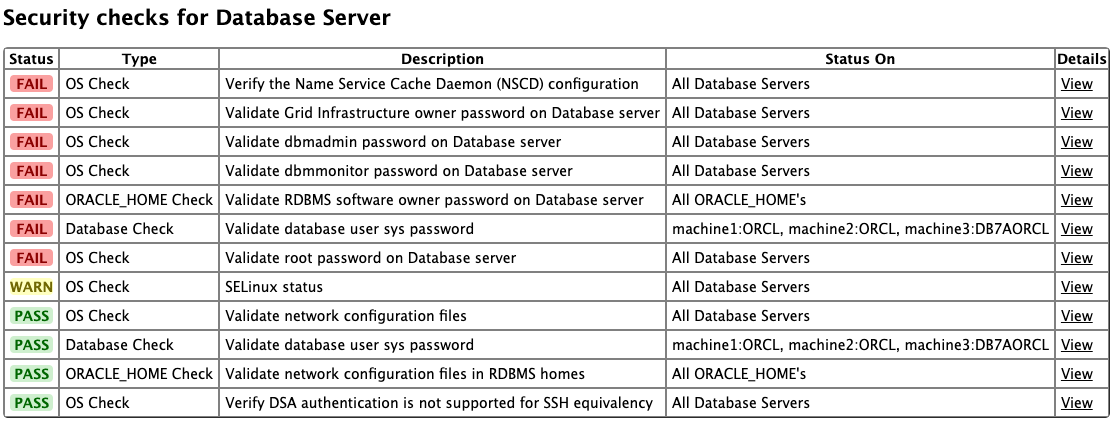
The Orachk and Exachk reports added a new Security section, grouping together all best practice security related checks.
In addition, Database Security Assessment (DBSAT) was upgraded to version 3.1.
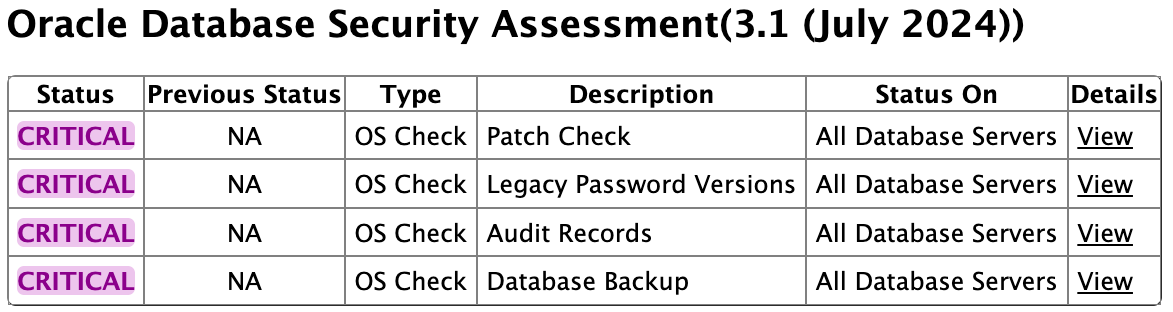
Oracle Database Security Assessment Tool (DBSAT) provides prioritized recommendations on how to mitigate identified security risks or gaps within Oracle Databases. DBSAT profiles the security and compliance posture of databases by evaluating the current state, including configuration, discovering sensitive data, and more.
To generate an AHF best practice report including security recommendations, run:
ahfctl compliance -profile securityTo generate an AHF best practice report including security recommendations as well as complete health of the system run:
ahfctl compliance -includeprofile security
Platinum Monitoring and Patching
The Platinum service, which relies on AHF for Exadata configuration data, provides fault monitoring and patching for Exadata customers.
AHF added the following capabilities on Exadata dom0, storage servers and switches:
- Auto-upgrade
- Automatic best practice checking
- Automatic diagnostic collections
- Auto-upload diagnostic collections to SRs
This enables the Platinum fault detection and patching service to use component relationships. When it detects a fault from dom0, it can determine which database nodes it impacts. Patch planning for virtualized racks understands component relationships, allowing it to cut downtime.
Best practice health checks at the fleet level
AHF Fleet Insights enables easy enforcement of best practices across entire database fleets, regardless of size.
Begin by installing AHF Fleet Insights on a separate server with its own database. Then, register AHF on each cluster once to enable diagnostic data collection.
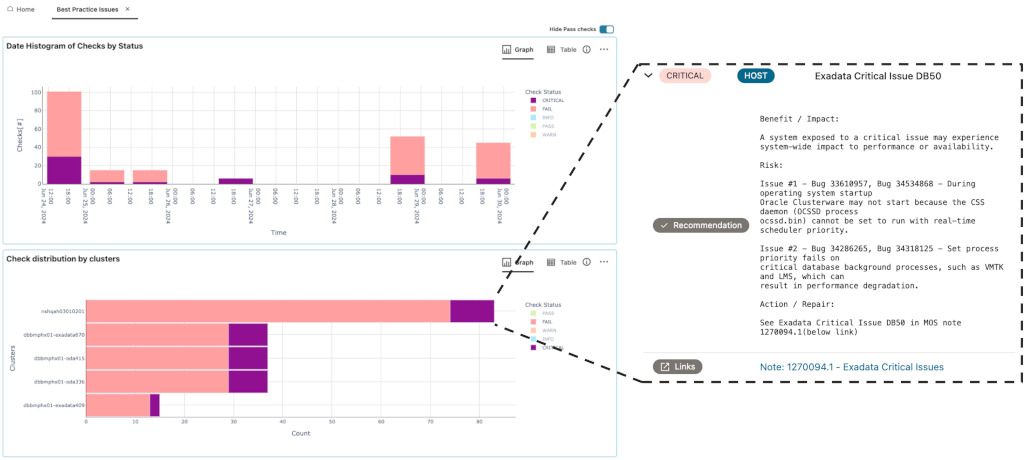
AHF Fleet Insights provides a holistic view of your entire database fleet, enabling quick identification of critical check failures. Start by analyzing deviations from normal or majority behavior, then investigate the root cause and recommended resolution.
Rinse and repeat to gradually reduce the risk and improve resilience across your whole fleet.
Watch this short demo video to see how to review health checks for a fleet of databases
Resolve issues
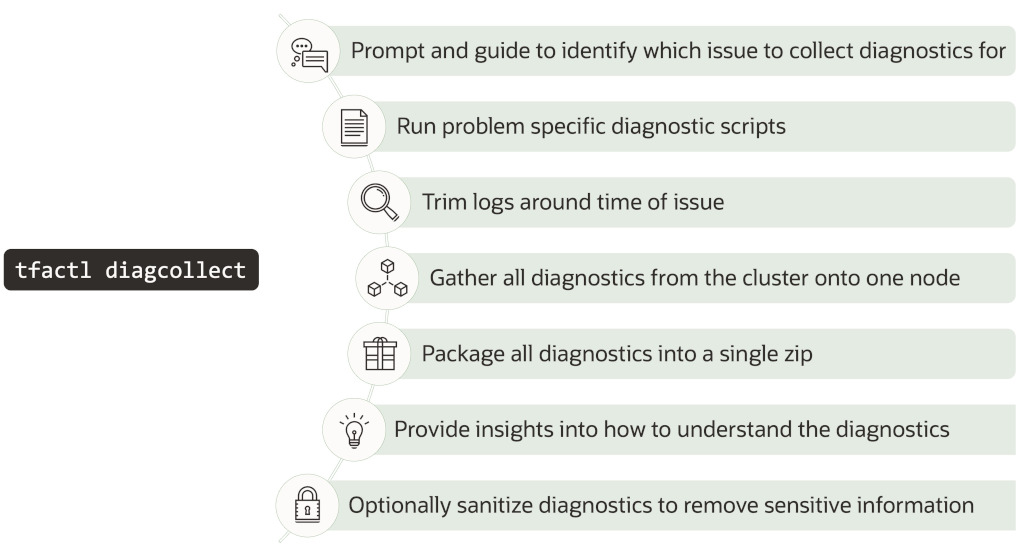
AHF makes it easy to generate problem specific diagnostic collections, with everything needed to resolve the root cause.
As customers say in their own words:
“Get accurate insight on the system/DB we are running and see what happened in the past and find the root cause”
“Simplifies data capture”
Collections can be generated with a simple, single command:
However, the best way to run the Autonomous Health Framework is……Autonomously.
By default, AHF monitors for problems and automatically captures relevant diagnostic data.
A one-time setup using the below command ensures that email notifications are sent whenever problems are detected. Each email includes details on where to find the automatic diagnostic collection.
ahf configuration set --type smtp --all
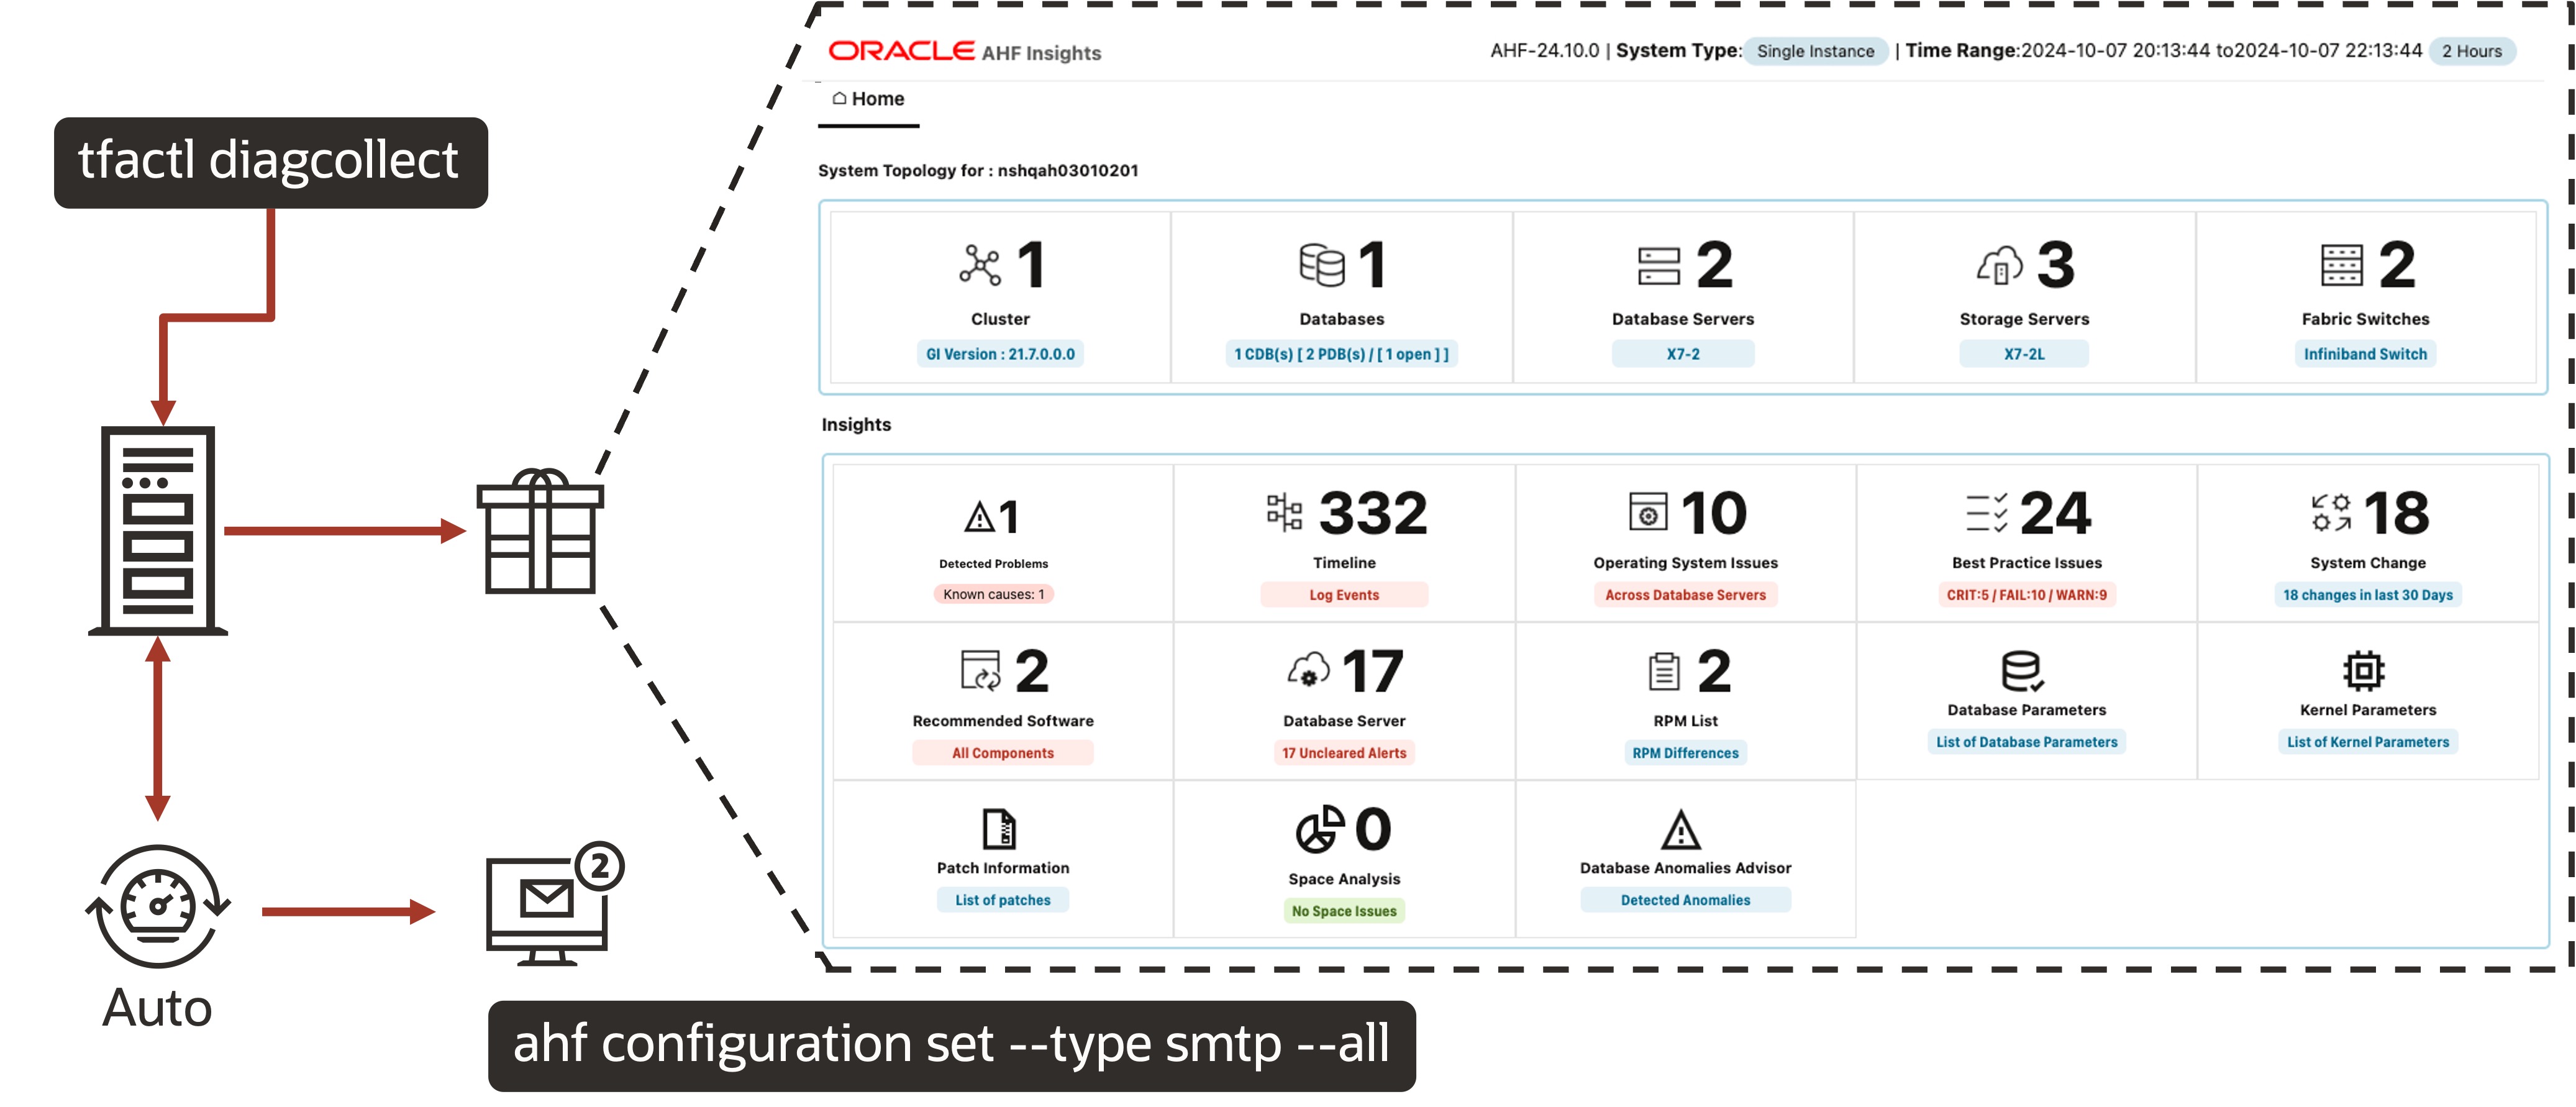
Every diagnostic collection now contains AHF Insights (located in the *insights*.zip within the collection).
AHF Insights provides a comprehensive system overview, empowering customers to resolve database problems independently.
Single page problem summary with solution
AHF Insights now has a Detected Problems panel, drilling down into this shows a single page summary of the problem detected. Each Problem Summary explains what happened and why, along with evidence and simple to follow resolutions steps.
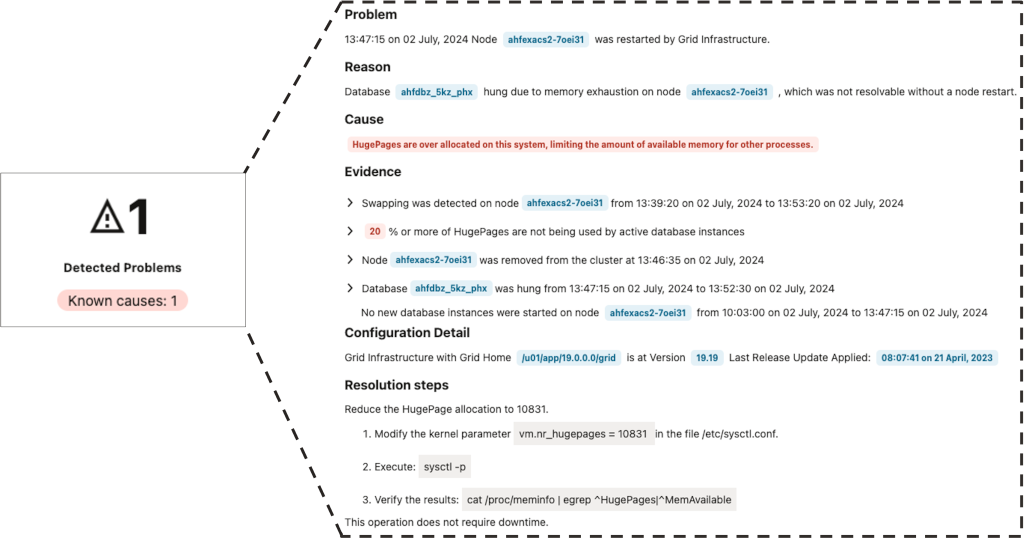
Expand evidence to view charts or log details that confirm the cause.
AHF will now automatically detect and provide a single page problem summary for Node evictions, instance evictions and database slow performance caused by:
Poor configuration
- Jumbo frames
- UDP buffers
- IP reassembly buffer
- HugePages
- NIC buffer size
- Insufficient DBWR processes
- Message buffers in the network interfaces too small
- DB Writer
- PGA limit
Resource bottlenecks:
- High CPU Steal
- NIC unavailable
- Critical background processes stuck in D state
- Increasing memory usage of GI processes
- Increasing memory usage of DB processes
- Increasing memory usage of non-db processes
- Increasing memory by new databases
- DB Recovery Read IO
- Latch contention
- Archiver blocked
Resource errors:
- IP reassembly failures
- Multipath Disk Failures
- IO errors due to insufficient storage space
- Generic IO errors
Timeline
If the problem is not one of the many known signatures AHF has yet, then AHF Insights still surfaces all diagnostics to help identify it. The first place to start is the Timeline panel.
The Timeline gives a quick visual, showing the important events, where they occurred and their order. This helps to trace back from symptoms to identify the root cause events.
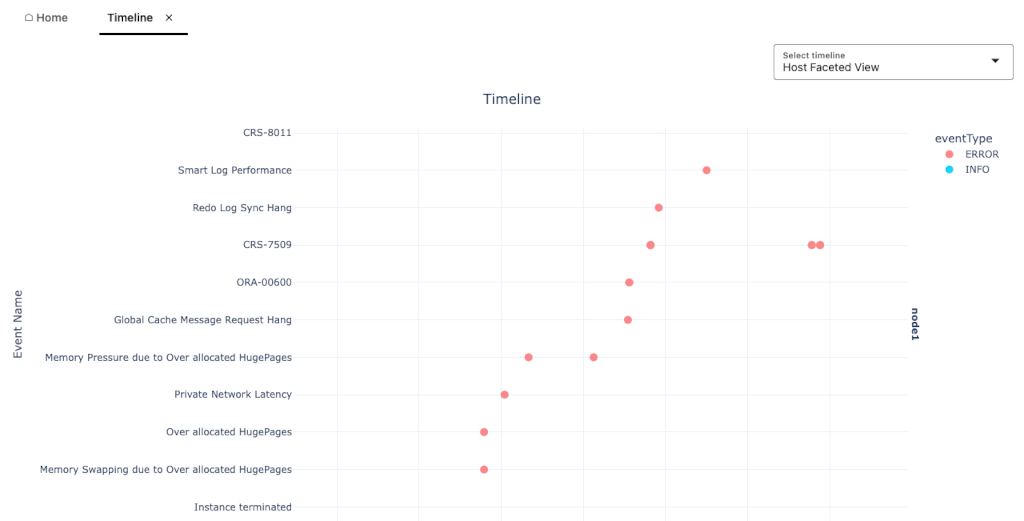
Additional Timeline views have been added, allowing you to view events by host, database or component. This helps to provide an understanding of how issues impact specific components of the Database stack, making it faster and easier to spot where the problems are.
Hovering over the events gives detailed information on the event and clicking on it then opens any relevant log entries in the Insights log file viewer.
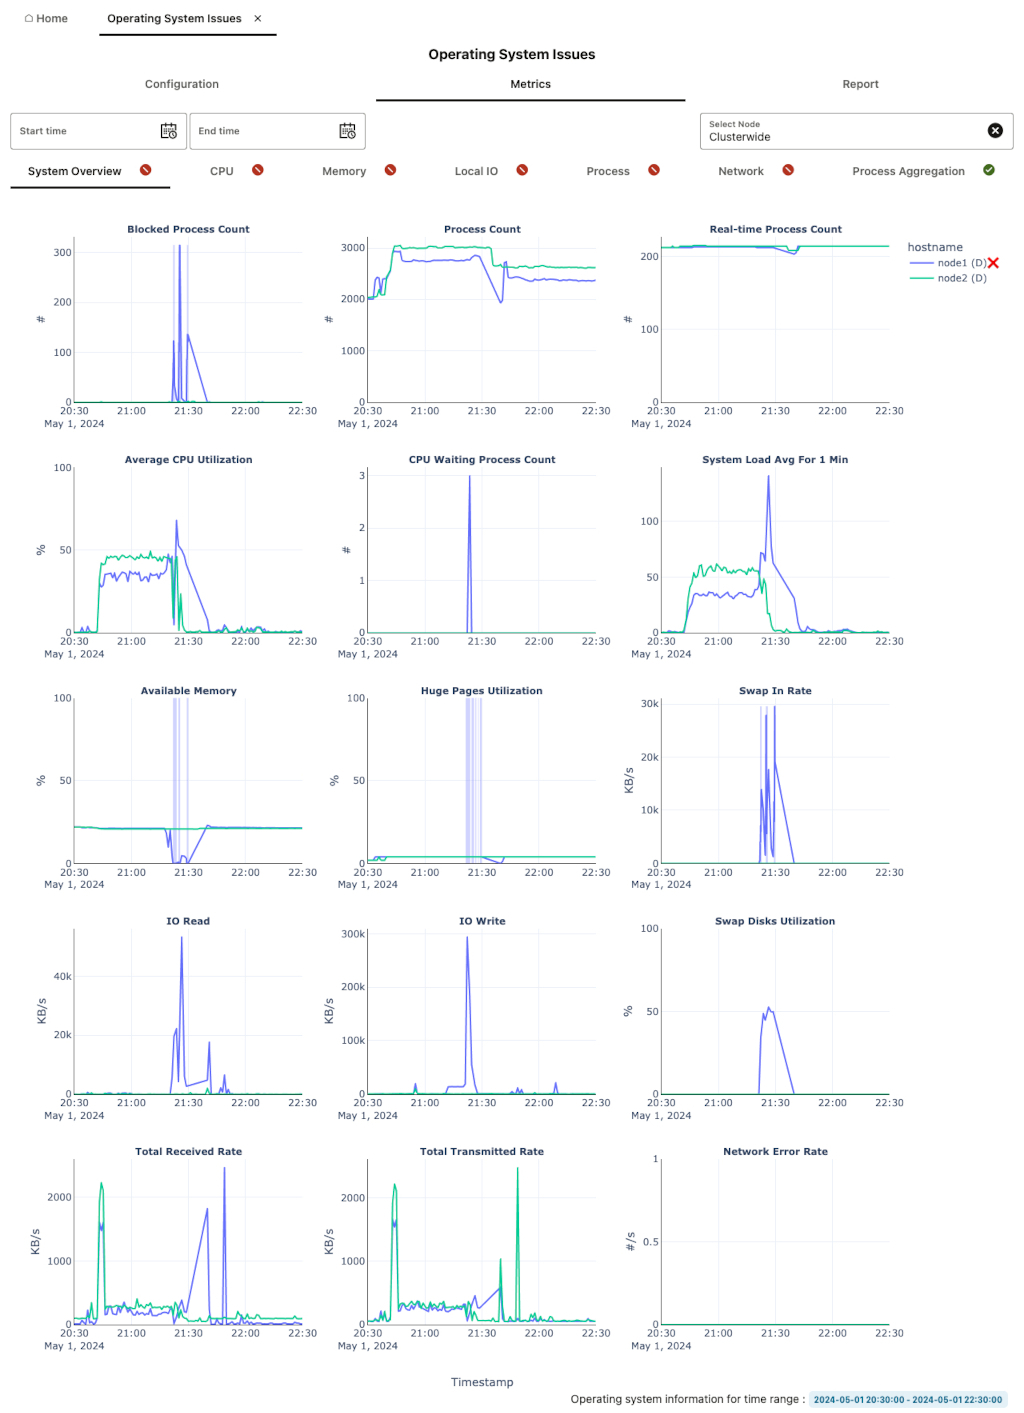
Operating System Issues
The next panel to help identify the cause of problems is the Operating System Issues.
This shows OS configuration, a multitude of metrics in chart form, indicating which are problematic and a summary report of all OS issues.
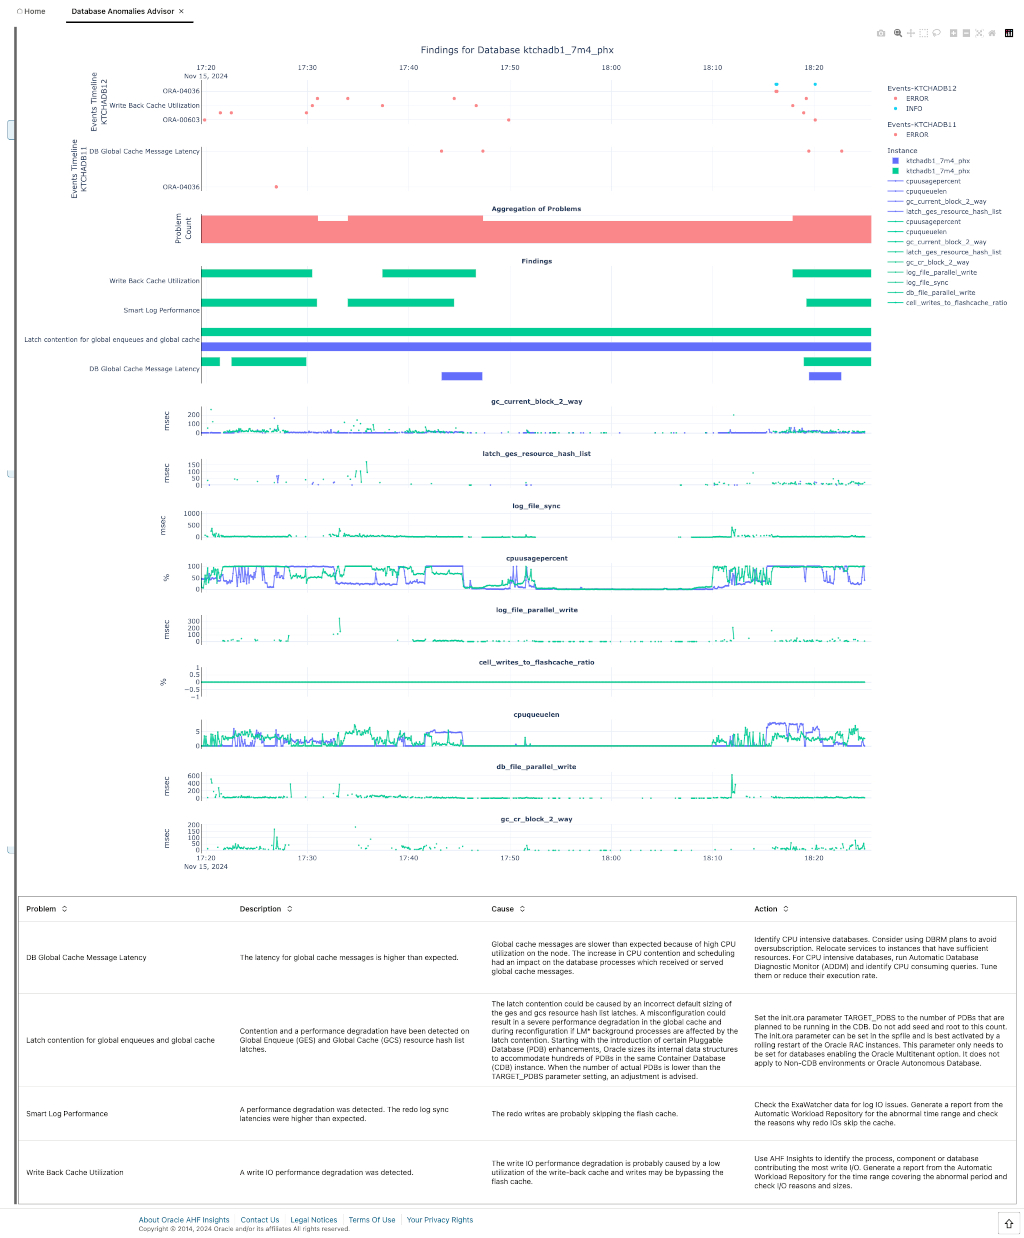
Database Anomalies Advisor
The Database Anomalies Advisor panel surfaces the results of AI detected unusual database events.
Drilling into here shows all anomalies AHF detected in the database, along with a description of the problem, explanation of the cause and recommended action.
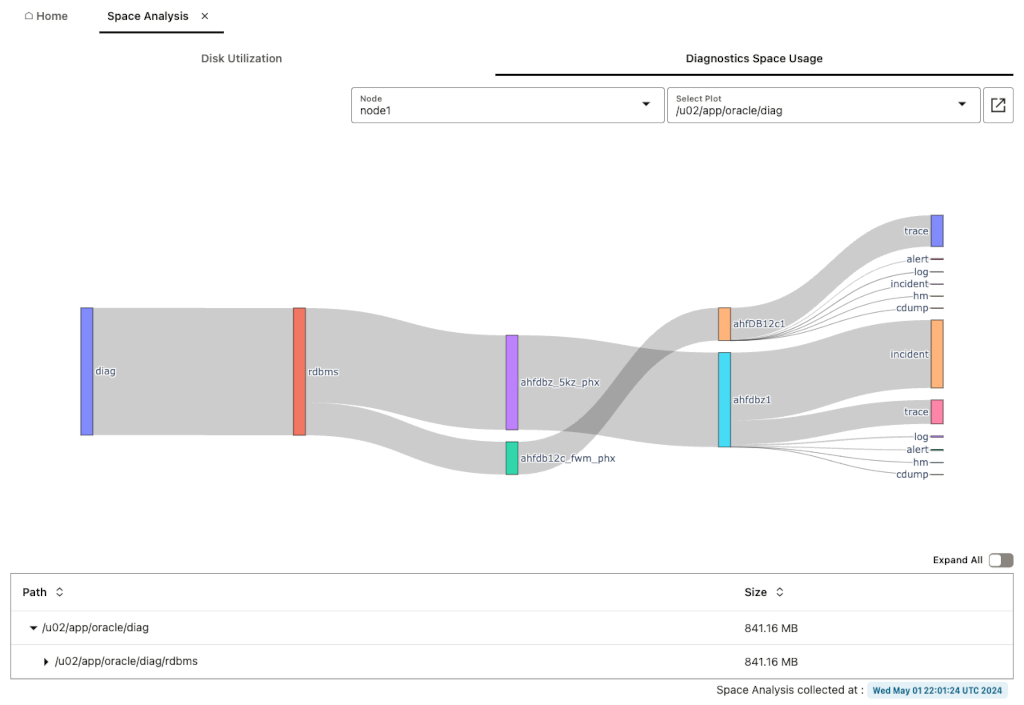
Space usage
The new space usage panel highlights where disk space is being used.

The Disk Utilization shows at a glance all disk space usage:
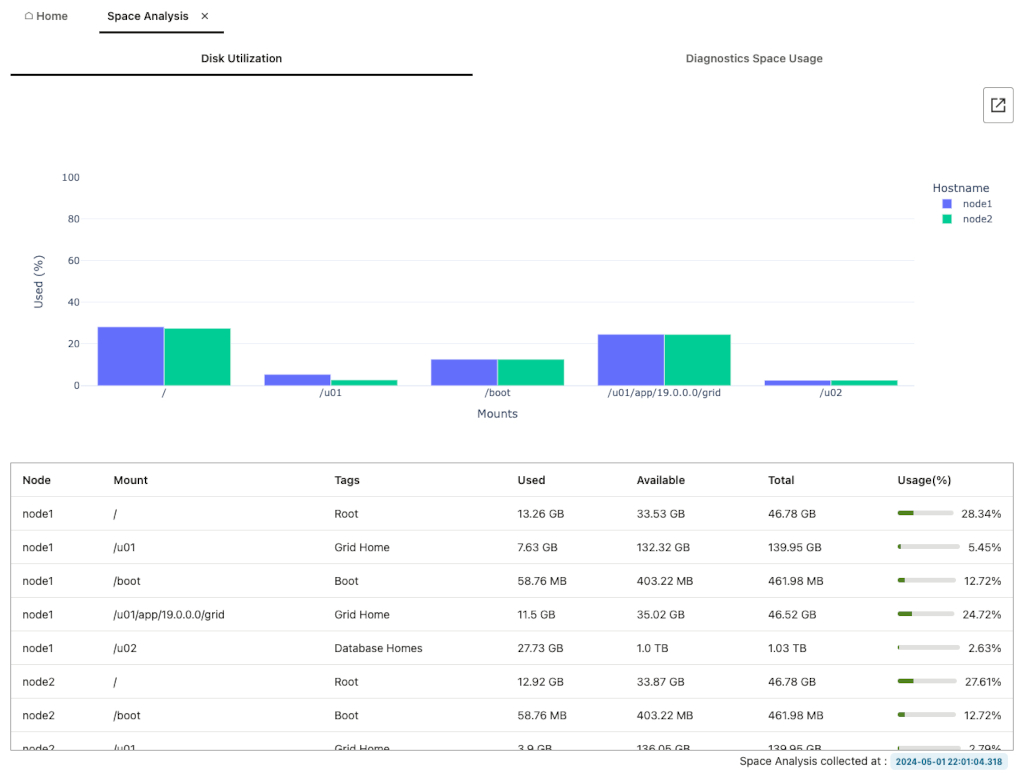
Then the Diagnostics Space Usage section breaks down all Database and Grid Infrastructure diagnostic destination directories, so you can easily identify any anomalies.
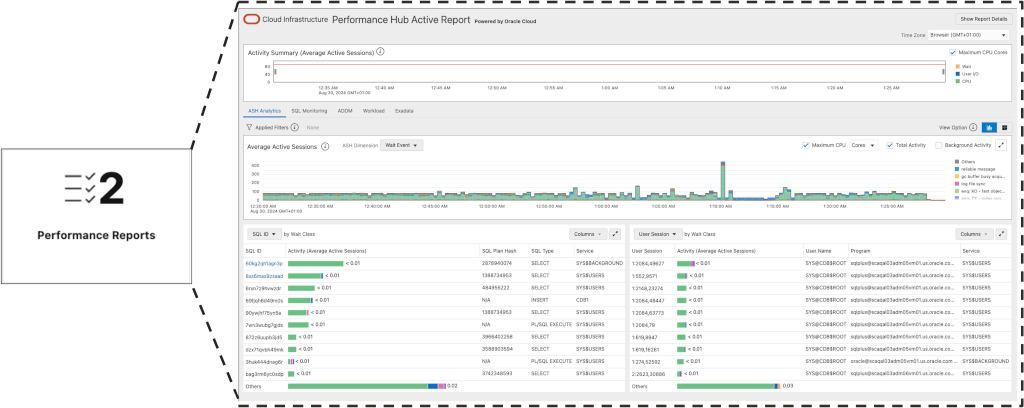
Performance Tuning with AHF
To further help in tuning database performance, Insights now contains a Performance Reports section, with both AWR and PerfHub reports.
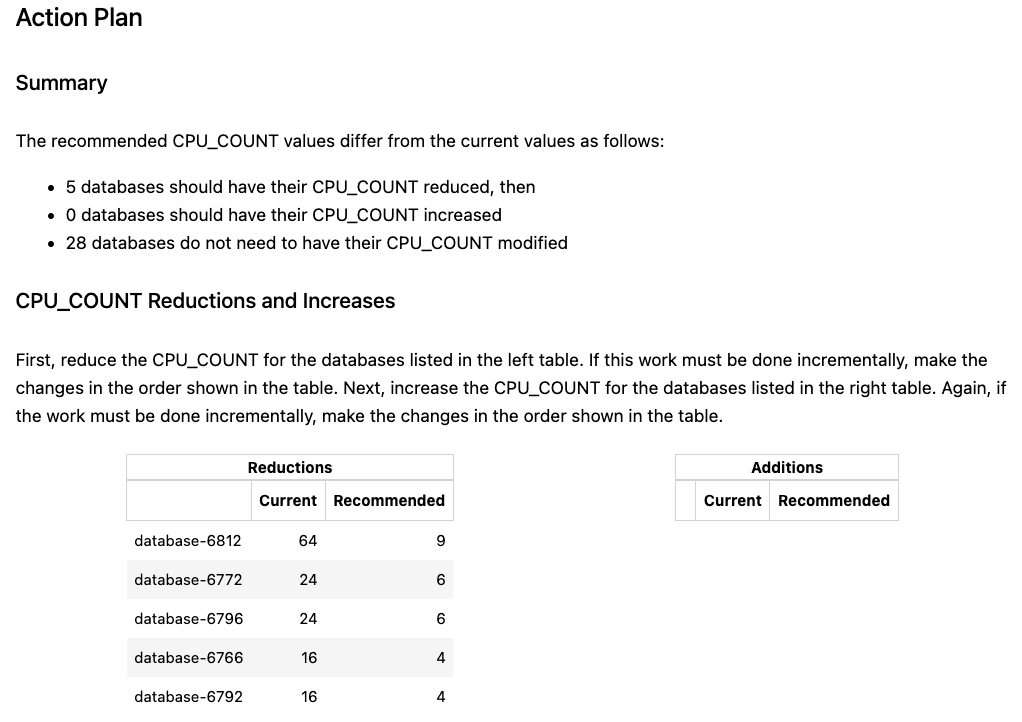
For over-subscription-related slow performance, DBAs, Cluster Admins, and Fleet Admins can leverage AHF Balance in addition to AHF Insights.
AHF Balance uses AI to recommend optimal Database CPU_COUNT values, improving performance while maximizing hardware resource utilization.
The new --limit-db-changes option restricts the number of databases affected by CPU_COUNT recommendations, enabling gradual tuning adjustments.
For example:
To get fleet performance tuning recommendations use:
ahf analysis create --type impact --scope fleet --name <fleet-name> --limit-db-changes <num_dbs>The fleet report limits the number of recommended database changes per cluster.
To get cluster performance tuning recommendations use:
ahf analysis create --type impact --scope cluster --name <fleet-name> --limit-db-changes <num_dbs>
You can learn more about how to use AHF for Oracle database performance tuning in this video:
Resolving issues from a fleet level
AHF Fleet Insights enables Database Fleet Admins to centrally view and analyze issues, identifying and grouping variations.
AHF Fleet Insights combines all diagnostic collections from AHF, making it simple to drill into detailed Insights like timelines and problem summaries with resolution details. You can get a fleet-wide understanding of events as they occur in the database stack.
Explore by topologies such as Exadata or cluster, or configurations such as software versions or hardware models. Database issues are surfaced to the home dashboard where you can then drill down to the detected problems panel in Insights. From here, gain visibility into the problem, cause, and resolution, along with all evidence to understand how that root cause was identified.
Example: Pinpointing problem root causes with AHF Fleet Insights
Understand configuration and database events
Many DBAs now run AHF Insights on a periodic basis, by configuring cron jobs to run:
ahf analysis create --type insightsTo help support this AHF Insights added support for both single instance systems and longer time ranges. The --last option can be added to specify the frequency, for example:
analysis create --type insights --last 12h
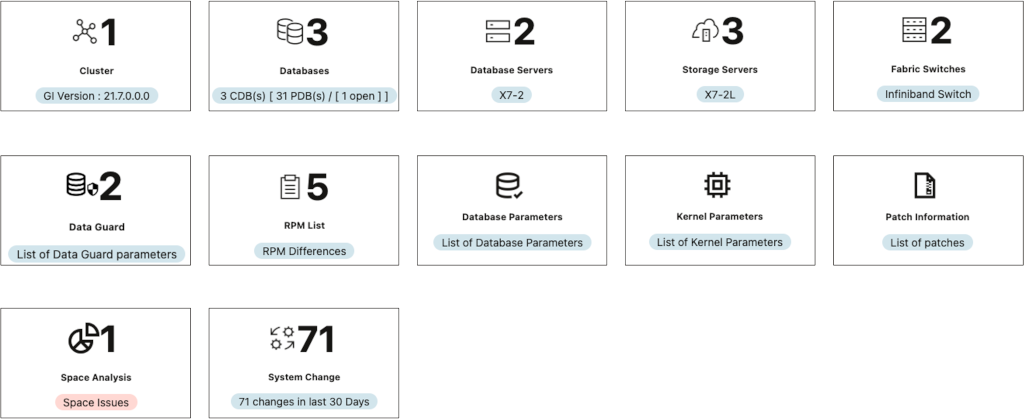
Insights contains a wide selection of configuration related panels, as well as the Space Analysis panel mentioned above, the Data Guard panel is new this year.
Real-time Fleet-Wide Configuration Analysis
When Insights on it’s own is not enough, AHF Fleet Insights enables large-scale configuration analysis. It makes it easy to identify and resolve configuration discrepancies across your fleet. Configuration updates are processed in real-time, ensuring you always have the most current view of your fleet’s configuration.
See the below video example for how to explore Hardware, OS and Database versioning and configuration similarities and differences across the full fleet.
Analyze historical issue trends
AHF Fleet Insights extends beyond real-time monitoring, enabling Fleet Admins to analyze historical trends, identify areas for improvement, optimize performance, plan for future capacity, and manage costs effectively.
Historical data is stored for extended periods, preventing the loss of valuable diagnostic information.
Example: Analyzing historical database trends with AHF Fleet Insights.
We look forward to continuing the evolution of the Autonomous Health Framework in 2025.
Get started with Autonomous Health Framework today
To get started today download Oracle Autonomous Health Framework.
Get started with AHF Fleet Insights today
- Download: AHF Fleet Insights (Doc ID 3043060.1).
- Documentation: AHF Fleet Insights User Guide.