Use Oracle Machine Learning to display different charts and different looks for your SQL queries.
By Brendan Tierney
October 21, 2019
When working on data science and machine learning projects, most data scientists and analysts work with some kind of notebook, typically Jupiter- or Zeppelin-style notebooks. Oracle Machine Learning notebooks, however, support building out data science projects with SQL and support charting features.
Oracle Machine Learning can create a range of different charts and plots of your notebook data. It supports a range of built-in charting methods that use the data generated from running a SQL statement—no additional code needs to be written to create these charts.
Charts can be customized to present the results in different graphical ways, and this article steps through some examples of how to create different charts and modify them to make them more interactive and dynamic, thereby making the notebooks more intuitive to use when they are shared with data scientists and non-data scientists alike.
Setup
Oracle Machine Leaning is available with Oracle Autonomous Database, including Oracle Cloud Free Tier, Oracle Autonomous Data Warehouse, and Oracle Autonomous Transaction Processing cloud services. Oracle Machine Learning comes with several template notebooks that contain code and examples, and there are additional Oracle Machine Learning notebooks available on GitHub.
This article uses one of the sample datasets available on GitHub—specifically, the dataset is for customer credit scoring. Load the data from GitHub into a table called CREDIT_SCORING_100K in your Oracle Database schema. Log into Oracle Machine Learning, using the schema containing the credit scoring dataset, create a new Oracle Machine Learning notebook, and enter the following SQL statement:
select customer_id, credit_score_bin from credit_scoring_100k
This article doesn’t go into the specifics of using notebooks and their various components; it instead looks at how you can create various charts with Oracle Machine Learning.
After you enter and run the query, the results table will be displayed, but the results can also be converted into various charts and modified to represent the data in different ways. Figure 1 shows the charting menu in Oracle Machine Learning; the available charts include bar, pie, area, line, and scatter.
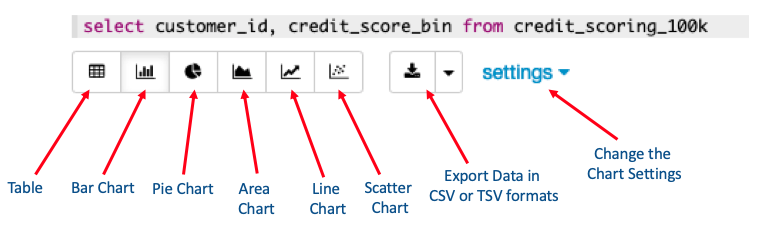
Figure 1: Charting menu in Oracle Machine Learning
Create Some Simple Charts
Creating your first chart couldn’t be easier. The first thing you need is a SQL query, such as the query in Figure 1:
select customer_id, credit_score_bin from credit_scoring_100k
After running this query and getting the results, click each of the chart icons (see Figure 1). The data will be automatically transformed into the corresponding charts. Care is needed when you’re selecting a chart, because not all queries and the returning data will suit every chart type. Figure 2 shows the charts created for this query.
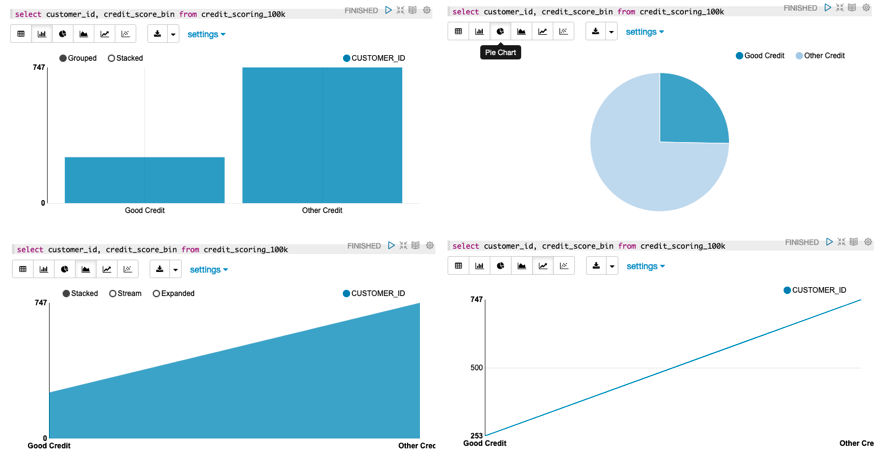
Figure 2: Examples of charts for a simple query
Adding Complexity and Change
Let’s now look at using a slightly more detailed query and how some of the various chart settings can be used to enhance the chart layouts.
select customer_id, age, income, tenure, loan_type,
       loan_amount, occupation, number_of_current_accounts,
       max_cc_spent_amount, mode_job_of_contacts
from credit_scoring_100k;
After running this query and clicking the chart icons, you will get some charts that won’t make sense.
Let’s step through some examples for transforming the results from this query into some meaningful charts.
Click settings (to the right of the list of chart icons, shown in Figure 1). This displays a set of three boxes, labeled Keys, Groups, and Values. The Keys box contains the attributes and values to display on the x-axis. The Values box contains the attributes and values to be plotted.
Let’s create a bar chart to plot the number of customers by the value of their loan amounts. To do this, drag the LOAN_AMOUNT attribute into the Keys box and CUSTOMER_ID into the Values box, as shown in Figure 3.
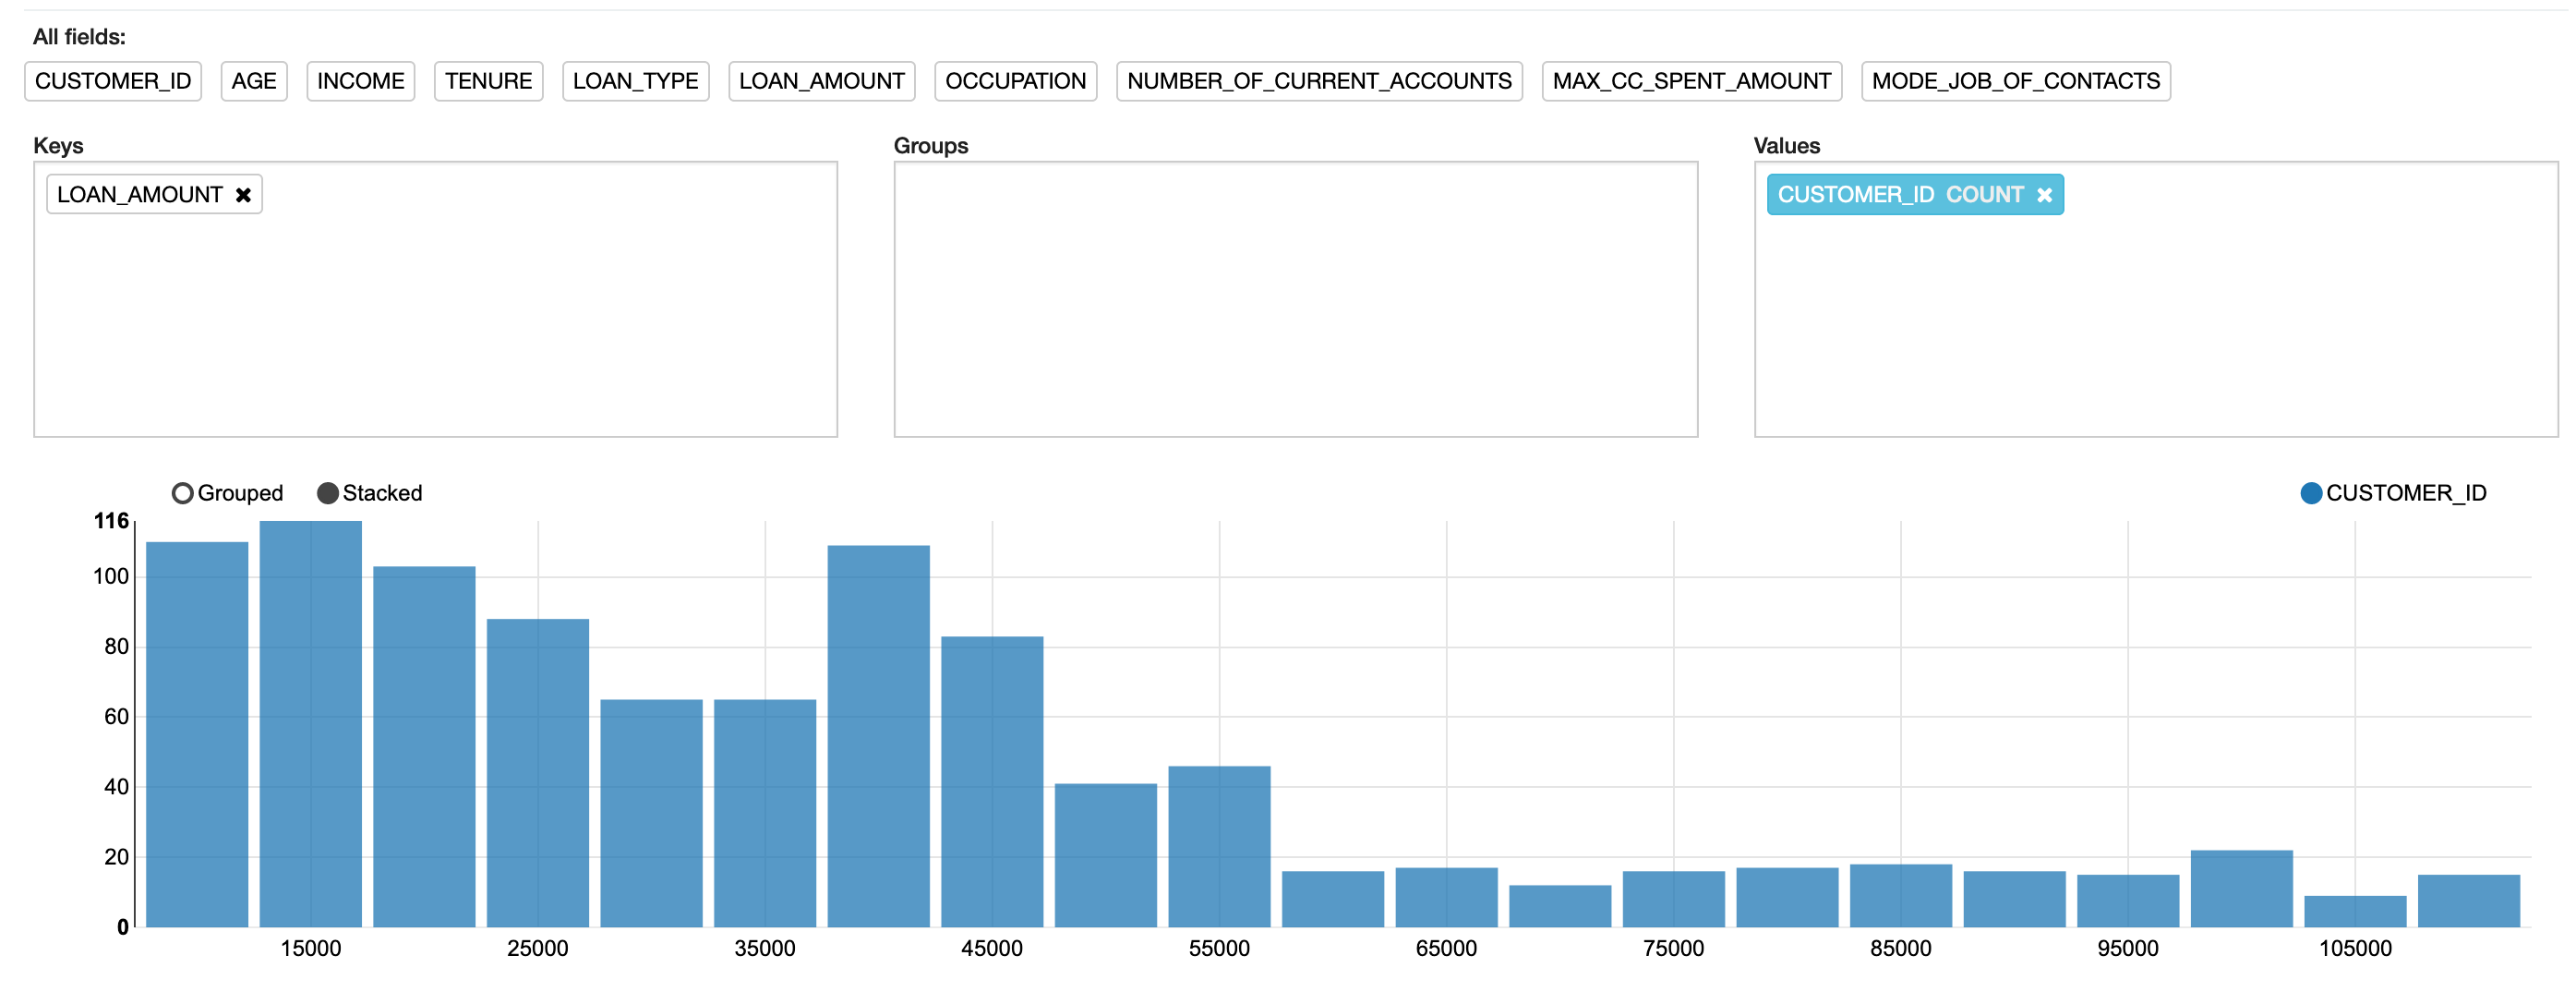
Figure 3: Customizing a chart for the x-axis and plotted data
The calculation performed on CUSTOMER_ID in Figure 3 is a COUNT function. Other calculations are available, including SUM, AVG, MIN, and MAX. To change the calculation, click the attribute in the Values box.
NOTE: When you drag an attribute into the Values box, it can default to using a SUM function on the data. Click the attribute to change the function.
Other groupings can also be added. For example, add LOAN_TYPE to the Groups box. This alters the bar chart to include additional values along the x-axis. The chart values are then grouped according to the different types of loans and their values, as shown in Figure 4.
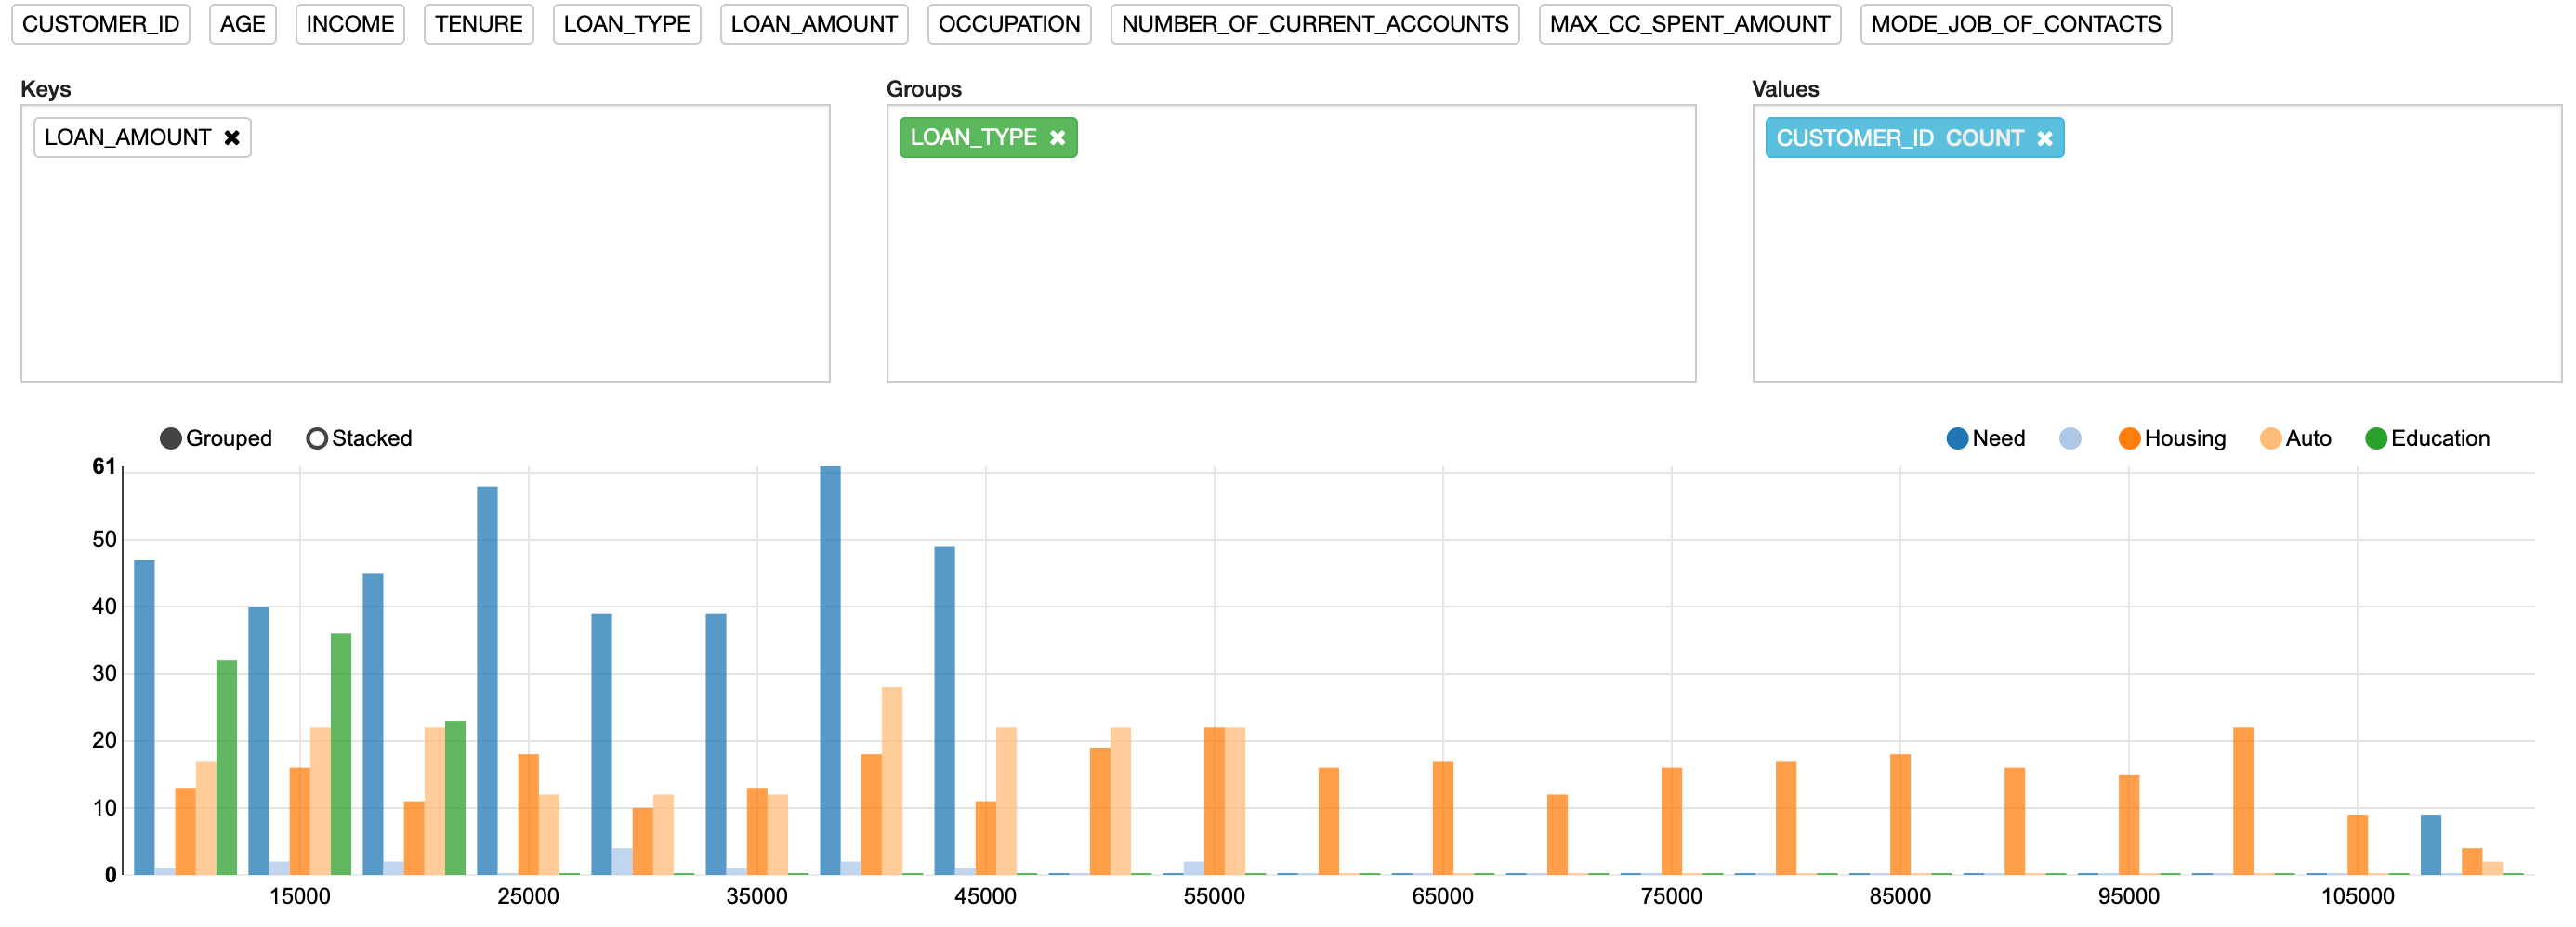
Figure 4: Bar chart with groupings
Care is needed with this approach, because the number of values included in the Groups box can increase and make the resulting chart unreadable. An alternative way to visualize this information is to convert it into a stacked chart by clicking the Stacked option, just above the bar chart. This will automatically convert the bar chart shown in Figure 4 into the more usable format shown in Figure 5.
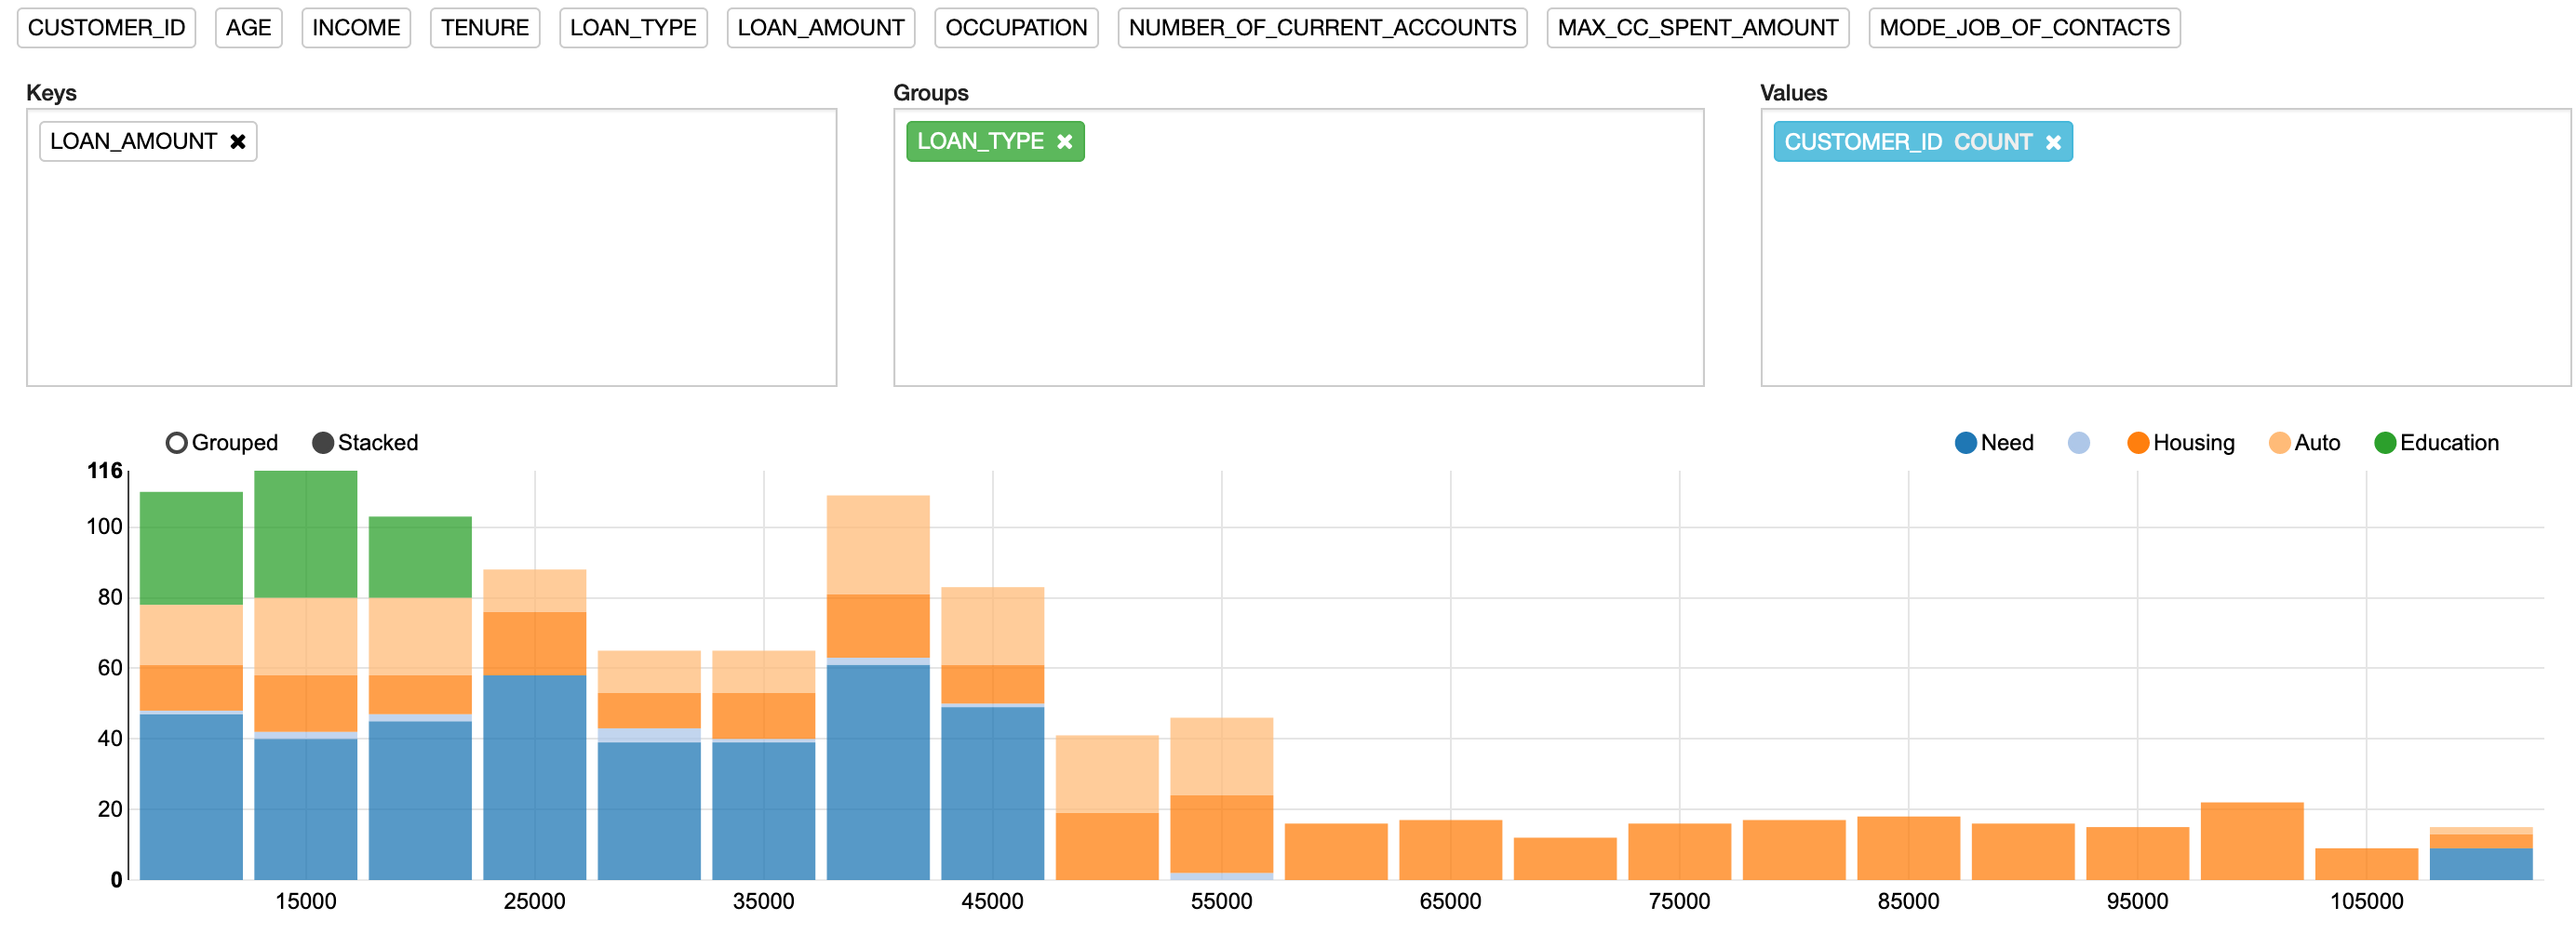
Figure 5: Stacked bar chart
Hovering the cursor over each segment of the stacked bar chart enables you to see a breakdown of the number of records in each segment.
Let’s now create a pie chart. Click the pie chart icon, and the pie chart will be automatically created. But the number of segments will be too many to display on the chart. To make this more meaningful, remove LOAN_AMOUNT from and add OCCUPATION to the Keys box and remove LOAN_TYPE from the Groups box. Figure 6 shows the updated pie chart. Note that although the chart shows different information, the original query and results have not been altered or changed.
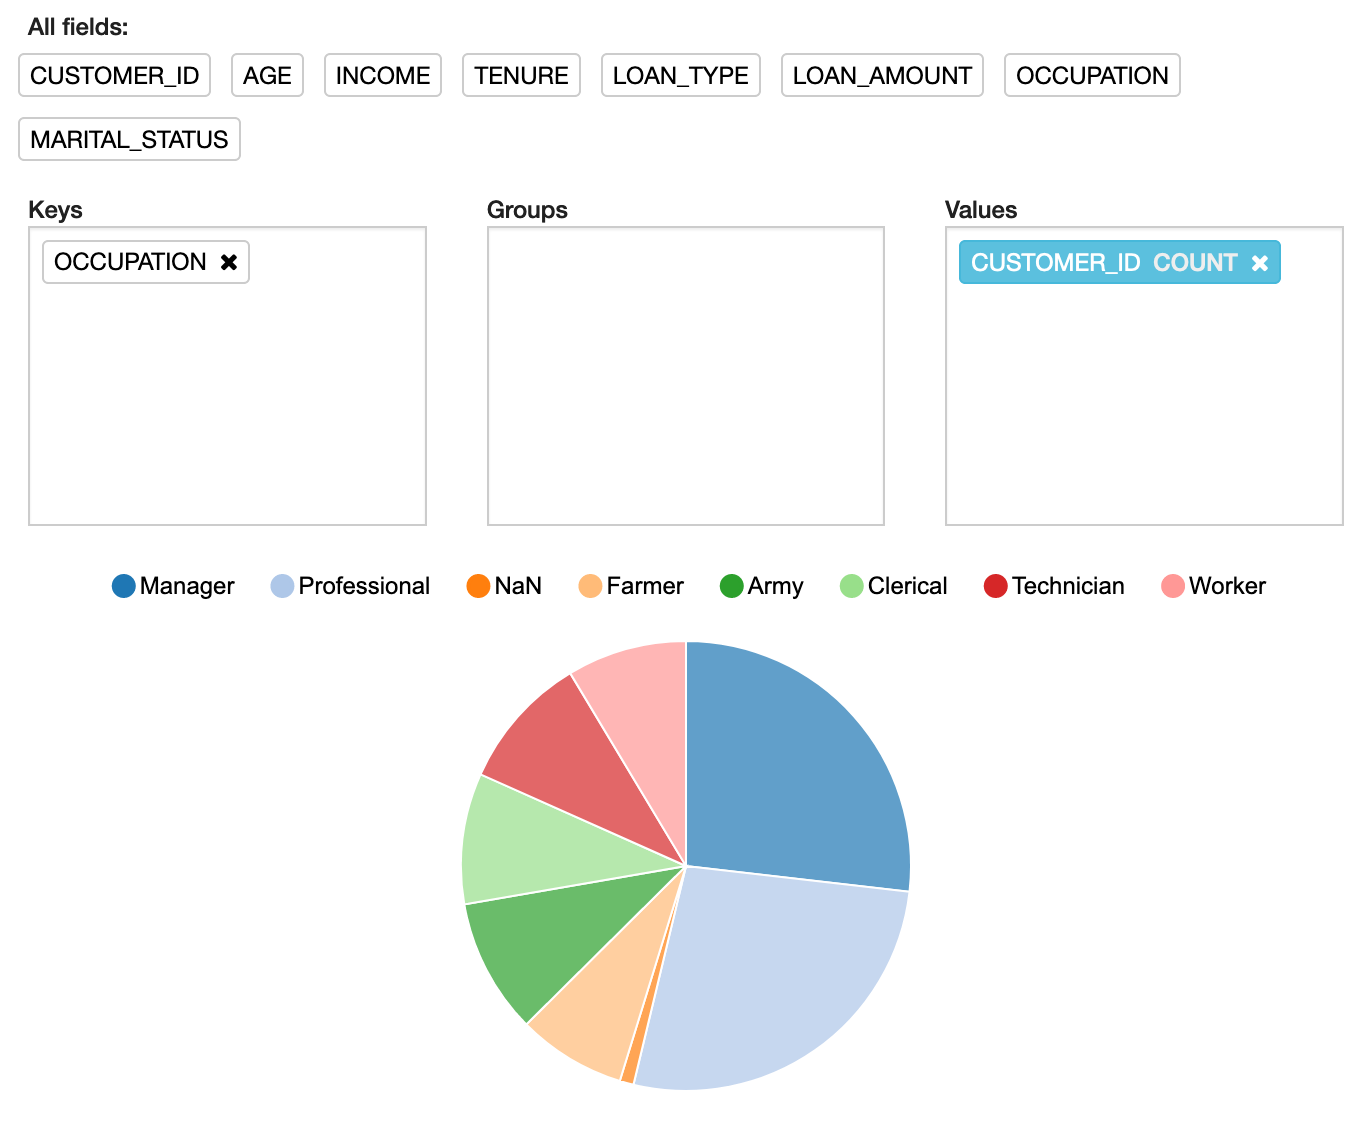
Figure 6: Pie chart of loan occupations
Another chart that can be created is the scatter chart. With a scatter chart, in addition to specifying the x-axis, y-axis, and group attributes, you can also specify a size attribute. This attribute is used to scale the size of the data points or circles on the scatter chart. Figure 7 shows an example of a scatter chart using new settings but still using the same query and results.
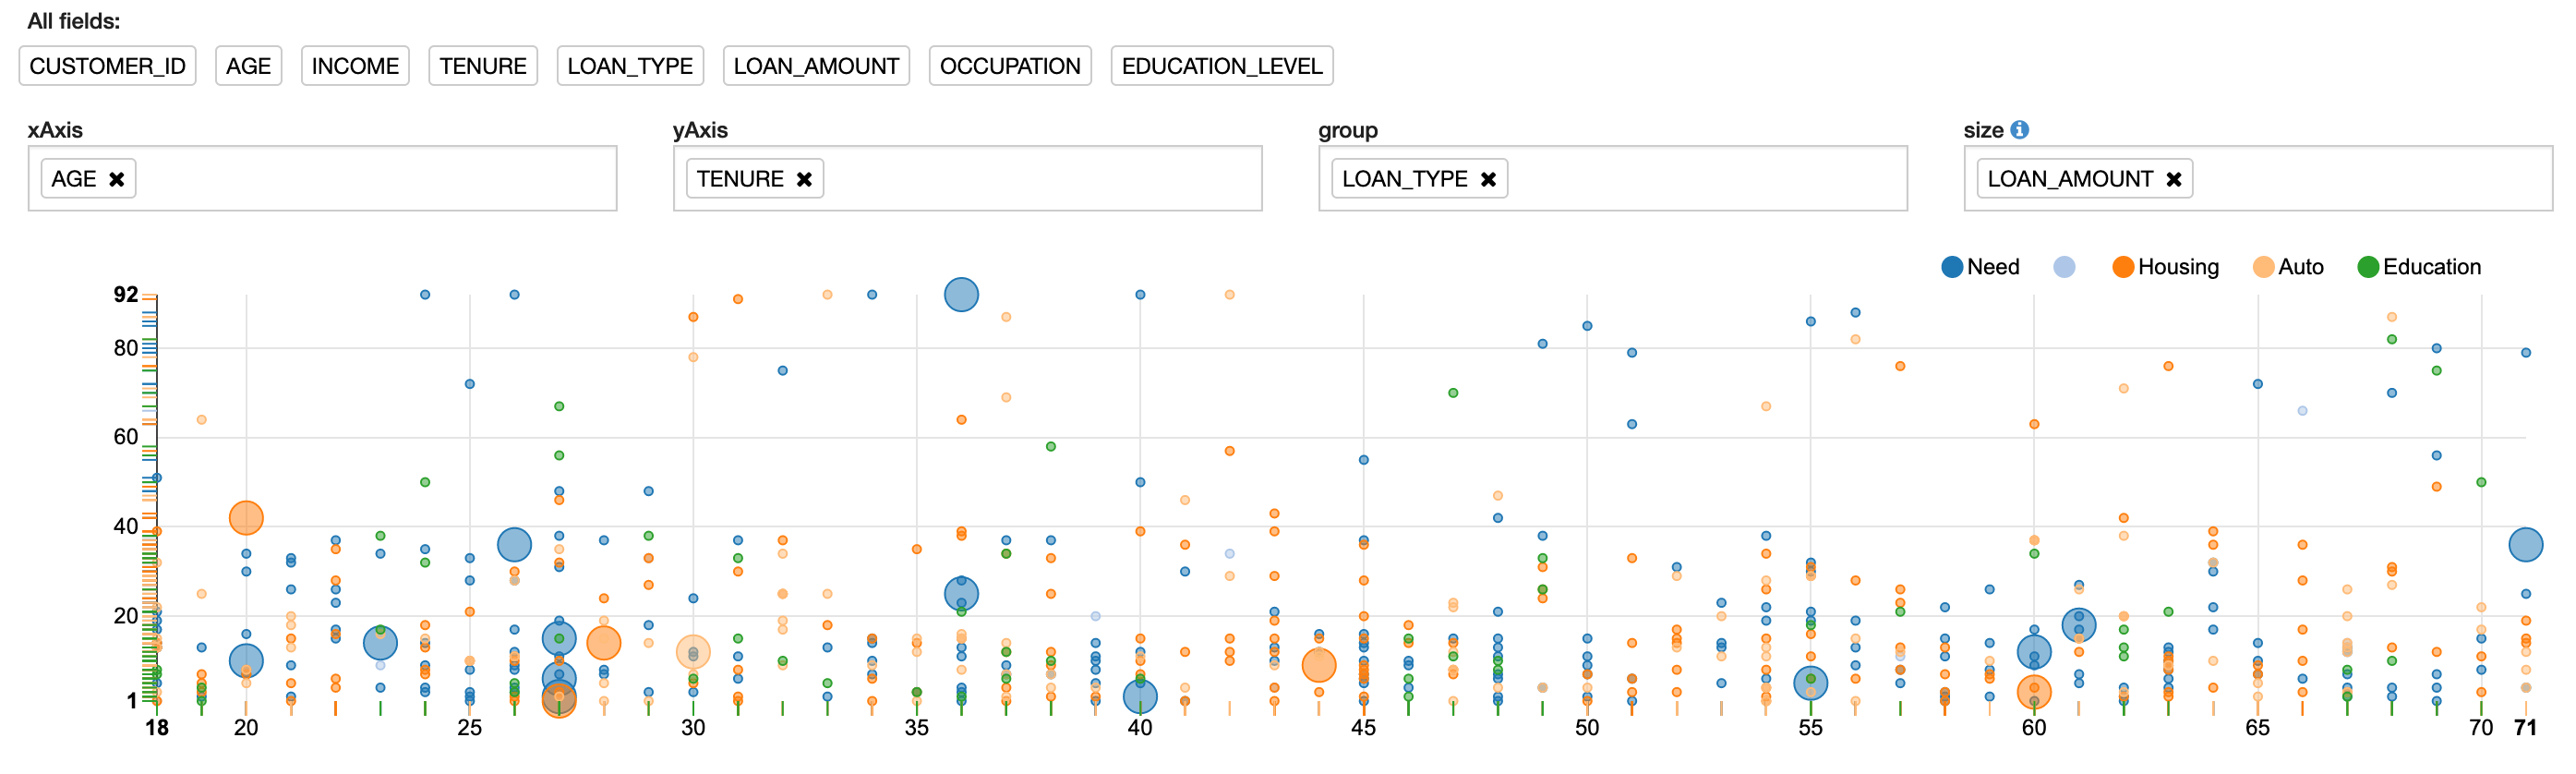
Figure 7: Scatter chart plot
How to Create an Interactive Chart
Another feature of creating charts in Oracle Machine Learning is the ability to create parameterized charts, which enable you to include a list of values that can be used to apply additional filtering. This feature is particularly useful when the Oracle Machine Learning notebook is being shared with other data scientists and analysts. The SQL query does not need to be modified to allow for this additional filtering, and the filtering can help keep any errors from being introduced into the query and the notebook.
Figure 8 illustrates a chart with an additional filtering list for LOAN_TYPE.
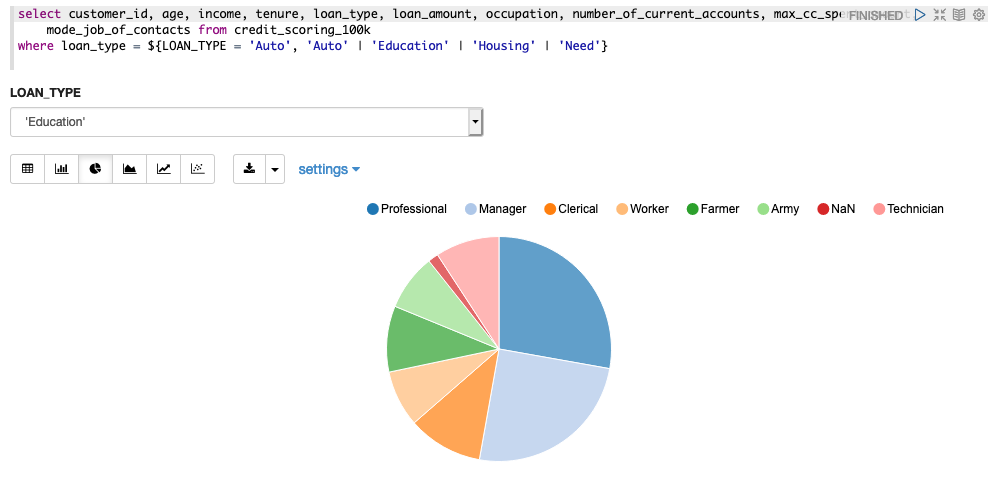
Figure 8: Pie chart with filter on LOAN_TYPE
Creating this filter means adding a WHERE condition to the original query. The structure of this WHERE condition is slightly different from the traditional SQL format and includes an indicator for the Oracle Machine Learning notebook to process the filter.
For the filter in Figure 8, the WHERE clause is
where loan_type =
${LOAN_TYPE = 'Auto', 'Auto' | 'Education' | 'Housing' | 'Need'}
The part highlighted in bold indicates the code needed to let the Oracle Machine Learning notebook know that this is a parameterized list. The list of values needs to be known in advance and must be included in this statement.
Summary
Oracle Machine Learning notebooks are available with both the Oracle Autonomous Transaction Processing and Oracle Autonomous Data Warehouse offerings on Oracle Cloud. Oracle Machine Learning notebooks enable data scientists and analysts to work with data in these autonomous databases to build out analytic and machine learning solutions. These notebooks can be easily shared across the organization and support several different charting options that transform the results of queries into different types of charts. These charts can be easily customized to extend the displayed information and make it more informative. No additional code is required to create these charts.
Next Steps
LEARN more about Oracle Machine Learning.
READ more about using Oracle Machine Learning notebooks.
EXPLORE Oracle Machine Learning notebooks on GitHub.
EXPERIENCE the Oracle Autonomous Data Warehouse and machine learning tutorial.
Illustration by Wes Rowell