Use Oracle Analytics Cloud to import and manage data and run machine learning algorithms to get the best results.
By Brendan Tierney
December 10, 2019
Oracle Analytics Cloud provides a single unified solution for analyzing data and delivering analytics solutions to businesses. Additionally, it provides functionality for processing data, allowing for data transformations, data cleaning, and data integration. Oracle Analytics Cloud also enables you to build a machine learning workflow, from loading, cleaning, and transforming data and creating a machine learning model to evaluating the model and applying it to new data—without the need to write a line of code. This article takes you through the various tasks for using Oracle Analytics Cloud to build a machine learning workflow.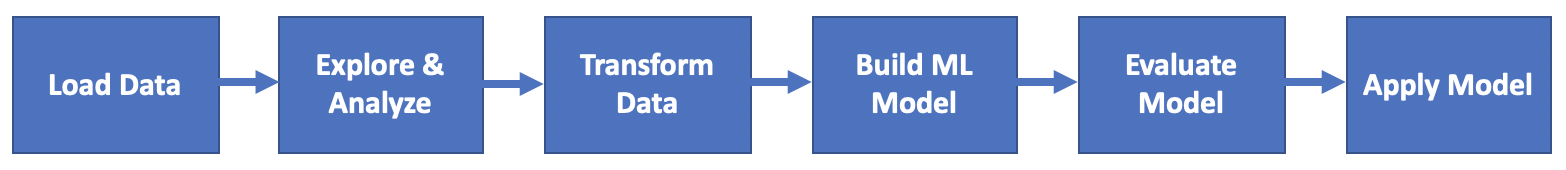
Figure 1: Typical machine learning process and tasks
A vital starting point for all machine learning projects is the business question and objective, which help focus the work conducted in each task of the process shown in Figure 1.
Oracle Analytics Cloud provides several types of machine learning functions and algorithms, including the following:
-
Numeric predictions (linear regression, elastic net linear regression, CART, and random forest)
-
Binary and multiclass classification (CART, Naive Bayes, random forest, SVM, logistic regression, and neural networks)
-
Clustering (hierarchical and k-means)
This article walks you through the different steps for creating and evaluating a machine learning model with Oracle Analytics Cloud.
Loading Data into Oracle Analytics Cloud
Many datasets are available that enable you to practice building machine learning models and compare your work with what other people around the world have done. This enables you to build up your skills, learn from others, and measure your progress.
The UCI Data Set Repository contains a wide variety of datasets covering typical machine learning problems as well as datasets from different domains. The Portuguese banking dataset is used in this article.
The business objective for the Portuguese bank is to build a machine learning model to predict which clients are more likely to subscribe to new term deposit accounts. The bank has been experiencing a decline in accounts, and it wants to target customers and contacts who are most likely to open a new account. Using data from previous marketing campaigns, it can learn which customers and types of customers are most likely to open a new account and should be included in the new marketing campaign.
To load the banking data set into Oracle Analytics Cloud, go to the hamburger (≡) menu and select Data. When the Data page opens, click the Create button (top right corner), select Data Set from the list, and drag and drop the banking dataset CSV file onto the screen. Figure 2 shows the loaded data. Inspect the data, and click the Add button (top right corner) to save the dataset to Oracle Analytics Cloud.
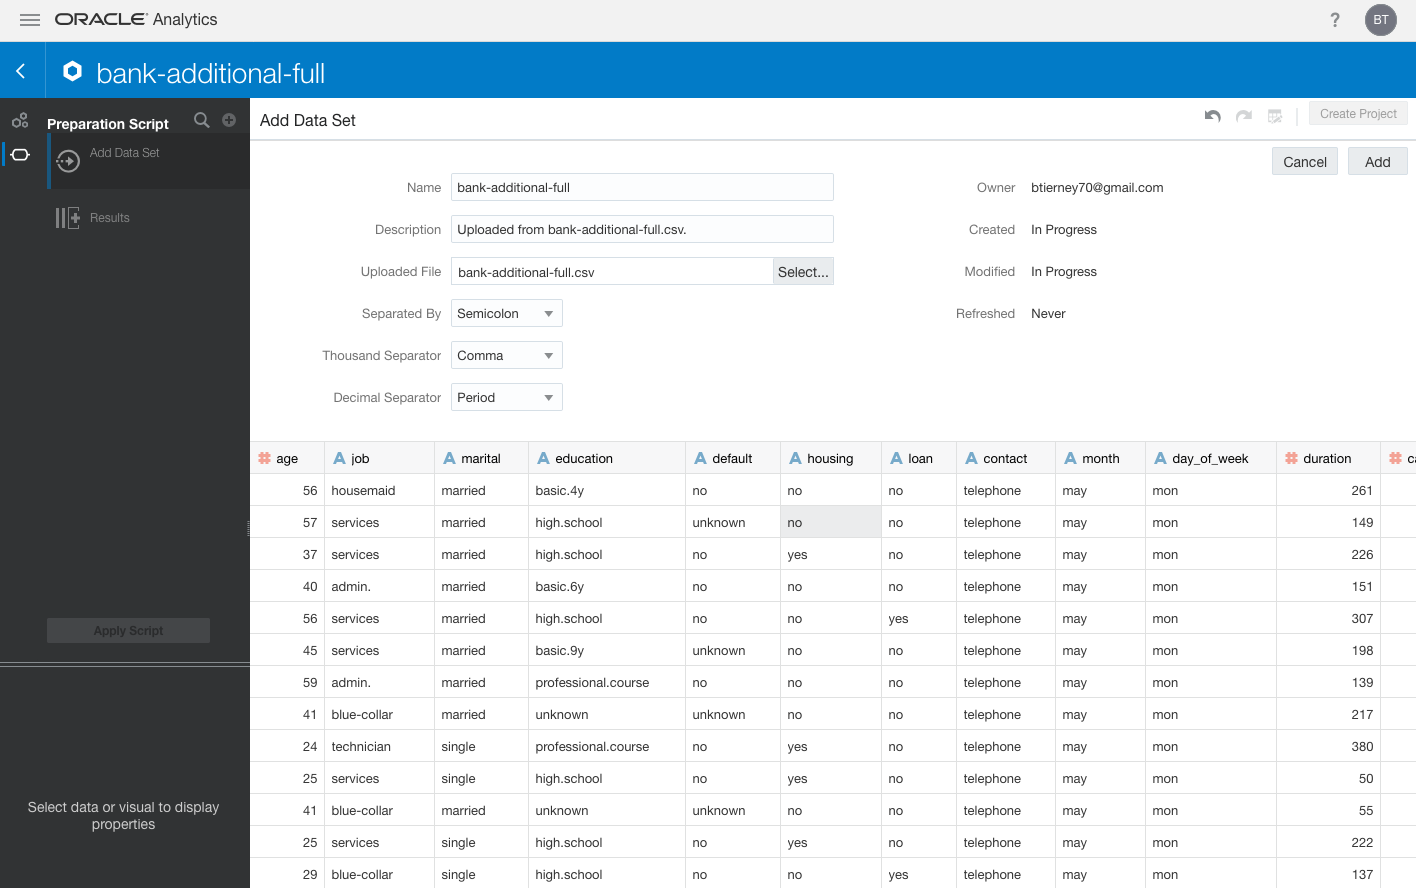
Figure 2: Loading the banking data set into Oracle Analytics Cloud
When the data set is loaded and saved, Oracle Analytics Cloud will make several recommendations for various attributes in the dataset. These recommendations may include extracting data from one attribute into multiple attributes, enriching an attribute by applying a function to it, identifying some data cleaning, and suggesting data enrichment. The banking dataset is relatively clean, however, so you can ignore the suggested recommendations and add the dataset to the Oracle Analytics Cloud environment by clicking Add.
But for future projects, Oracle Analytics Cloud suggestions, depending on the quality of your dataset, can save you a lot of time with data cleaning, because they can automate most of the work. Oracle Analytics Cloud also provides you with a wide range of built-in functionality for additional data cleaning and transformations. Figure 3 displays the range of data transformations available, and you can access a transformation by right-clicking an attribute. Alternatively, you can perform data transformations at a later point in your project.
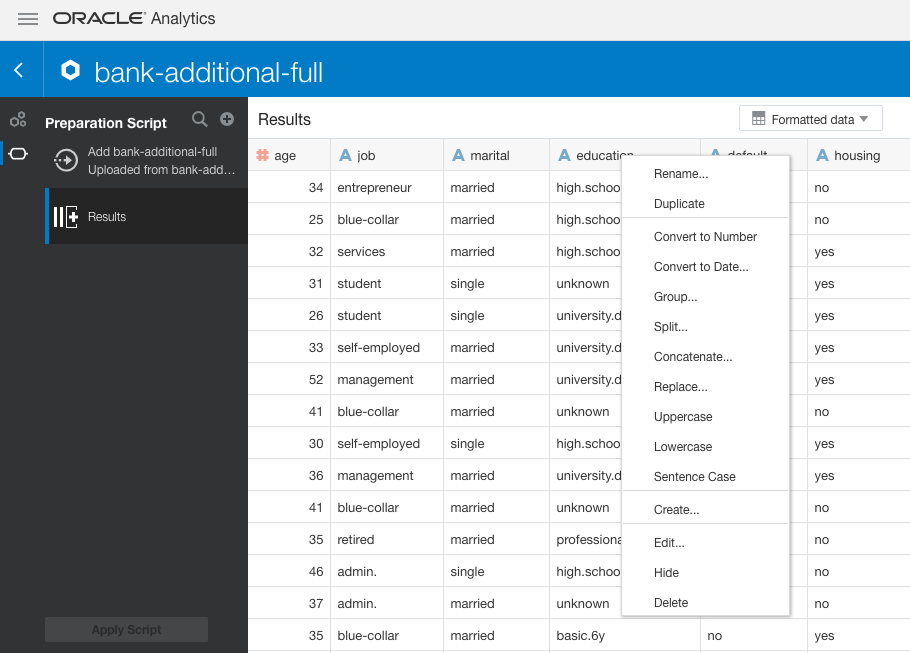
Figure 3: Data transformations list
When you are finished preparing the data, click the Create Project button (top right corner) to begin exploring the dataset. The Visualize screen will open. From here you can create different visualizations to explore the data, but sometimes it can be a bit difficult to know where to start. Oracle Analytics Cloud helps you with an Explain feature, shown in Figure 4.
The y attribute of the banking dataset defines the outcome of the previous marketing campaign—whether the customer accepted the offer. This attribute will be a key input feature for the machine learning, so let’s use the Oracle Analytics Cloud Explain feature to provide some insights into it. To access the Explain feature, right-click the y attribute and select Explain y, as shown in Figure 4.
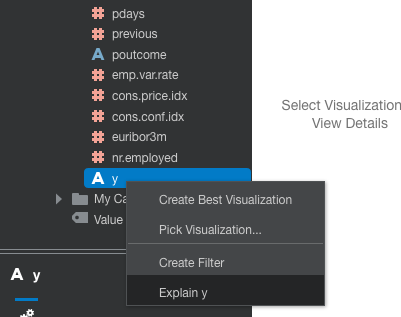
Figure 4: Selecting the Explain feature
When run on an attribute column (the y column in this case), the Explain feature sorts its data insights into four main parts. The first part (Basic Facts) provides some basic counts and distributions of the data for each variable, compared to the attribute being explained. The second part, Key Drivers (shown in Figure 5), goes into more detail, showing what attributes and values are strongly correlated with the attribute being explained. The third part (Segments) looks at different combinations of values that provide some hidden patterns, and the fourth part (Anomalies) looks at potential anomalies in the data.
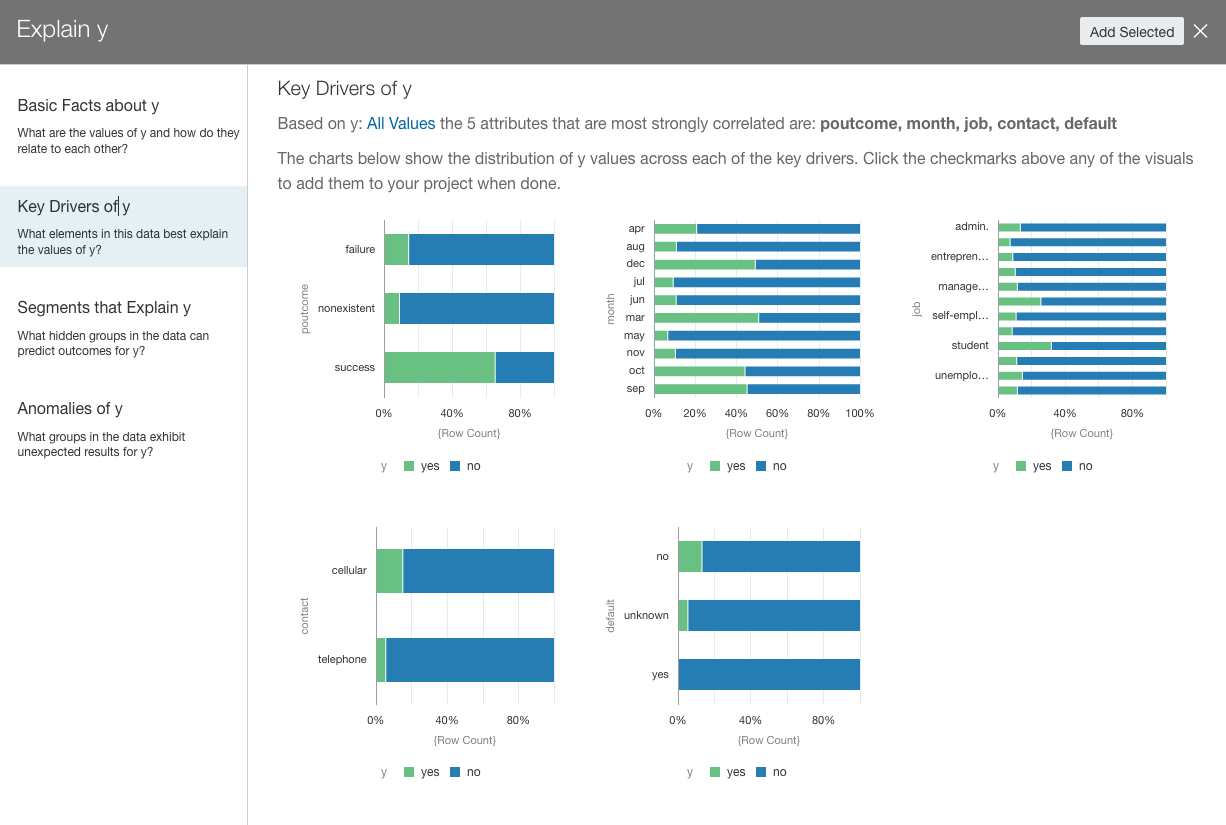
Figure 5: Oracle Analytics Cloud Explain feature, showing Key Drivers
The Explain feature helps you gain insights into the various attributes and how they are related to the attribute being explained without having to write a line of code. To create an initial dashboard, using the various graphics displayed in each of the Explain parts, select the tick mark on the graphics you want to include and click the Add Selected button at the top of the window. This will create a layout like the one in Figure 6.
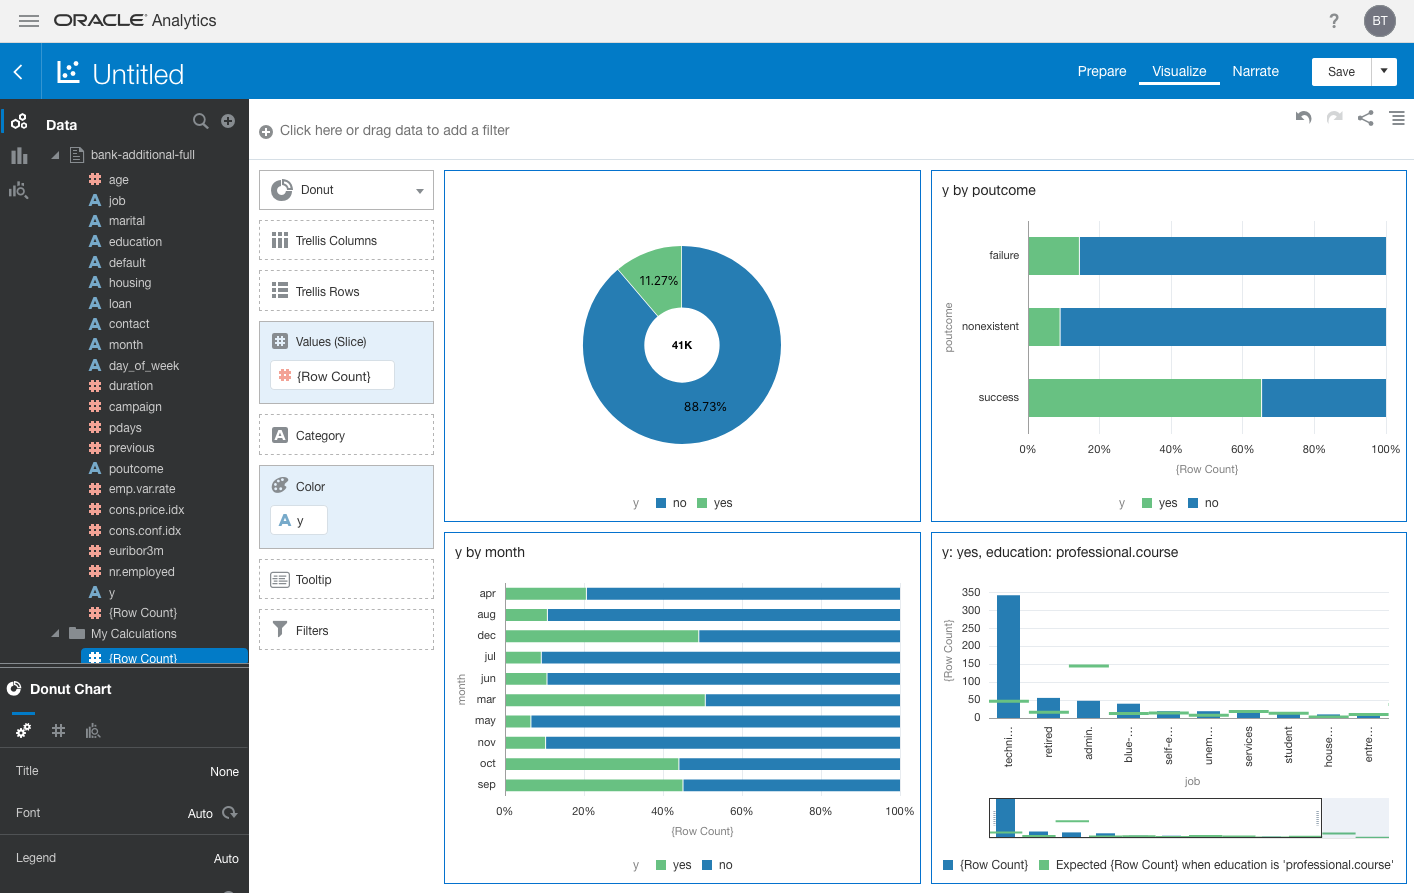
Figure 6: Dashboard created with visualizations from the Explain feature
Oracle Analytics Cloud also enables you to explore the data in greater detail, using various visualizing methods. For now, however, let’s assume you have finished exploring the data and have completed the first two tasks shown in Figure 1: loading and exploring the dataset.
Machine Learning Features and Data Flow
Now that you have explored the data and gotten some insights into it, it is time to start building the machine learning solution. Oracle Analytics Cloud includes a workflow feature called Data Flow to enable you to build out each step of the process, similar to the processes shown in Figure 1. To create a data flow in Oracle Analytics Cloud, go to the hamburger (≡) menu and select Machine Learning. From there, click the Create button (top right corner). This opens a menu, and Data Flow is one of the options, as shown in Figure 7.
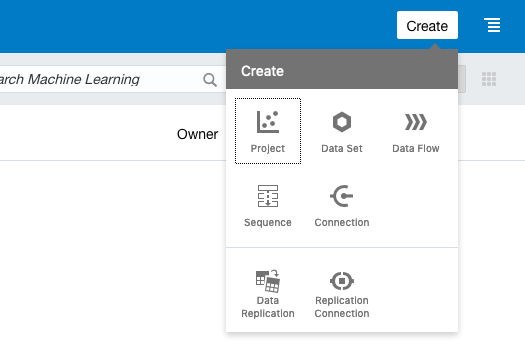
Figure 7: Create data flow
Click Data Flow, and a window will open, listing all the available datasources. Select the banking dataset to create the data flow with a node for the dataset (as shown in Figure 8). To the right of the data node is a plus (+) symbol. You can click this node to add more nodes to perform different actions.
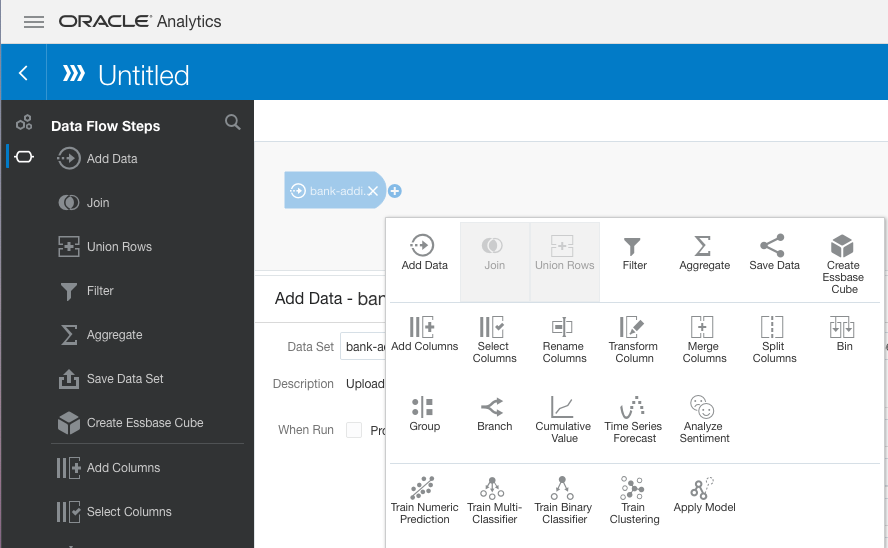
Figure 8: Data flow options
Now create a node in the workflow with a subset of the data for the machine learning algorithms. To create this node, click Select Columns. By default, all the available columns are selected. In this example, you want to remove the Duration attribute from the dataset, because it is correlated with the target attribute. Select the Duration attribute from the list, and click Remove Selected.
Among the other data transformations available are adding new columns, renaming columns, merging and splitting columns, binning data, and running custom functions. For this particular dataset, these data transformations are not required.
Building a Machine Learning Model
The next step in the process is to create the machine learning model. Much as in the previous step, click the plus (+) icon to the right of the data preparation node in the data flow. The same menu shown in Figure 8 appears; this time select Train Binary Classifier. The target attribute y contains two values, hence binary classification. A window opens, listing the available classification algorithms. In this example, you are going to use the random forest algorithm. Figure 9 lists the various parameter options and default values for the random forest algorithm.
In most cases, the default parameter values are fine, but depending on the problem and the dataset, some values might need adjusting, particularly when you are experimenting to determine the optimal machine learning model. The last two parameters shown in Figure 9 have been changed from the defaults. The first, Train Partition Percent, changes the percentage of records to use for training and creating the model. This has been changed to 70%, which is in keeping with what you might find in most literature on machine learning. The remaining 30% of the records will not be included for model training but will instead be held back and used to measure how good the model is. This is typically called a holdout dataset.
The last parameter in Figure 9, Balancing Method, has been changed from Under Sample to Over Sample. The dataset is imbalanced, with nearly 89% of the records having a target attribute (y) value of No, but with undersampling, the set of records where the target attribute is No will be undersampled to provide the same number of records as those with a value of Yes. Because the dataset is small, an oversampling method can be used, and its effect is the opposite of undersampling. Oversampling will look at records having a target value of Yes and oversample these until it has the same number of records as those of the other target values. This method increases the overall number of records in the dataset.
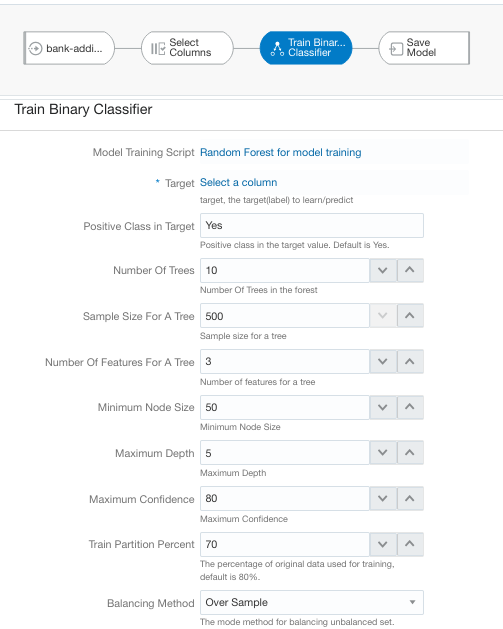
Figure 9: Random forest classifier configuration
Before running the data flow, edit the Save Model node to give it a meaningful name, such as Banking_RF_Model. At this point, you are ready to run the data flow to process the data, create the model, and save the model. To do this, click the Run Data Flow button at the top right of the screen. After a few seconds, the data flow will complete and you can examine the evaluation measures.
Evaluating the Machine Learning Model
To access the model evaluation measures, go to the hamburger (≡) menu and select Machine Learning. From there, right-click the model name and select Inspect from the menu. Figure 10 shows the details displayed on the Quality tab, which contains the main details about the model and the evaluation measures. It displays the confusion matrix (including Type I and Type II errors), showing the number of correct (blue) and incorrect (pink) predictions. These numbers enable you to evaluate the model accuracy. Recall when, in the previous section, you set the Train Partition Percent value to 70%. The remaining 30% of the records are used for this evaluation. The predicted outcomes are then compared automatically by Oracle Analytics Cloud so you can see and measure which records are correctly predicted and which are incorrectly predicted.
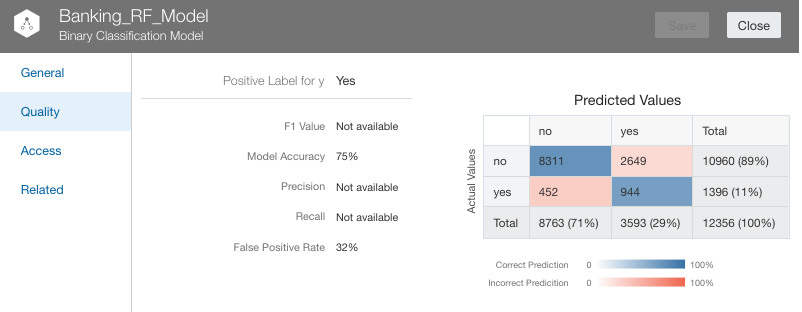
Figure 10: Confusion matrix
The aim of all machine learning projects is to create a model that best represents the patterns in the data and to have the highest accuracy while minimizing the number of incorrect predictions. Although the random forest algorithm achieved an overall model accuracy of 75%, the next steps would be to try the other algorithms to see if they can achieve higher accuracy and to adjust the parameter settings for each algorithm. For most machine learning models, you could end up with dozens of different models. Using tools such as Oracle Analytics Cloud can help reduce the time it takes to create all these models without having to write a line of code.
When you are satisfied with the accuracy of the newly trained model, you can apply it to the full dataset. You can also apply a model directly in a new data flow (using the Apply node) or explore a model with data visualizations (via the Scenario feature).
Conclusion
Oracle Analytics Cloud continues to evolve and now includes some typical machine learning tasks. This article worked through the steps for using some of these machine learning features, using a well-known dataset. These steps were defined with different nodes in a data flow, enabling you to create and reuse a machine learning model without having to write a line of code. Oracle Analytics Cloud provides an easy-to-use environment in which any data analyst can start using machine learning.
Next Steps
LEARN more about Oracle Analytics Cloud.
READ Oracle Analytics Cloud documentation.
READ more about machine learning in Oracle Analytics Cloud documentation.
EXPLORE Oracle Data Visualization Desktop.
GET datasets at UCI Data Set Repository.
Illustration by Wes Rowell