Most of the enterprises collect, store, and analyze network traffic flow logs. They use this information to troubleshoot connectivity and security issues, and to ensure that network access rules are working as expected. Oracle recently announced the general availability of Flow Logs. We previously posted a blog that shows how to set up Flow logs on the Oracle Cloud Infrastructure (OCI) Console. We show sample logs for various scenarios and how to run custom queries on flow logs to filter only the records one is looking for. It helps users to analyze what logs they can see in failure or success scenarios when flow logs are enabled.
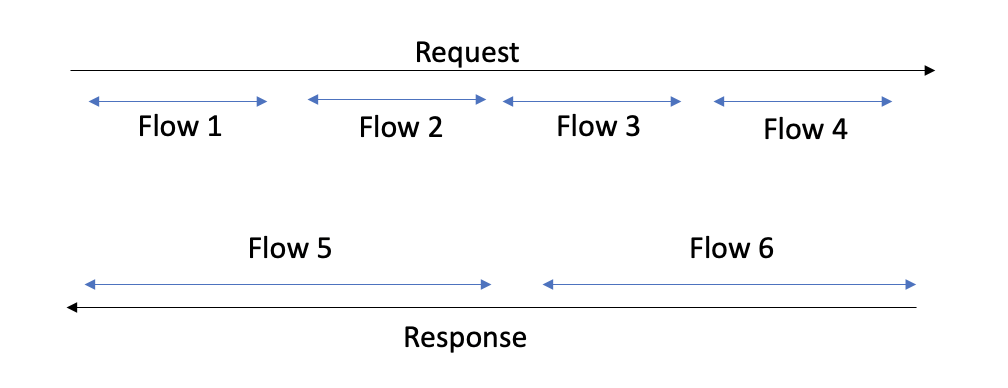
When working with flow logs, it’s important to understand the difference between a session and a flow. A flow is a sequence of packets carrying data between two hosts where packets share 5-tuples: Source IP address, source port, destination IP address, destination port, and transport protocol. Flow logs with the same 5-tuple are aggregated by the service into one-minute batches.
A flow is not identical to a session. A flow contains only a part of a session and includes packets moving in one direction. Typically, a flow consists of data for one session, but it can have the same values even for more sessions. A session, on another hand, includes packets moving in both directions.
Flow logs
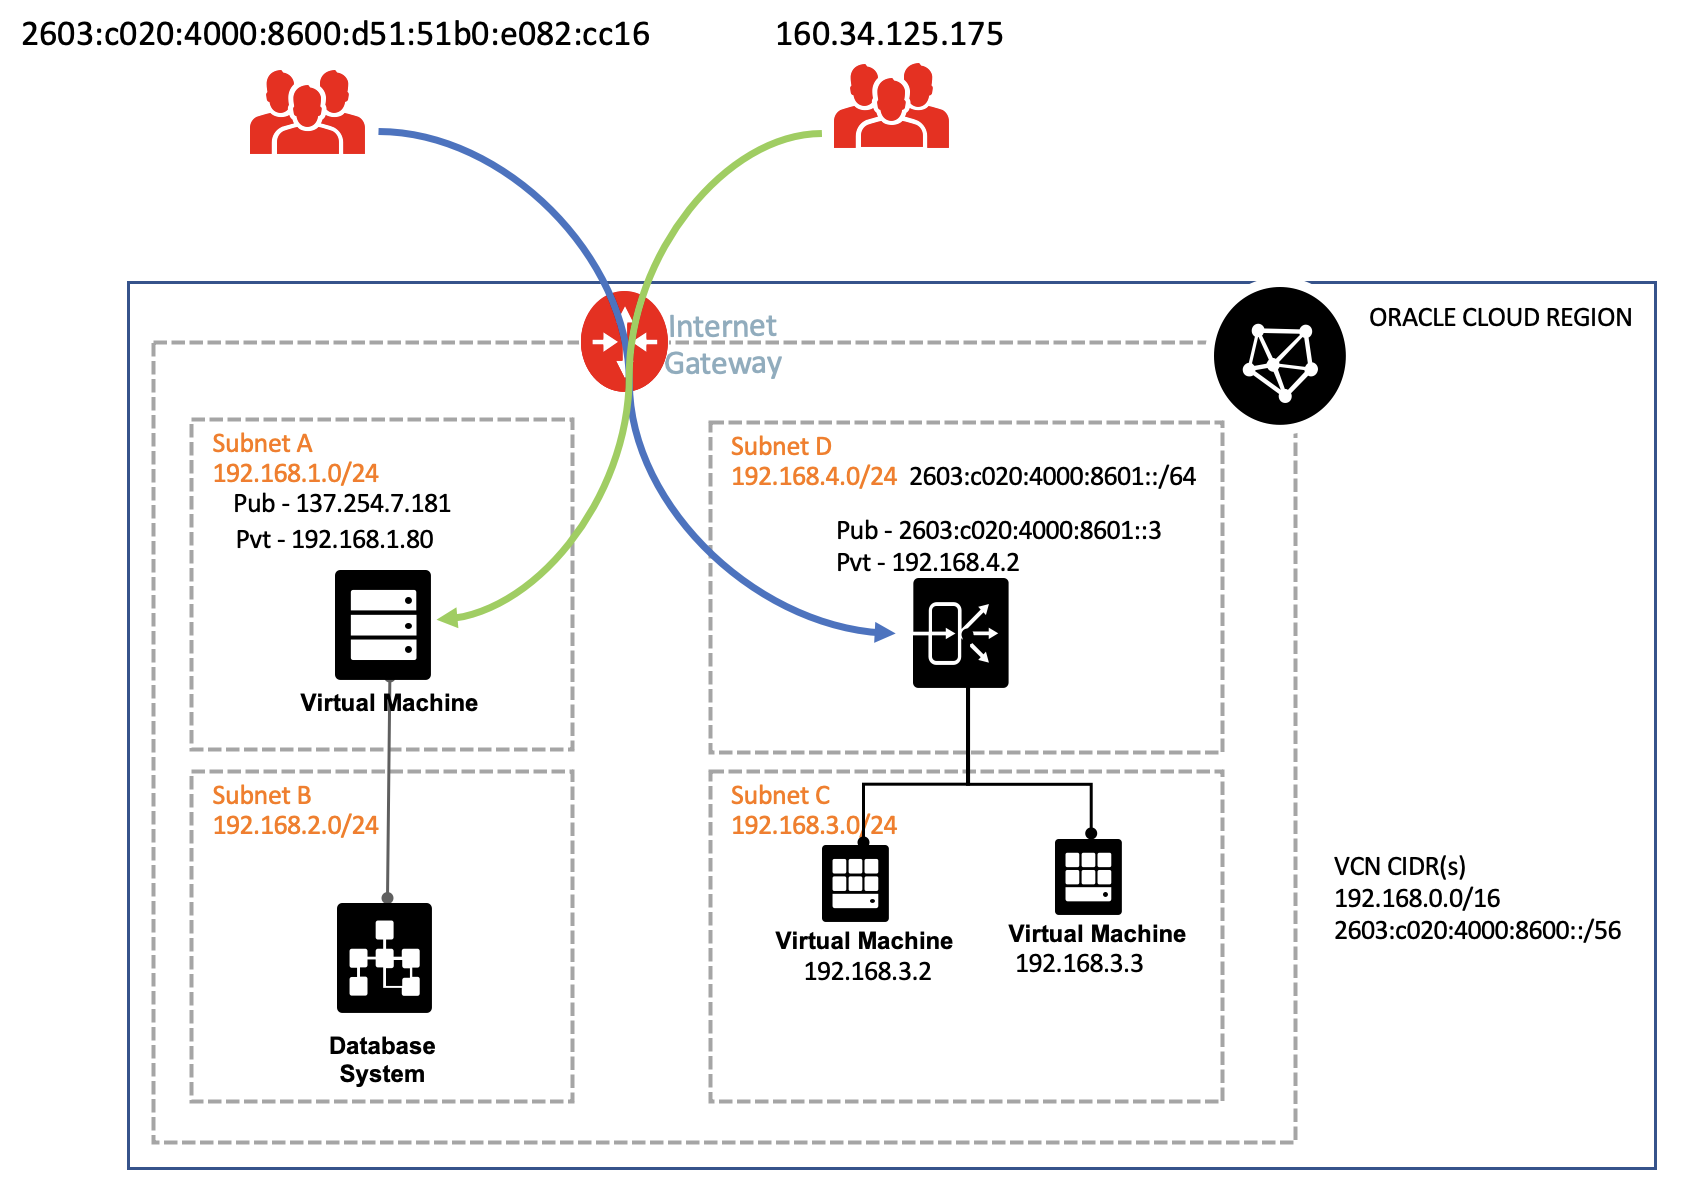
A fictitious e-commerce site for cat products, MuShop recently migrated their services to Oracle Cloud. The OCI network that MuShop utilizes today is a distributed ecosystem that consists of specialized functional tiers, as shown in the following diagram. The VCN consists of four subnets with both IPv4 and IPv6 routes configured to the internet gateway. One of the four subnets is enabled with IPv6. While they strive to keep the networking piece simple, the inherent nature of using various technologies can be a bit complicated. To avoid deployment and post production challenges, MuShop decides to enable flow logs for all the subnets and services that they use. The following examples show scenarios of flow log records that they capture for specific traffic flows.
Accepted and rejected traffic
After migration of MuShop to OCI, all their Compute instances hosting an application were accessible by SSH. For security reasons, the administrator of the company wanted to closely monitor one of their instances (192.168.1.80) and track details, such as source address, destination address, and destination port. He decides to use flow logs to monitor the SSH traffic.
A flow log record with action ACCEPT is seen minutes later for the traffic from source address 160.34.125.175 to a destination address 192.168.1.80 and destination port 22.
![]()

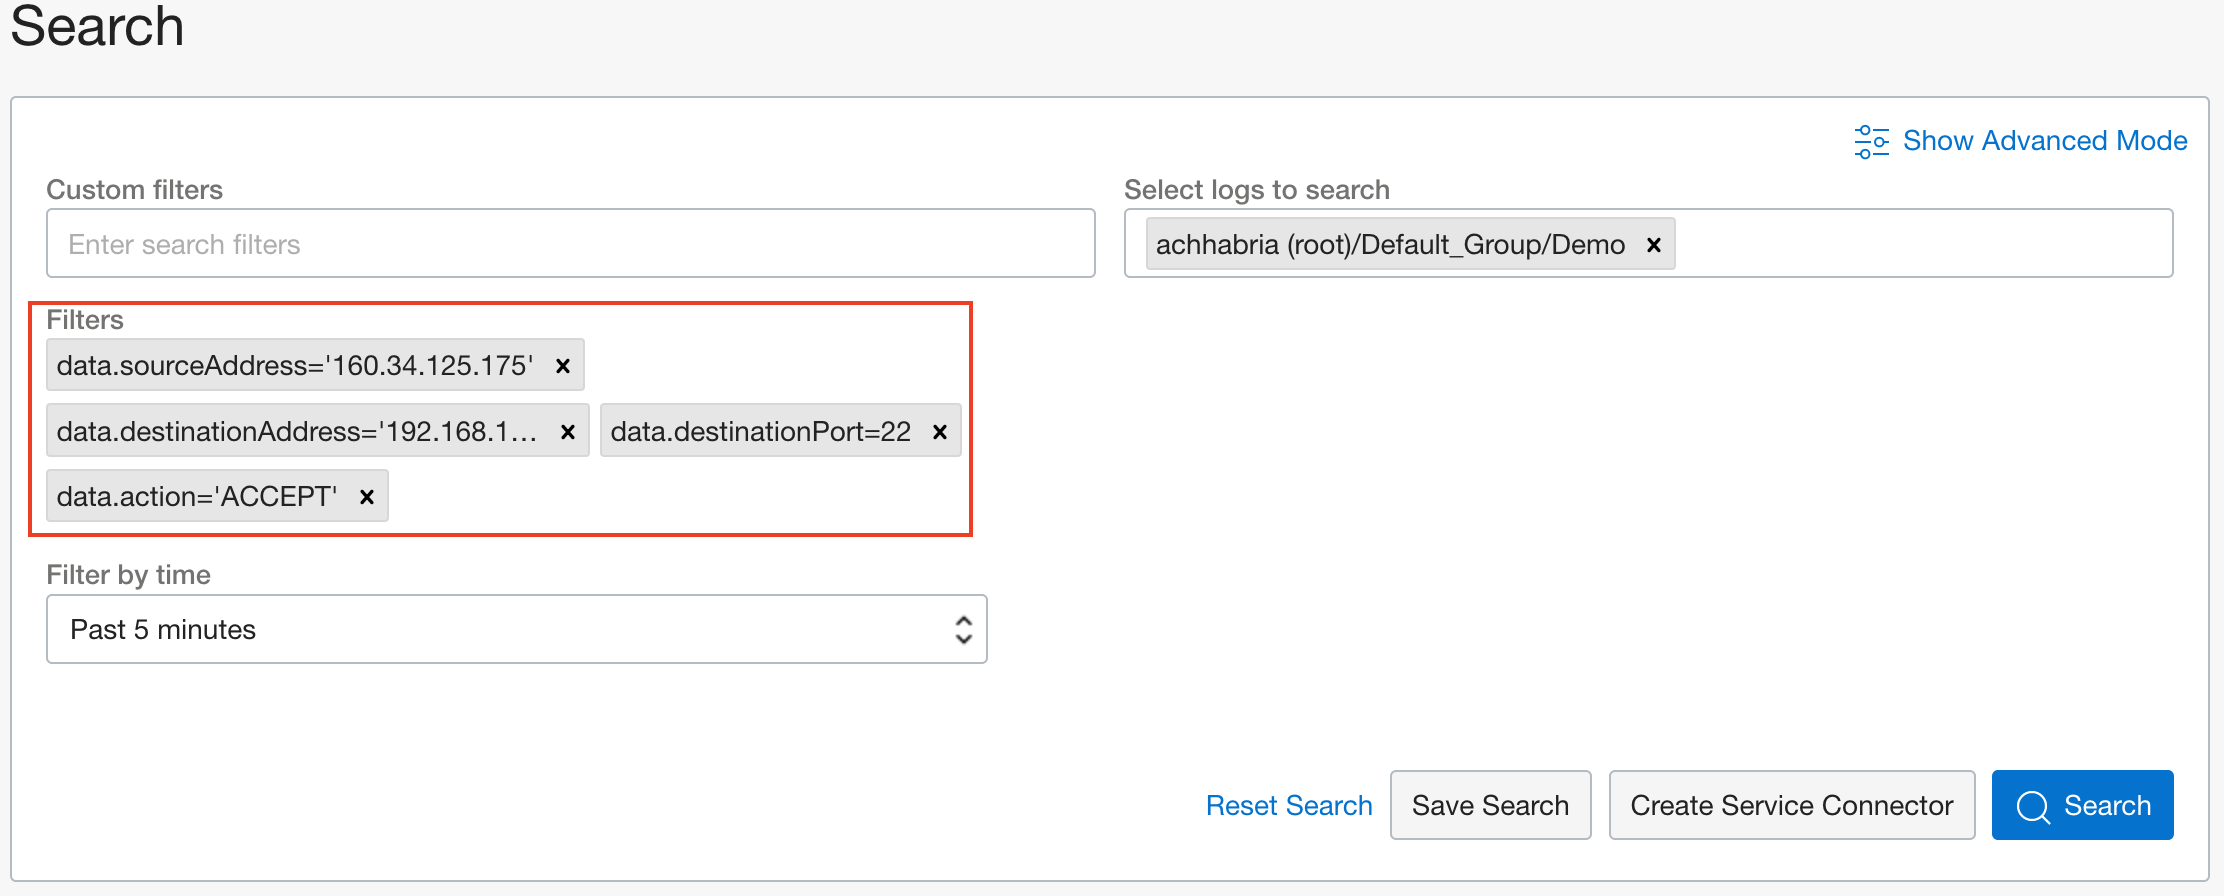
He also wants to monitor traffic from the same source address, destination address, and destination port, so he decides to use a custom filter option in flow logs. To create a custom filter, click Explore with Log Search in a service log created for the subnet that contains this Compute instance.

The format to enter a custom search filter is ‘property’.‘item’ = ‘value’. For example, plugging in some values from the sample ACCEPT JSON shown, the custom search filter to show all accepted traffic is data.action = ‘ACCEPT.’ The property is ‘data,’ item is ‘action,’ and value is ‘ACCEPT.’ You can add more than one custom search filters in a single query for granular results.
This custom search filters all the traffic that was accepted but also provides some extra ACCEPT flow records that aren’t relevant. The administrator adds another filter data.sourceAddress = 160.34.125.175, data.destinationAddress = 192.168.1.80 and data.destinationPort = 22.
You can also add more filters in the same request to get further granularity based on compartment, subnet, and specific OCID, such as in the following examples:
-
vnicsubnetcoid: Filter all traffic inside the subnet enabled with flow logs
-
vniccompartmentocid: Filter all traffic inside compartment only for flow logs enabled subnets
-
vnicocid: Filter traffic for a specific VNIC
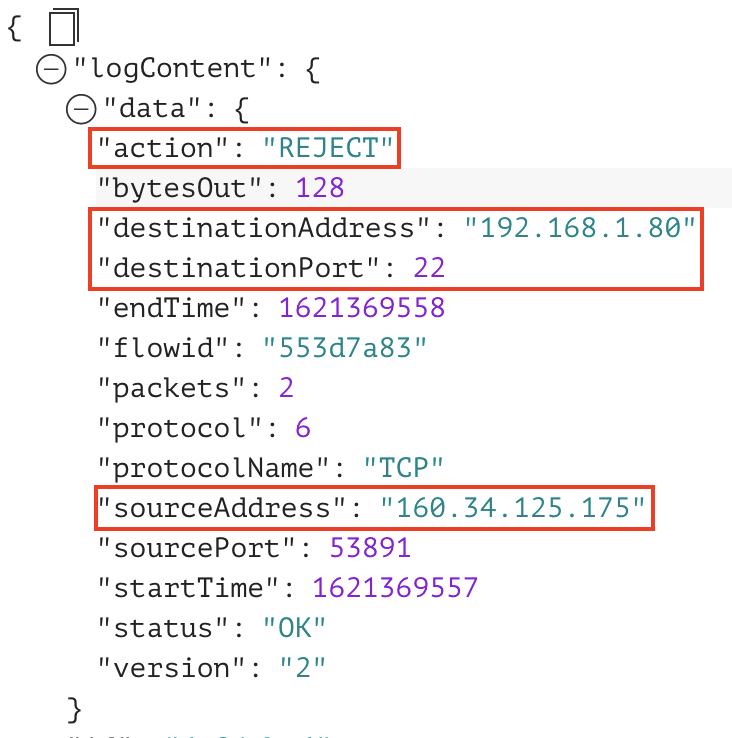
A few days later, the administrator can’t SSH into the same Compute instance (192.168.1.80) and notices some REJECT traffic for the same destination.
In this example, SSH traffic (destination port 22, TCP protocol) to 192.168.1.80 was rejected. When you notice the rejection of SSH traffic, you can take the following steps:
-
Ensure the security list has an ingress state rule configured with TCP as a protocol and destination port of 22. Associate this security list with the subnet where the VNIC of the Compute instance resides.
-
If the security lists are configured correctly and traffic isn’t being rejected, check if the appropriate routing table rules are configured.
With the examples, the custom filter to show all rejected traffic as data.action = ‘REJECT.’ This choice filters all the traffic that got rejected.
![]()
IPV4 or IPv6 traffic
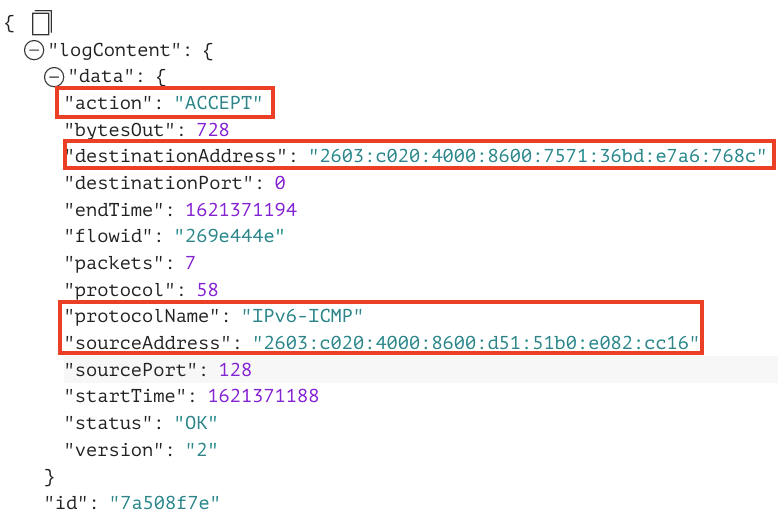
A software developer at MuShop builds an application that requires multiple secondary VNICs with multiple secondary IP addresses configured to be attached to the Compute instance. While sending traffic to another Compute instance with the same setup, it becomes tedious to only rely on the VNIC OCID as the custom filter. Here, data.destinationAddress, data.sourceAddress, and data.protocolName come into play. You can easily use these properties as custom filters to selectively filter flow logs based on the primary and secondary IP addresses. In the example, IPv6-ICMP traffic from IPv6 address 2603:c020:4000:8600:d51:51b0:e082:cc16 to network interface 2603:c020:4000:8600:7571:36bd:e7a6:768c is allowed. These custom filters help the software developers to easily automate and identify the specific data they’re looking for. Examples include the following custom filters:
-
data.destinationAddress = ‘2603:c020:4000:8600:7571:36bd:e7a6:768c’
-
data.sourceAddress = ‘2603:c020:4000:8600:d51:51b0:e082:cc16’
Alternatively, you can use data.protocolName = ‘IPv6-ICMP’ with the searches that filter only ICMP packets from the source IP address to destination address. You can also filter on data.sourcePort or data.destinationPort fields. The same queries apply for IPv4 log filtering.

No data and skipped records
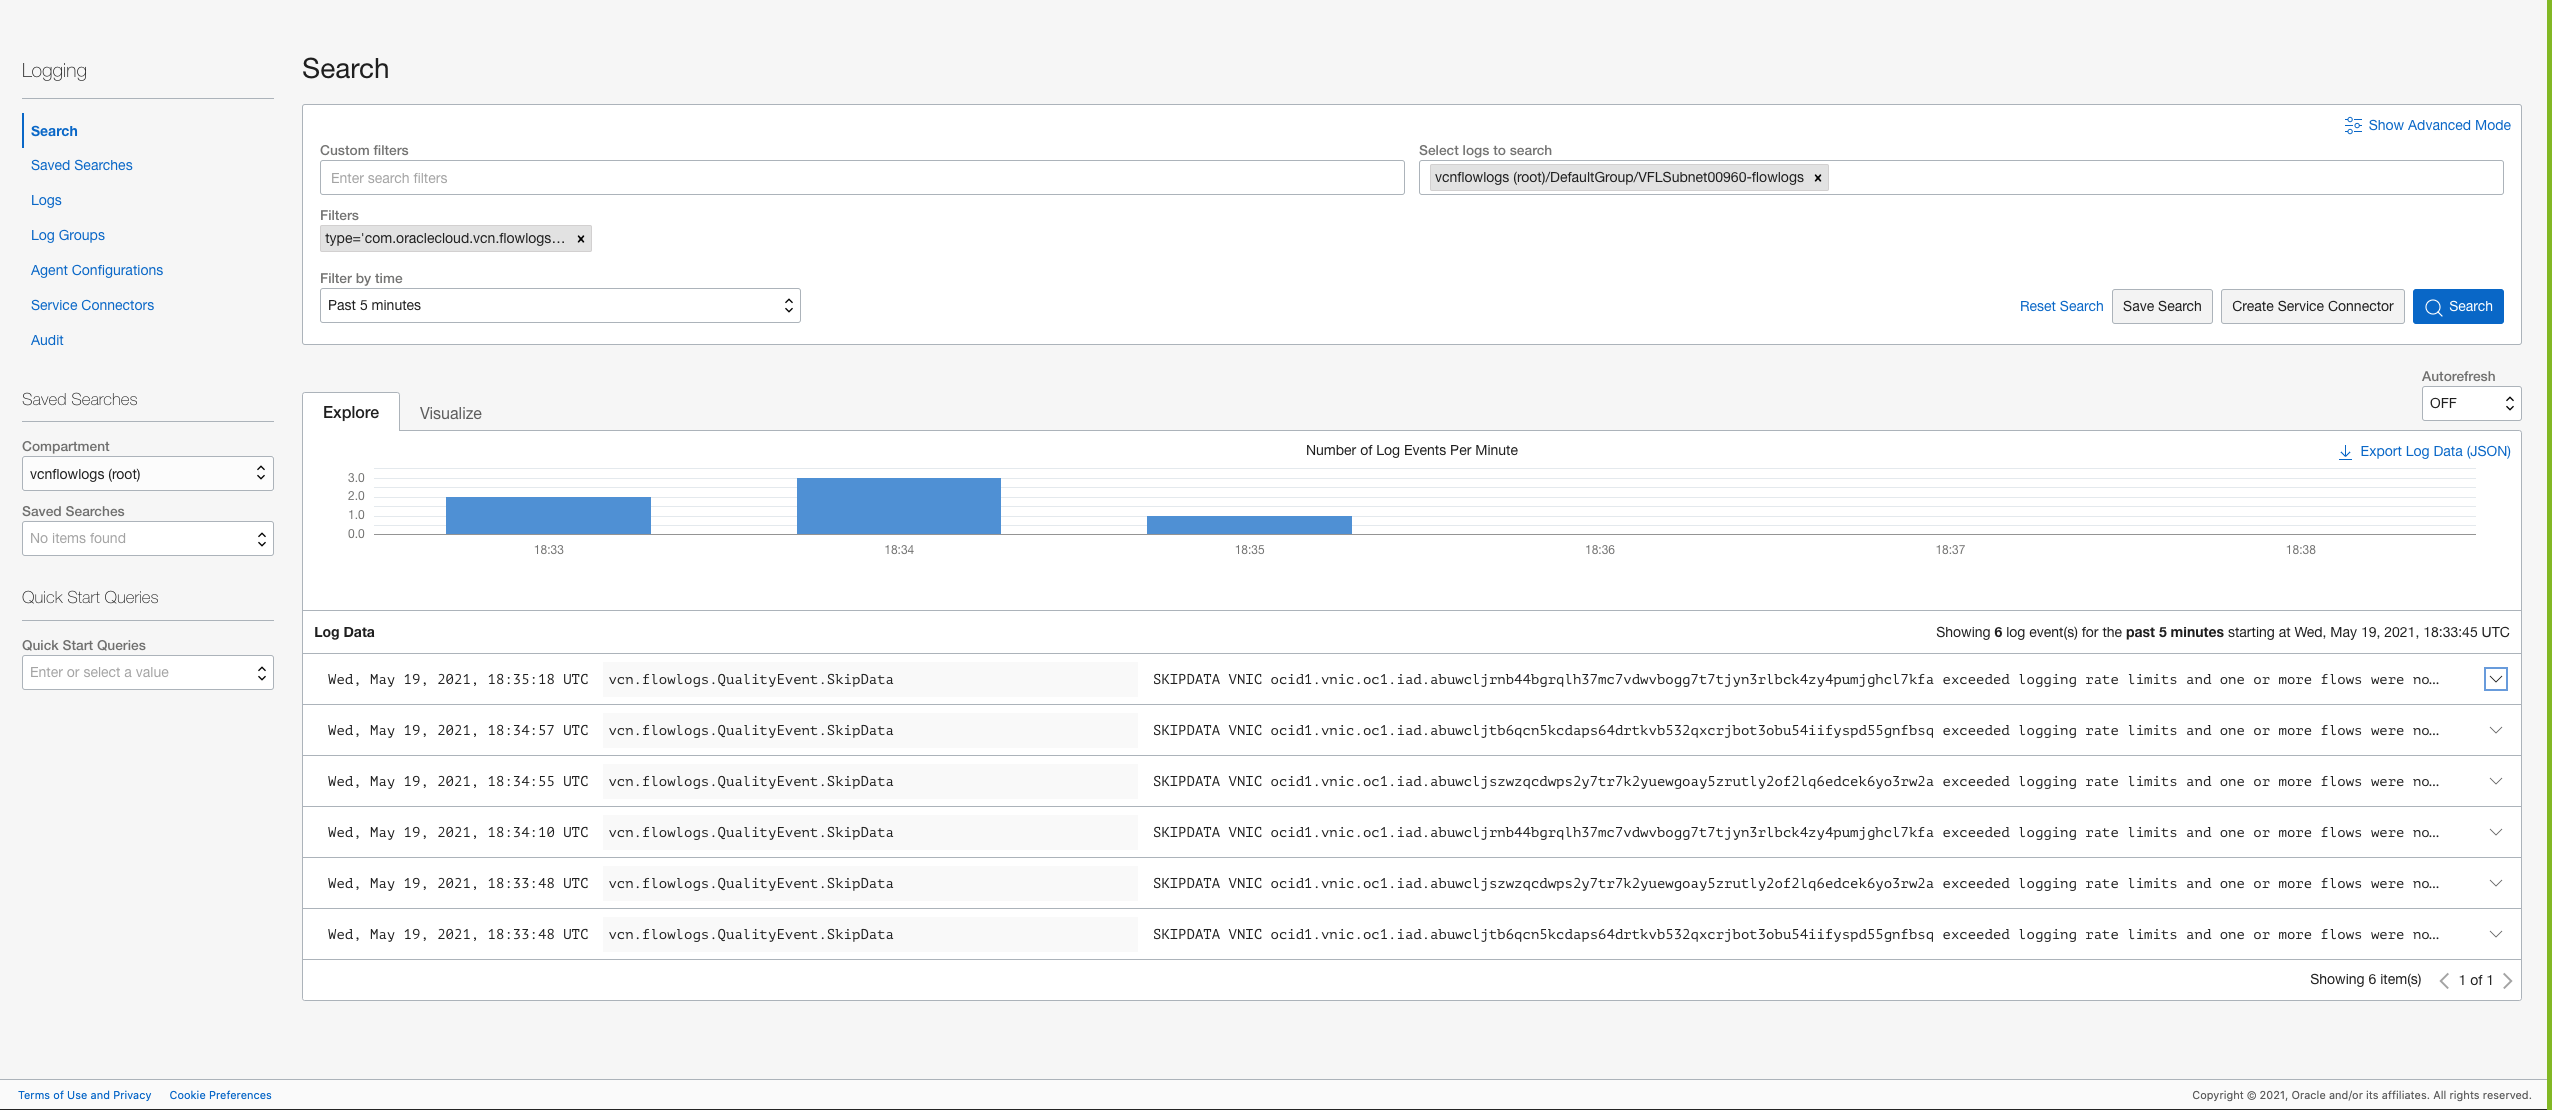
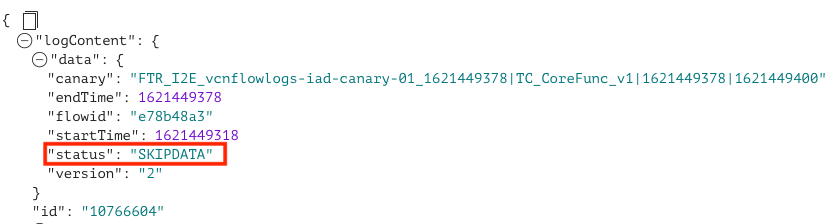
As MuShop grows, the administrator notices more connections per seconds on their application virtual machines. Flow logs might not log records for all the ‘n’ connections per second made on that resource. To confirm, the administrator notices SKIPDATA flow log records during the aggregation interval for that virtual machine. This skip can happen because of a capacity constraint or an internal error for a resource or a service. In these cases, only data fields endTime, startTime, status, and version are set, and the remaining data fields are set to null. Flow logs capacity is proportional to the size of the instance, and the customers receiving regular skip data might consider increasing the size of the instance.
The following graphics use the custom filter type ‘com.oraclecloud.vcn.flowlogs.QualityEvent.SkipData.’
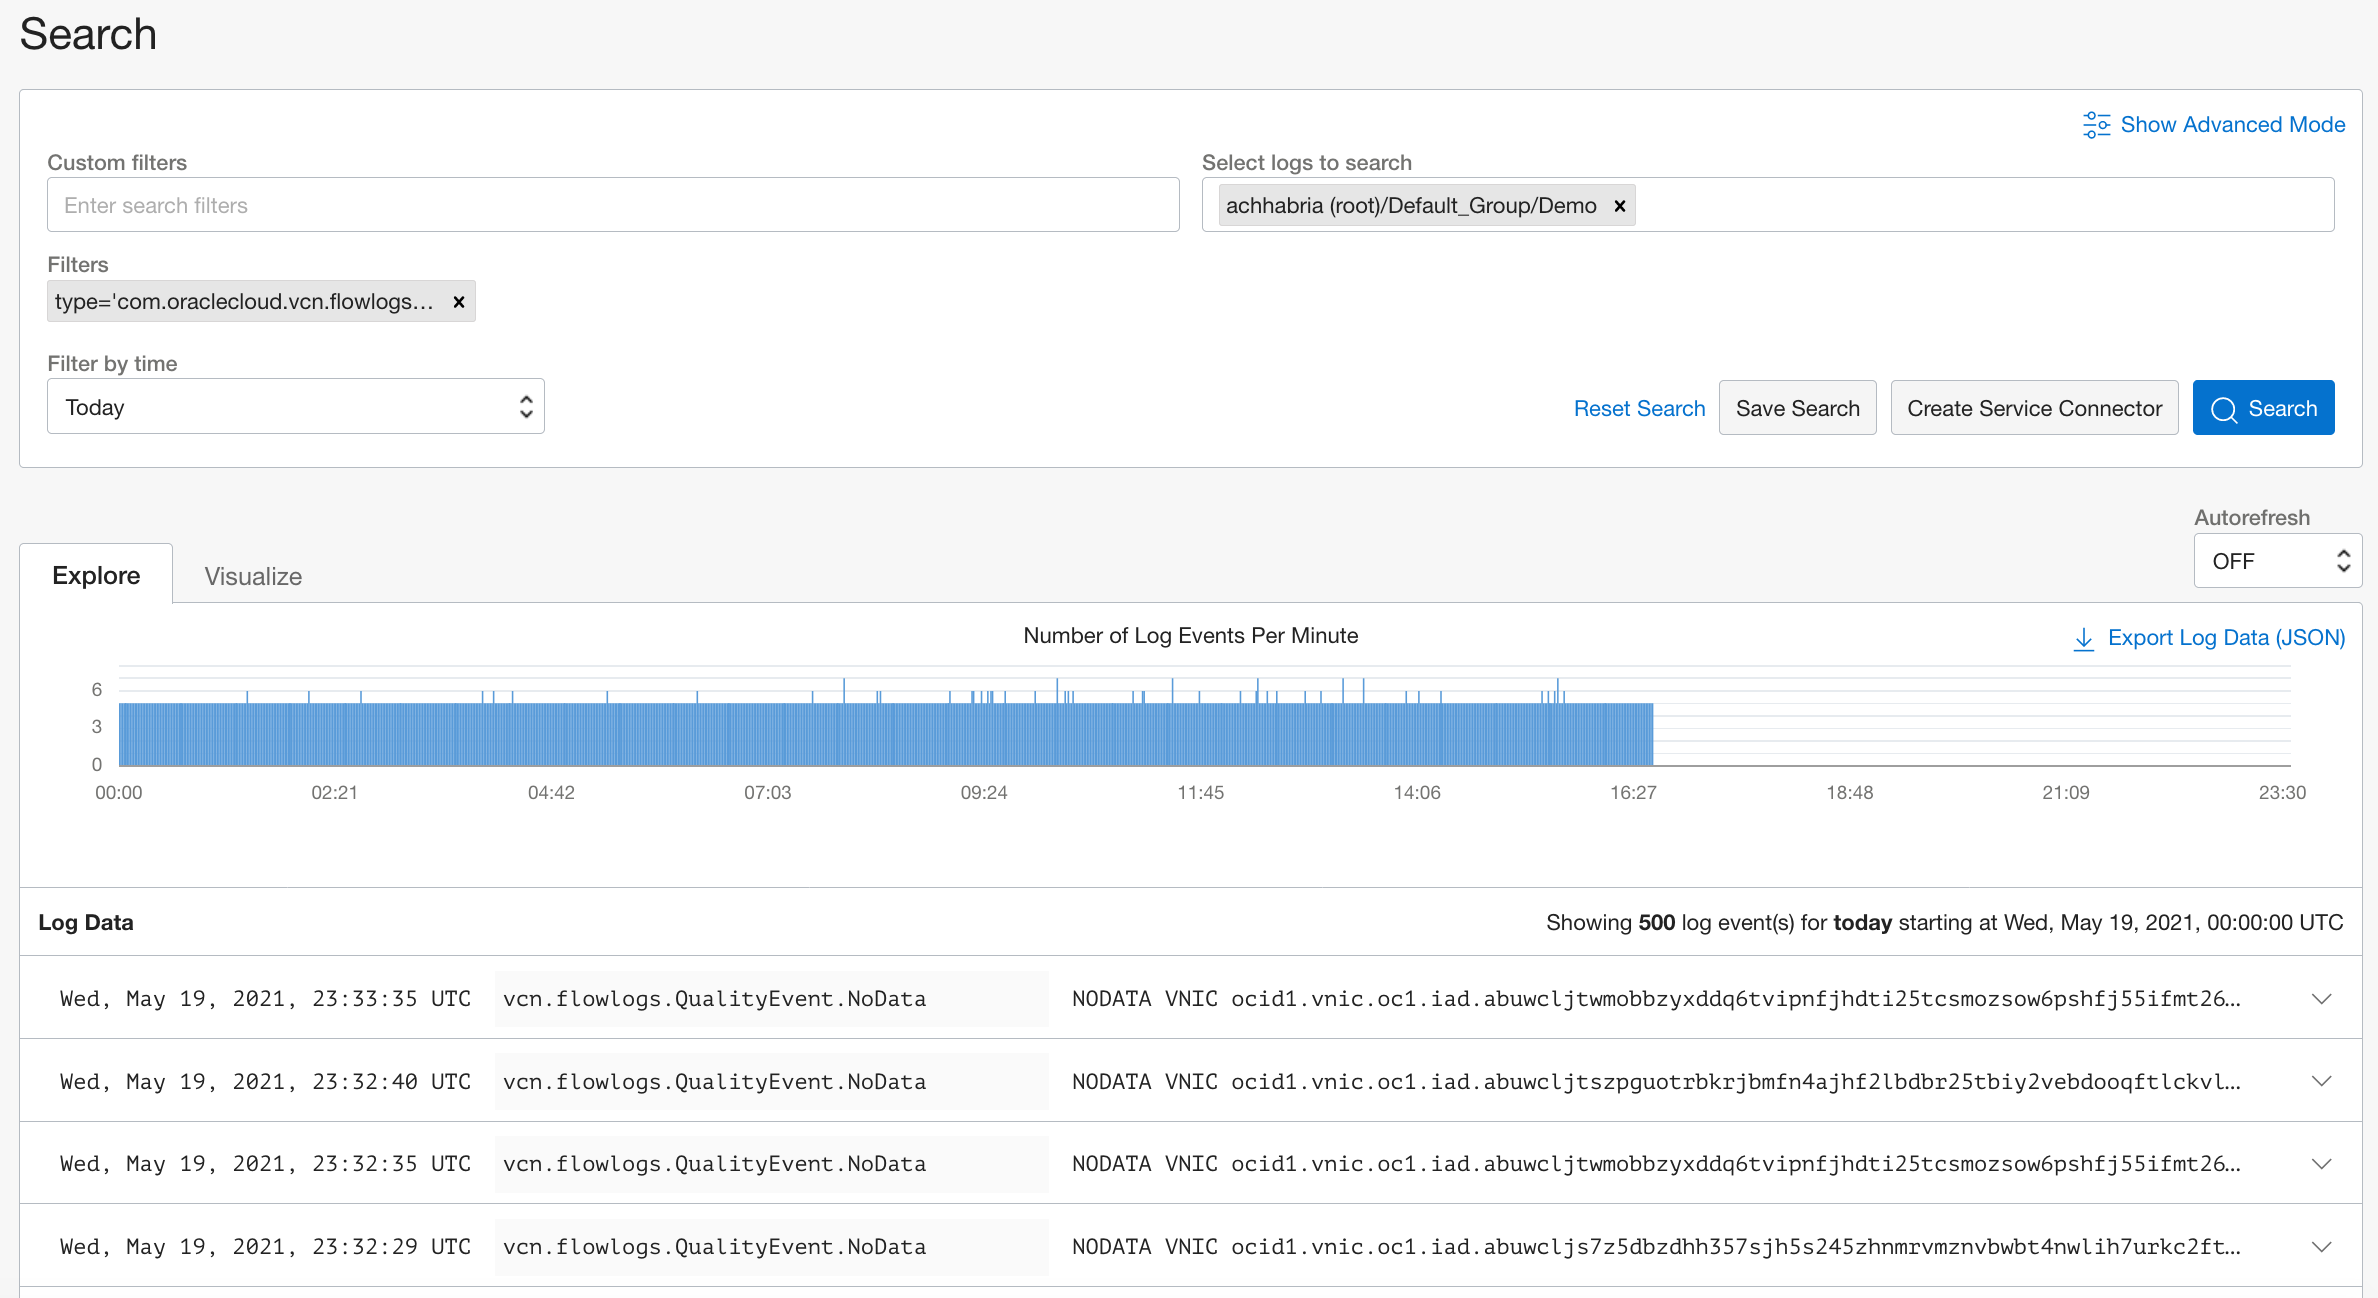
The MuShop developer decides to run hundreds of thousands of batch computing jobs on OCI. They notice that these jobs have been failing repeatedly after an hour. Even flow logs have been recording NODATA logs around the same time frame. NODATA records are seen when no network traffic moves to or from the network interface during the aggregation interval. These NODATA logs give the developer a quick confirmation that something isn’t right in their job running environment. It also confirms that no packet is received by the VNIC of the Compute instance running these jobs. The following example uses the custom filter type ‘com.oraclecloud.vcn.flowlogs.QualityEvent.NoData.’

Real-time diagnostics and insight
Flow logs are captured in real time but might take a few minutes to appear in the OCI Console. For real-time packet analysis, you can augment these logs by running a packet-capture tool like tcpdump and viewing the packets in wire-shark. If you want further insights on your logs, OCI Logging Analytics service lets you index, enrich, aggregate, explore, search, analyze, correlate, visualize, and monitor all log data from your applications and system infrastructure. If you want to move your logs from Logging to services such as Object Storage, Streaming, and Monitoring for extra processing and compliance storage needs, you can create a service connector.
Conclusion
It can be challenging to ensure that your Oracle Cloud Infrastructure environment allows only intended traffic and is as secure and manageable as possible. In this blog, we explained the difference between a flow and a session and showed how easy it was for the MuShop administrator and developer to set up and use Oracle’s flow logs to analyze subnet traffic, detect anomalies, troubleshooting, and diagnosing connectivity issues. For more information about flow logs, check out our documentation.