Introducing Stack Monitoring’s Enterprise summary! Stack Monitoring is an Oracle Cloud Infrastructure (OCI) Observability and Management solution. Spend less time searching for problems and let Stack Monitoring help identify problems. Stack Monitoring’s Enterprise summary highlights areas of concern across an IT landscape, whether hosted within OCI, on-premises or another cloud. Stack Monitoring’s Enterprise summary provides key performance metrics to help identify the worst-performing or highest-utilized systems in an enterprise.
Resource outages and open alarms across the enterprise
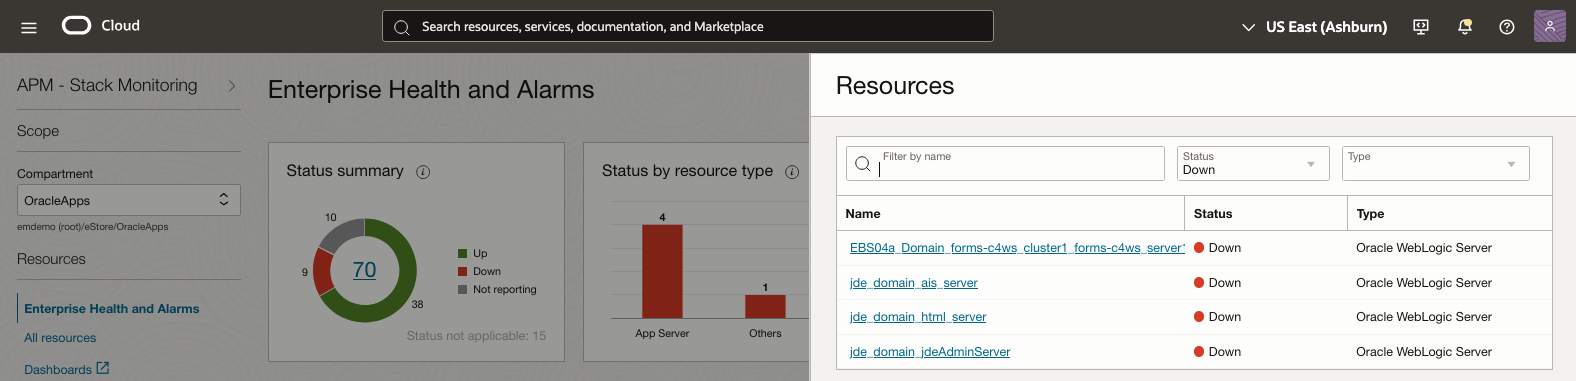
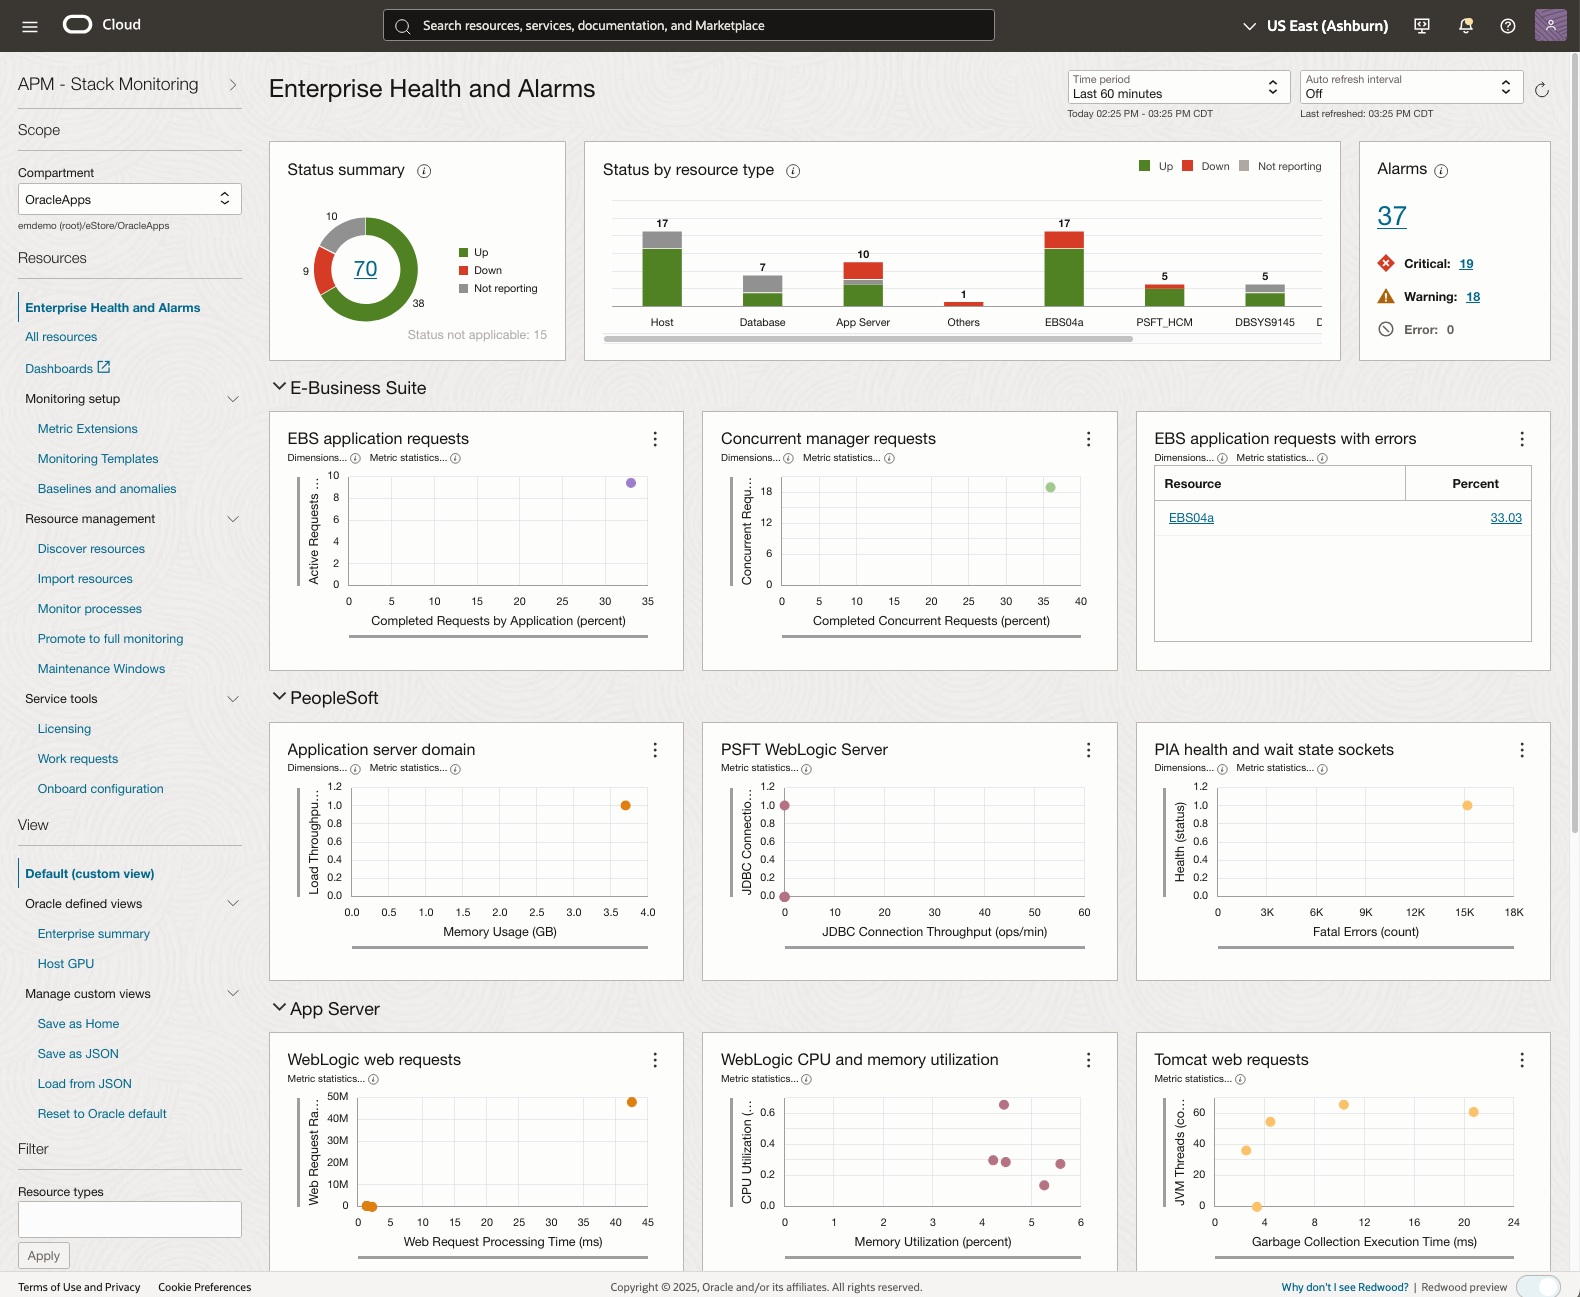
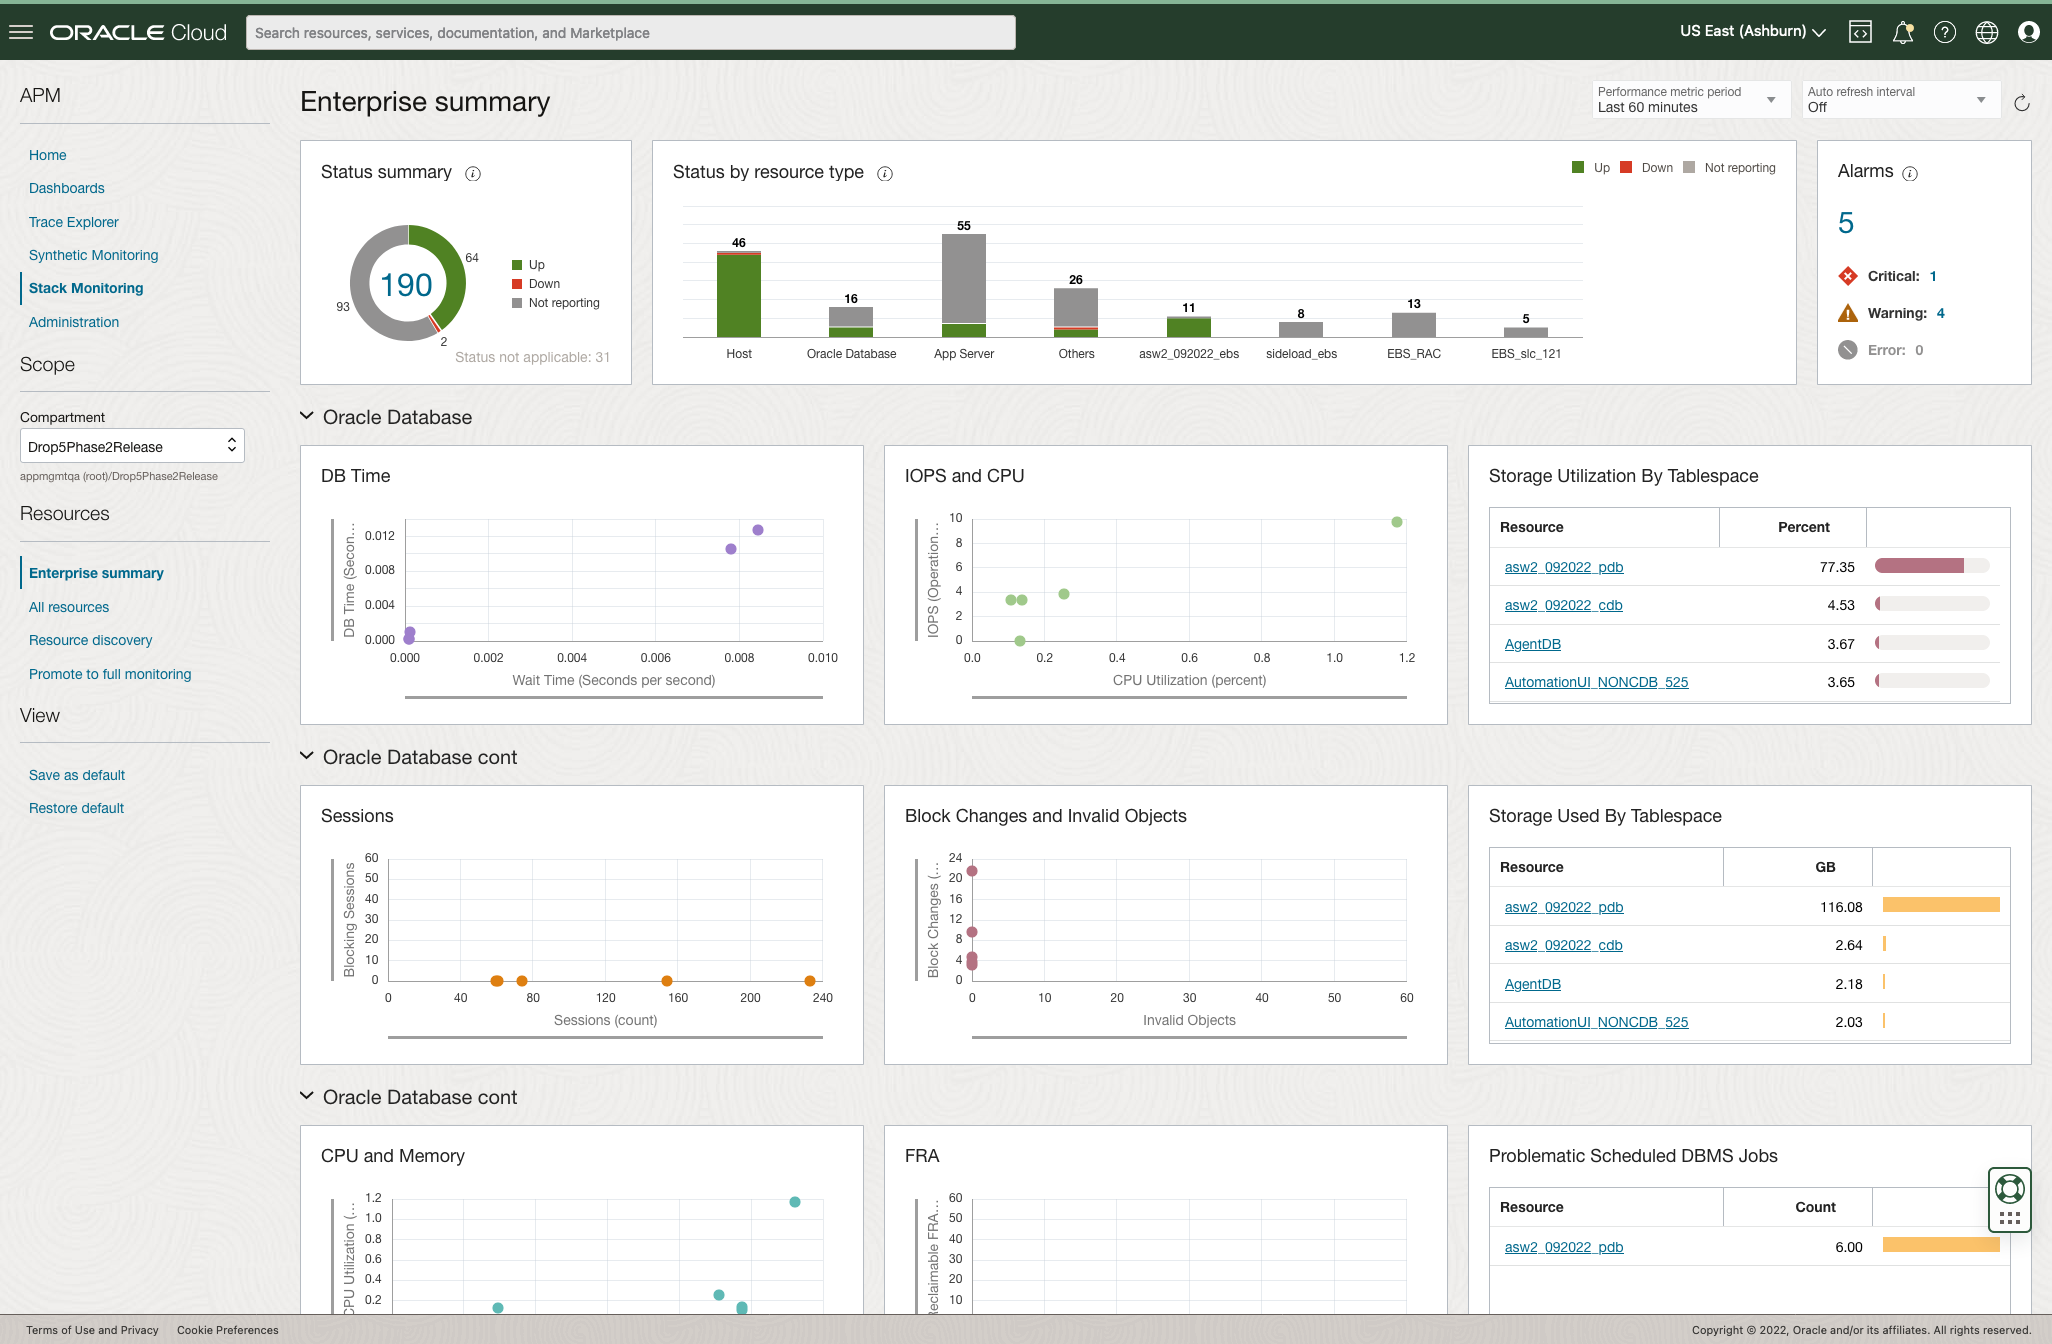
Using the Status Summary, DevOps engineers can quickly identify resources in a Down or Not reporting state that may require immediate attention. Selecting Down invokes a slide-out, with a list of all resources that are down within the enterprise. The slide-out allows the user to easily update the list from Down to Not reporting or enter a resource name in the search field to review the status of a specific resource regardless of the resource type. Clicking the name of the resource navigates the user to the resource’s homepage to investigate further.
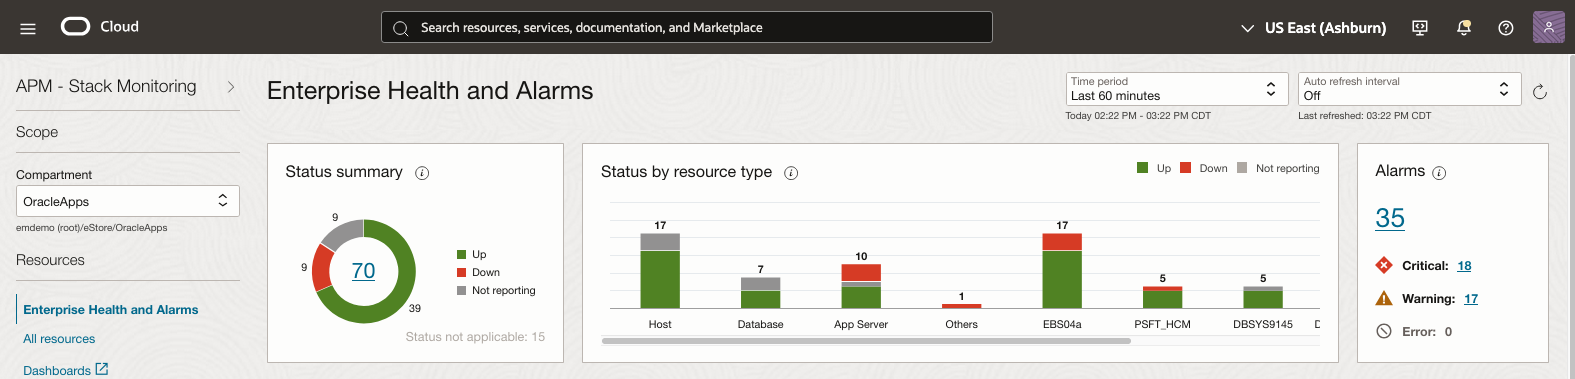
Status by Resource Type organizes resources by type and status across the enterprise. Clicking down within the legend updates the chart showing a count of resources in a down state by resource type. DevOps engineers can quickly identify how many resources and of which types are down.
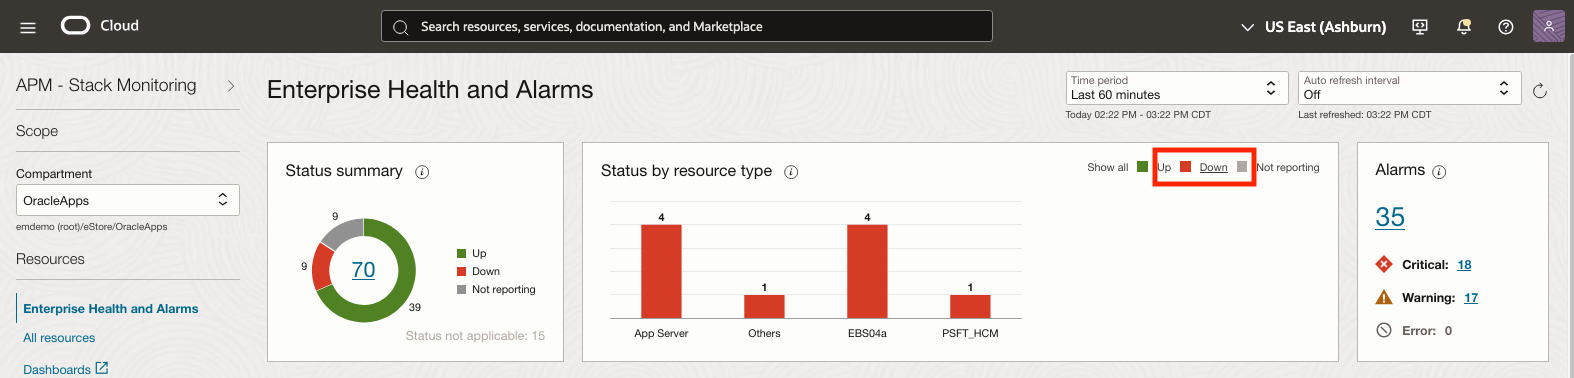
Clicking a specific resource bar, such as host will invoke a slide-out providing a list of all hosts in a down state. From within the slide-out, clicking a resource name will once again navigate to the resource’s homepage allowing for further investigation. The engineer can modify their search at any time to quickly find the resources important to them.
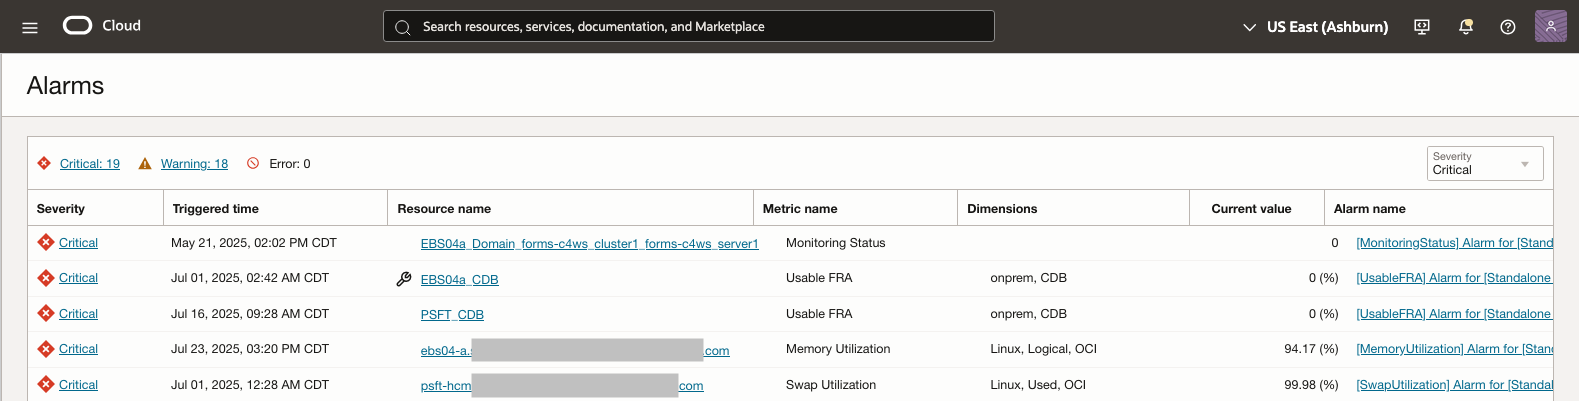
Stack Monitoring makes it easy to review open alarms within an enterprise. The Alarm summary provides a total count of open alarms and alarm count by severity. Clicking a count of alarms, (e.g. Critical, Warning, Error, Total) will open a slide-out panel and provide additional context to the count of open alarms, such as name and triggered time. Clicking an alarm name will open a new tab within the OCI Notification service with more details regarding the alarm.
Key Performance Metrics across the enterprise
Stack Monitoring provides critical insight into the performance of applications and the resources the application runs on. The Enterprise summary leverages key performance metrics to highlight possible areas of concern across the enterprise. These metrics are organized by resource type or tier. The tiers are ordered as they appear in a typical application stack, with overall application metrics at the top and host metrics at the bottom. These tiers include E-Business Suite (application-specific metrics), WebLogic Server (application server), Oracle Database (database), and host. This allows the engineers to work down the Enterprise summary page just as an engineer would investigate an application stack. Each of the charts and tables provides the heaviest utilized and/or worst performing resources.
The Application tier, highlighting E-Business Suite applications
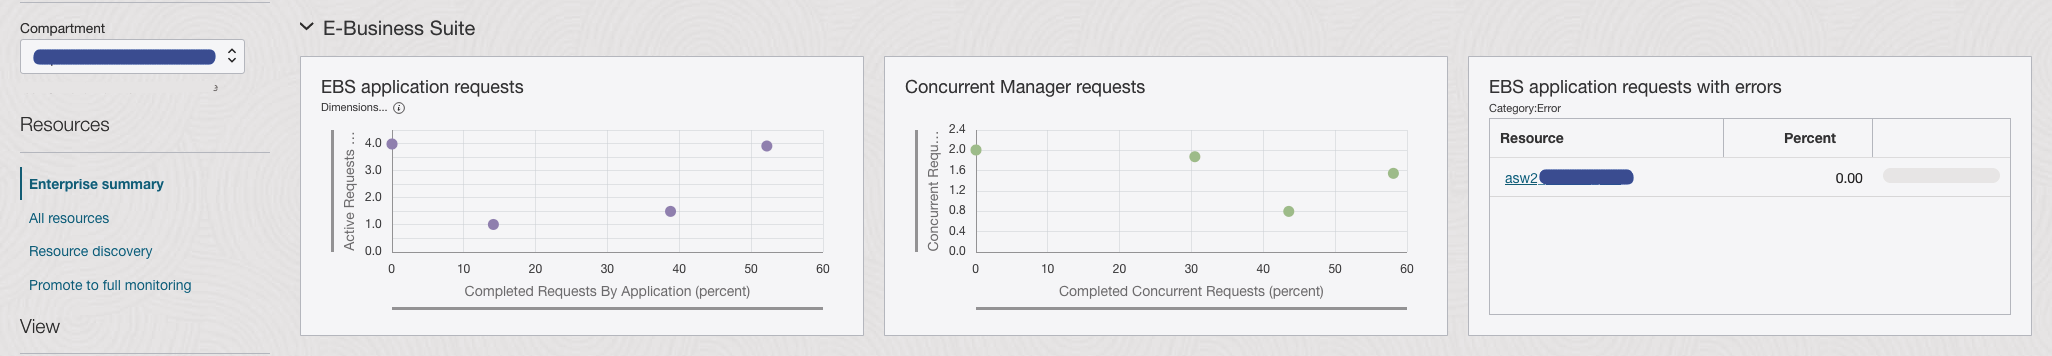
The top tier contains metrics relating to the overall health and performance of E-Business Suite (EBS) applications. Engineers can use the metrics in this tier to view the overall performance of EBS and its components such as Concurrent Manager. For example, the metrics provide a general perspective into the health of the EBS applications and determine which EBS applications have the highest percentage of completed requests with errors. This allows engineers to quickly identify if a particular EBS application is performing differently than other EBS applications in their enterprise.
Dynamic troubleshooting any resource at any time
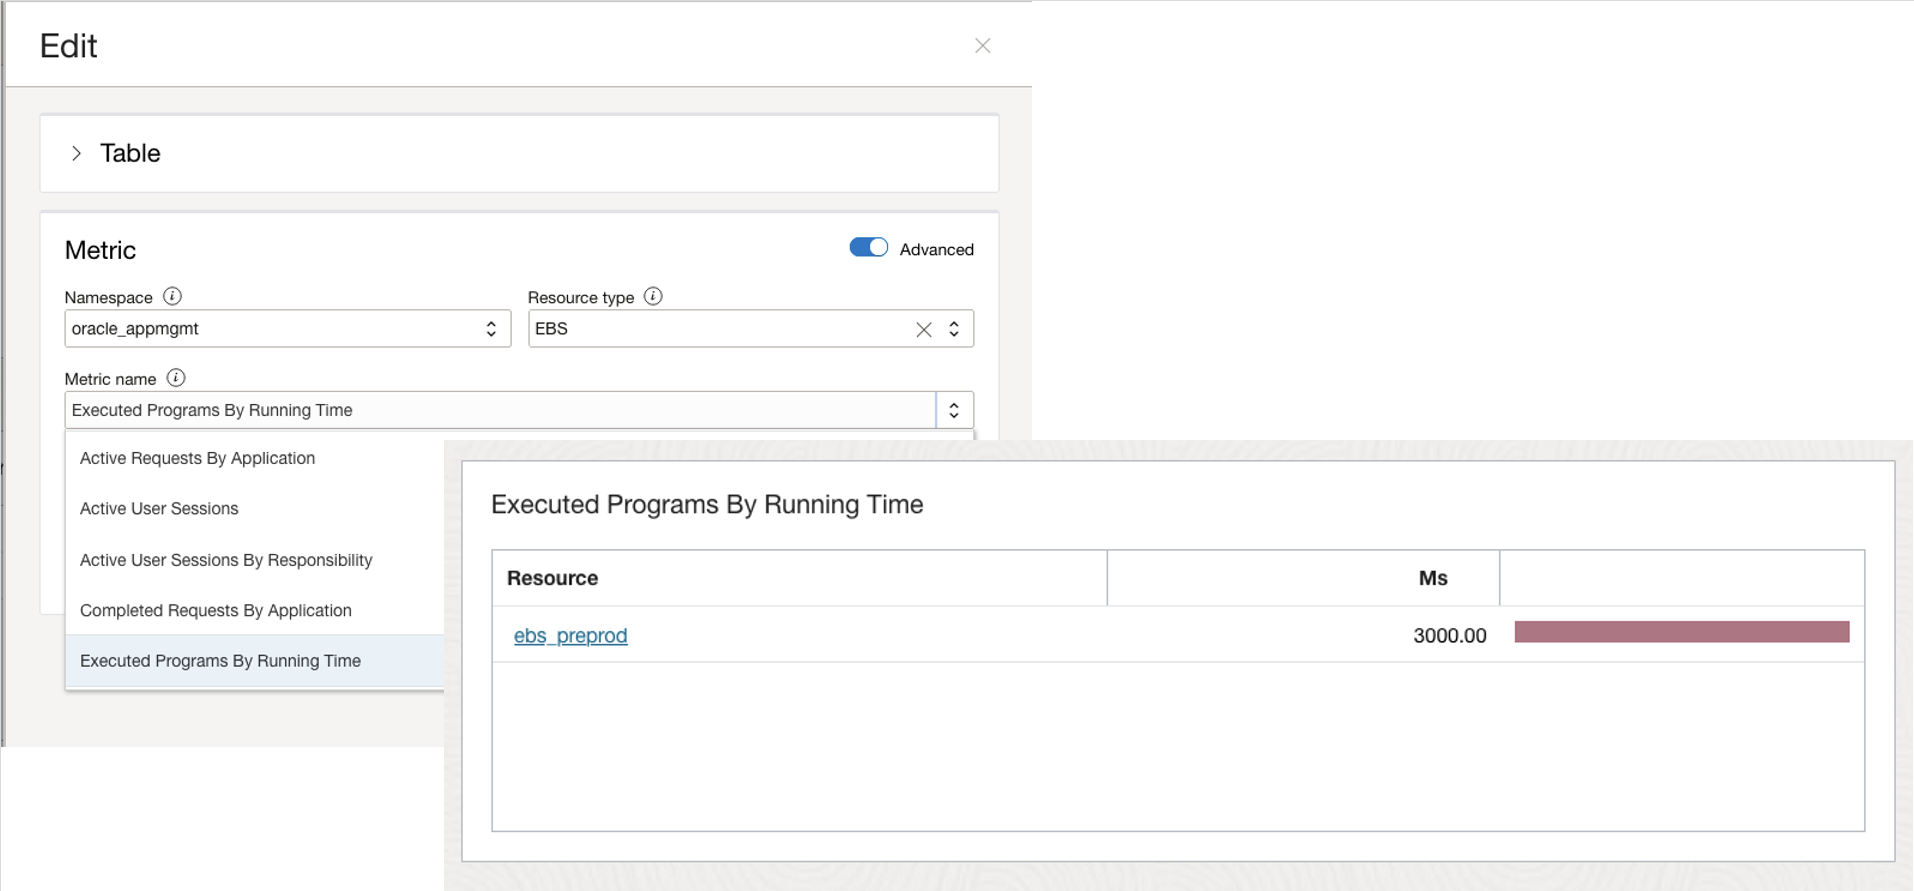
Time is money when troubleshooting performance problems and outages. DevOps engineers can dynamically troubleshoot problems across their enterprise on the fly. The updated Enterprise summary allows engineers to update the performance charts and tables to view any other metric to aid in investigations. If the engineers needs to quickly swap out “EBS application requests with errors”, simply click the pencil icon and select a metric such as Executed programs by runtime from the list. The engineer can now view the slowest performing EBS applications in milliseconds across their enterprise.
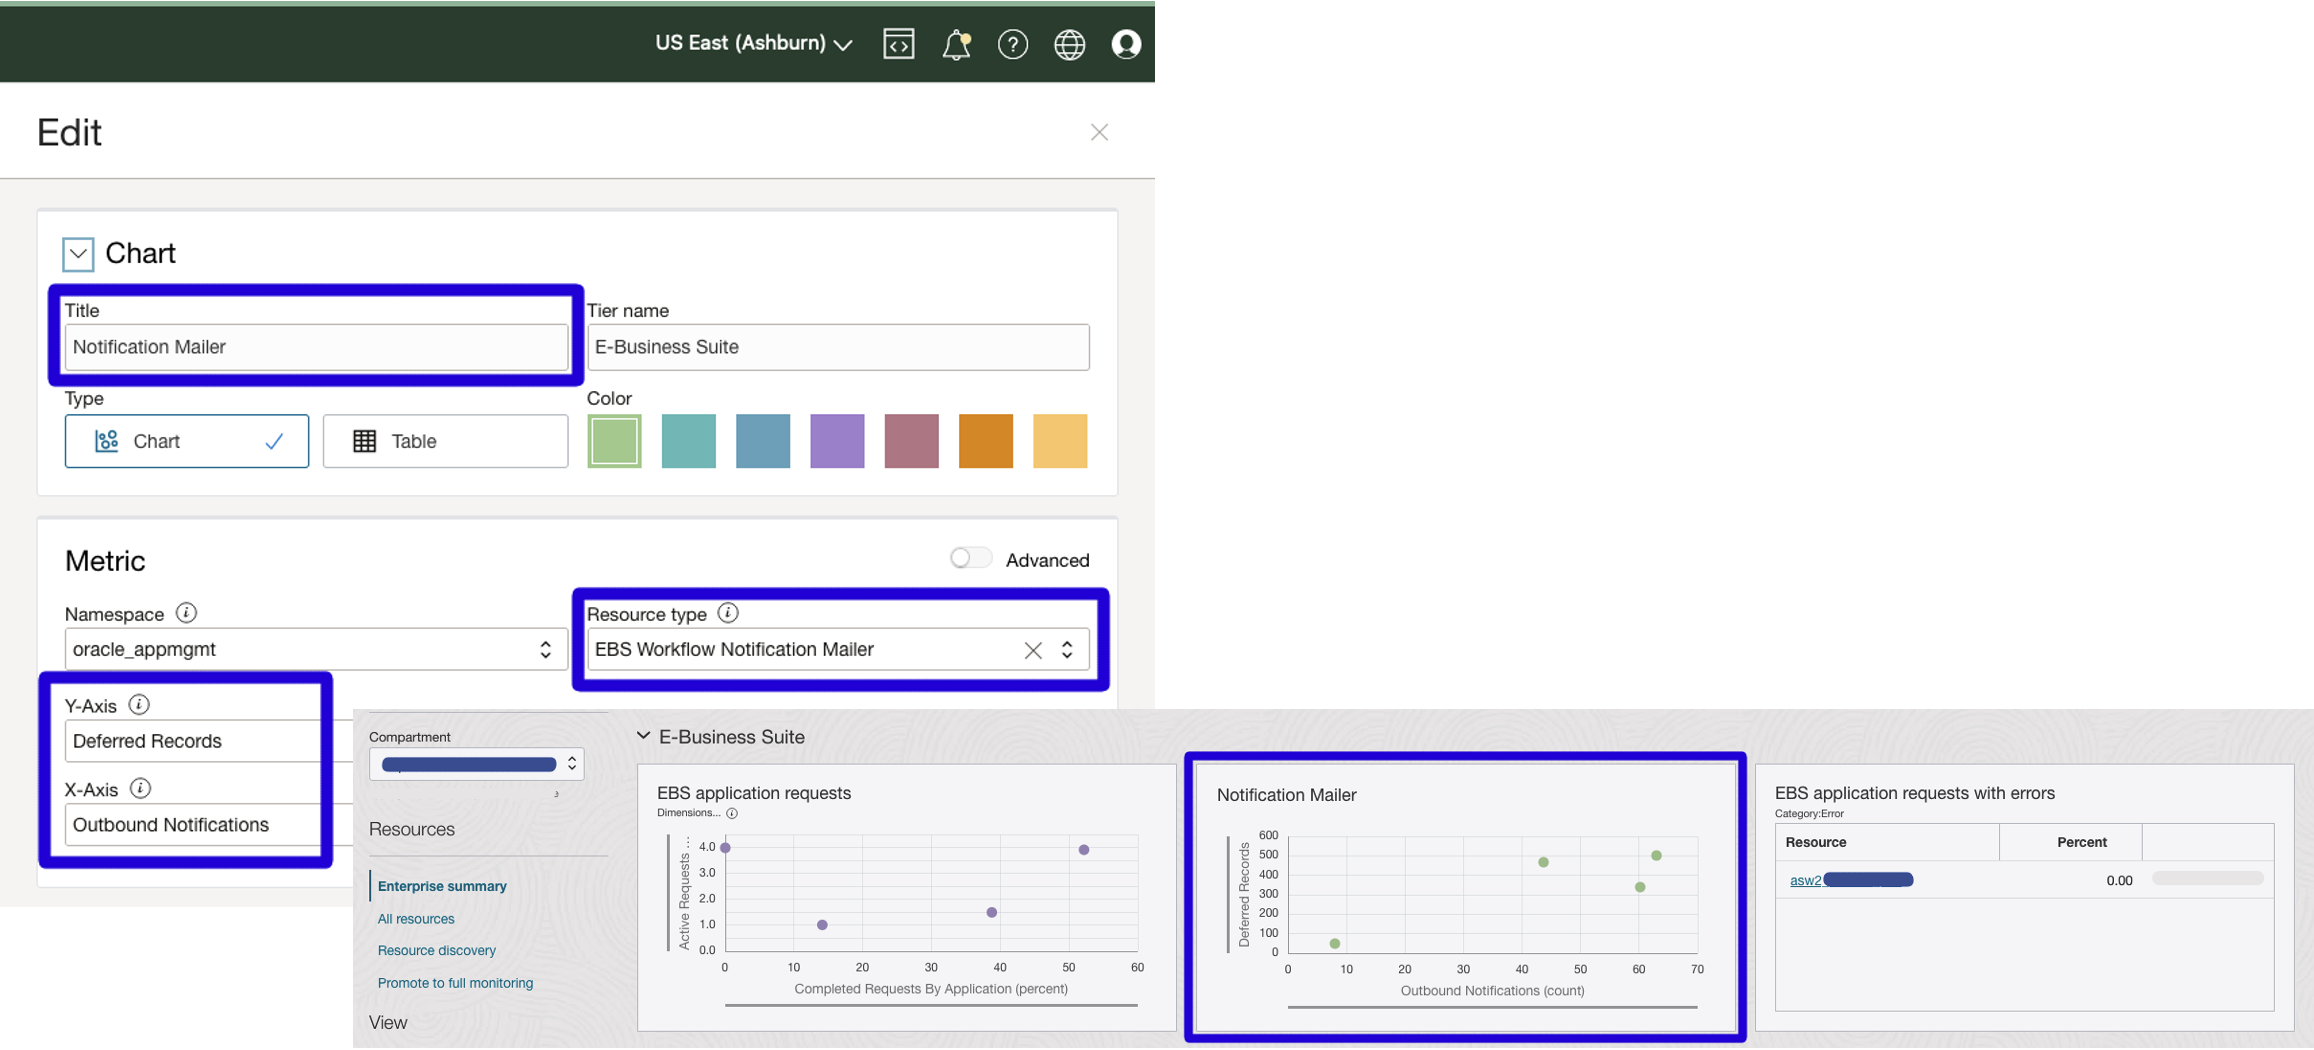
Should an engineer need to investigate the notification mailer instead of the concurrent manager, simply click the pencil icon and update the resource type to Notification Mailer and select the metrics from the list to display. The engineer can review the metrics and investigate for areas of concern. Once the engineer completes their investigation they can either save these metrics as their default, restore the default, or do nothing. If they do nothing, the page will revert to the out-of-the-box settings when the user returns to the Enterprise summary. The metrics the engineer needs when troubleshooting are available any time with just a click.
An Enterprise summary for every role
Out-of-the-box metrics are displayed for various resource types such as WebLogic Server and Oracle Database providing crucial details on the health and performance of the entire enterprise. Knowing users have specific responsibilities when monitoring their enterprise, Stack Monitoring’s personalization allows the Enterprise summary to be tailored to each user’s specific needs. For instance, if the user is a DBA, and prefers to focus on databases, the DBA can simply update the titles, tiers, and metrics and display additional database and/or host metrics that are not already provided. Once the page has been updated, simply click “Save as default” and the Enterprise summary page will always display the updated metrics until the user wishes to restore the default or clears their browser’s cache.
Whether looking to identify resources in a down state or determine outliers in WebLogic Server request processing time, the Enterprise summary provides critical insight into resources in the enterprise that may need investigation. The Enterprise summary brings all resources into a single view no matter where they may be hosted. Reduce time searching for problems and let Stack Monitoring bring issues to you.
Get started today!