In this blog post, we delve into the process of manually instrumenting OpenTelemetry using the OpenTelemetry software developer kits (SDKs). We also harness the capabilities of Oracle Cloud Infrastructure (OCI) Application Performance Monitoring (APM) as our backend to analyze these traces.
OpenTelemetry, or OTel, is a vendor-neutral, open source observability framework for instrumenting, generating, collecting, and exporting telemetry data, such as traces, metrics, logs. As an industry-standard, it’s supported by over 40 observability vendors, integrated by many libraries, services and apps and adopted by end-users.
The OCI APM service provides deep visibility into the performance of applications and provides the ability to diagnose issues quickly to deliver a consistent level of service. This capability includes the monitoring of the multiple components and application logic spread across clients, third-party services, and backend computing tiers, on premises or on the cloud.
This post discusses the following points:
-
The trace pipeline basics and its initialization
-
Configuring resource and span attributes
-
Adding span events
-
Use of semantic conventions
-
Exploring traces using OCI APM
Architecture
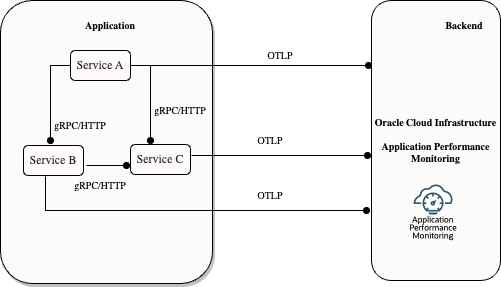
As you can see in this architecture, these application services communicate with each other through HTTP or gRPC protocol, and each service is configured to send the traces directly to OCI APM. The services send traces to APM by OpenTelemetry protocol (OTLP).
OTLP is a general-purpose telemetry data delivery protocol that defines the encoding of telemetry data. The protocol exchanges data between the client and the server. This specification defines how OTLP is implemented over gRPC and HTTP 1.1 transports and specifies the protocol buffers schema used for the payloads. OTLP is a request-response style protocol: The clients send requests, and the server replies with corresponding responses.
Trace pipeline
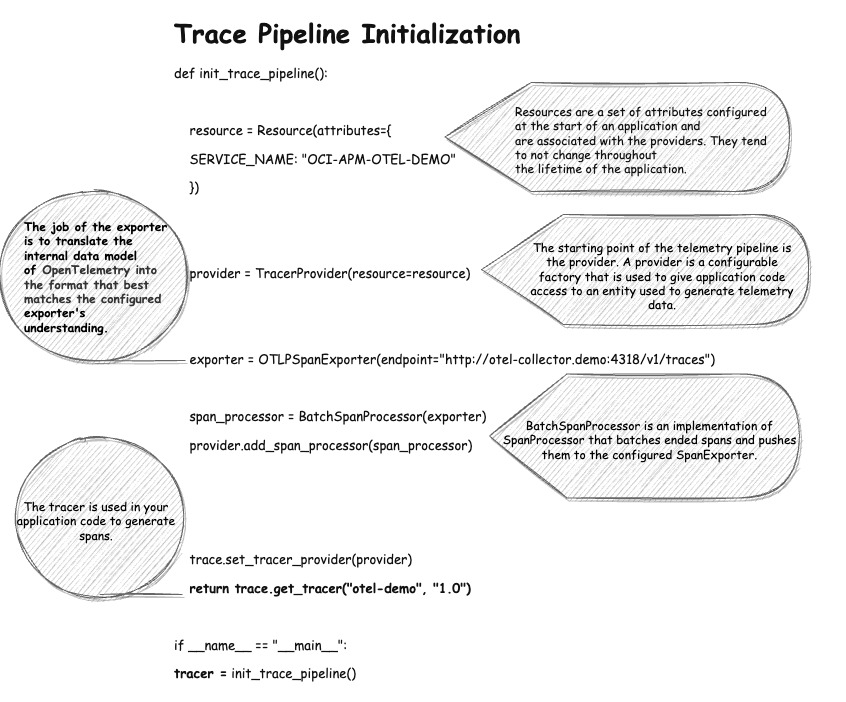
Configuring APM backend
The explanation highlights the details of the exporter when OTel collector is used. If we’re using OCI APM as backend, we need to initialize the OTLPSpanExporter:
exporter = OTLPSpanExporter(endpoint="https://<apm-data-upload-endpoint>.com/20200101/opentelemetry/public/", headers={"authorization": "dataKey <apm-domain-data-key>"})
Refer to the official documentation on configuring OpenTelemetry data sources.
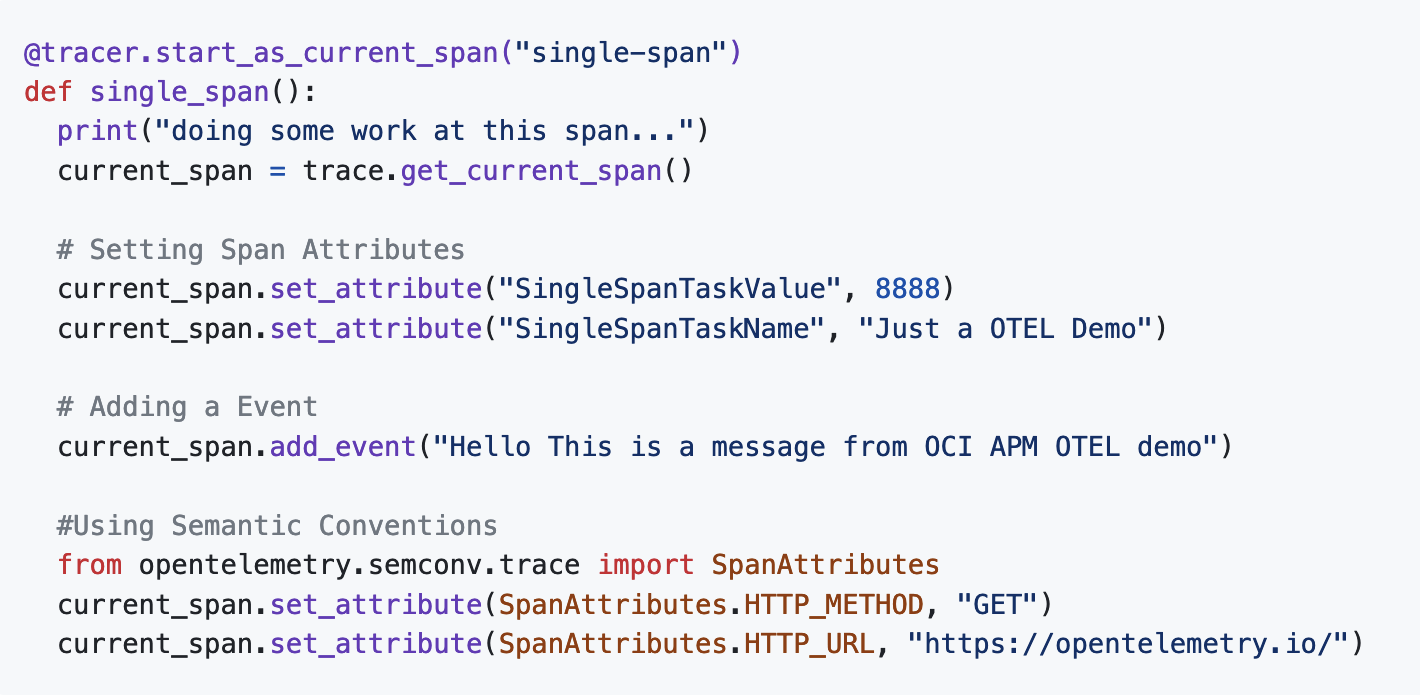
Adding span attributes
First, we use a decorator, which simplifies the span creation and completion. It handles the context propagation. We need to get the current span to be able to set span attributes and events as shown in the following image. We then imported the semantic convention package and used the constants like HTTP_METHOD and HTTP_URL.
Use the example in GitHub to try for yourself. The complete code and more details are available there. Run the following code:
$ cd SingleSpanExample
$ python otel-app.py
Analyze traces using OCI APM
In the Oracle Cloud Console navigation menu, under Observability & Management, select Application Performance Monitoring.
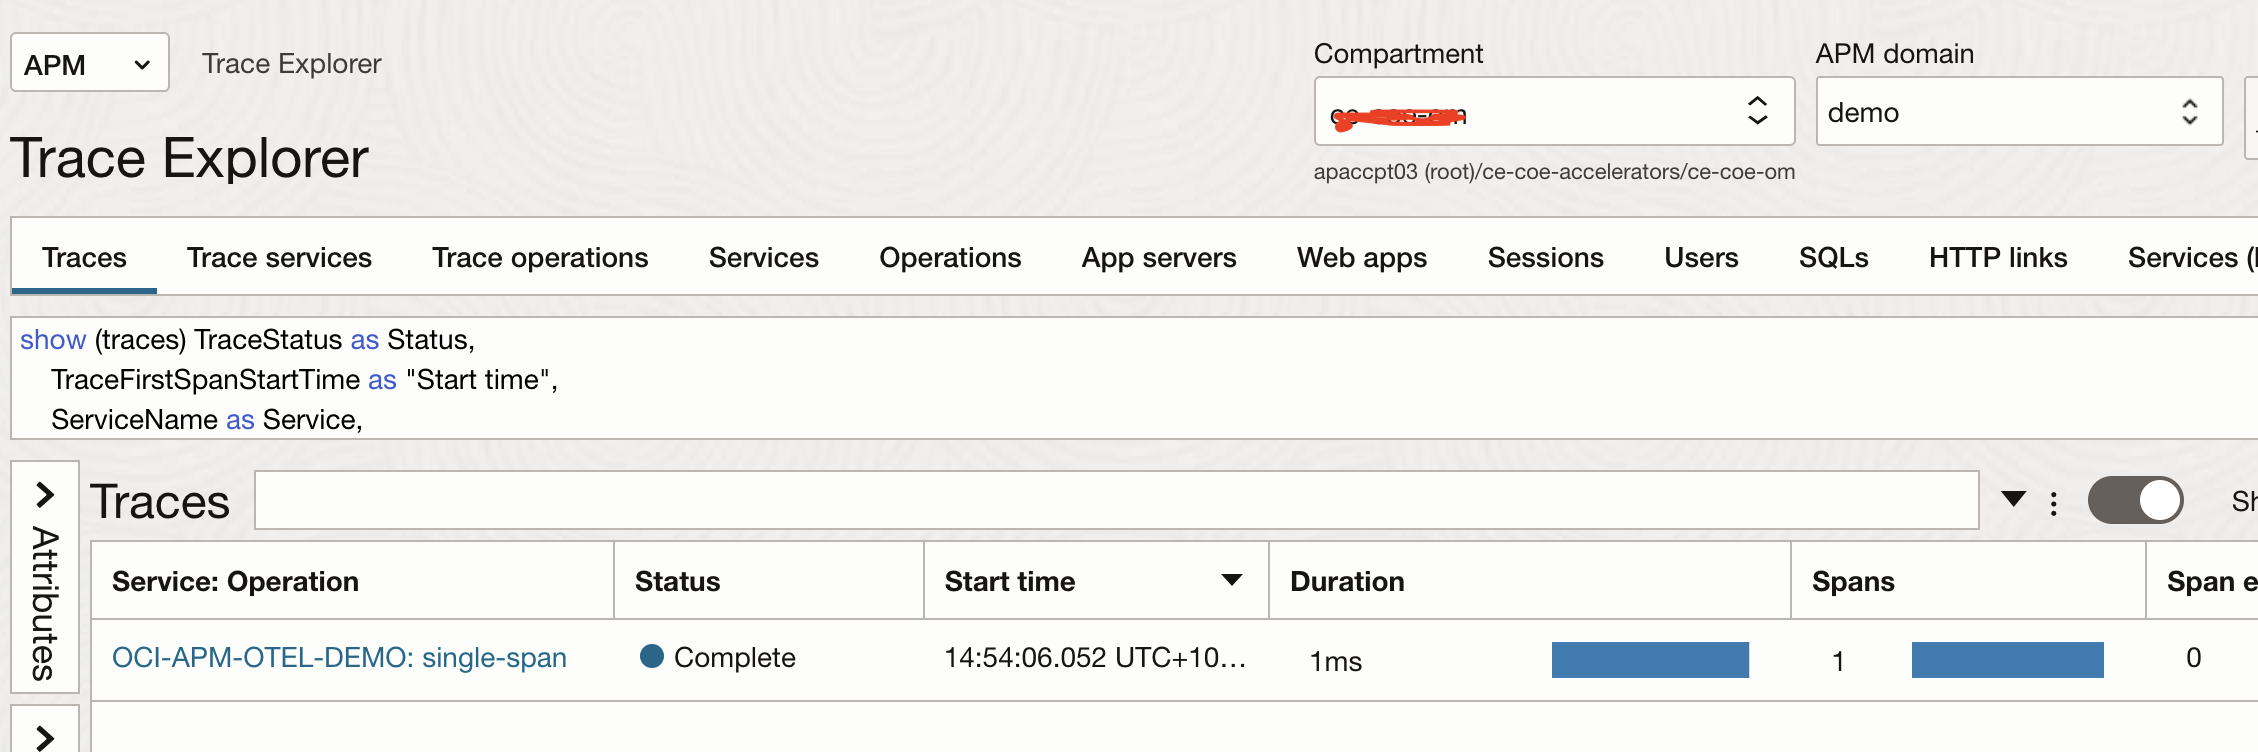
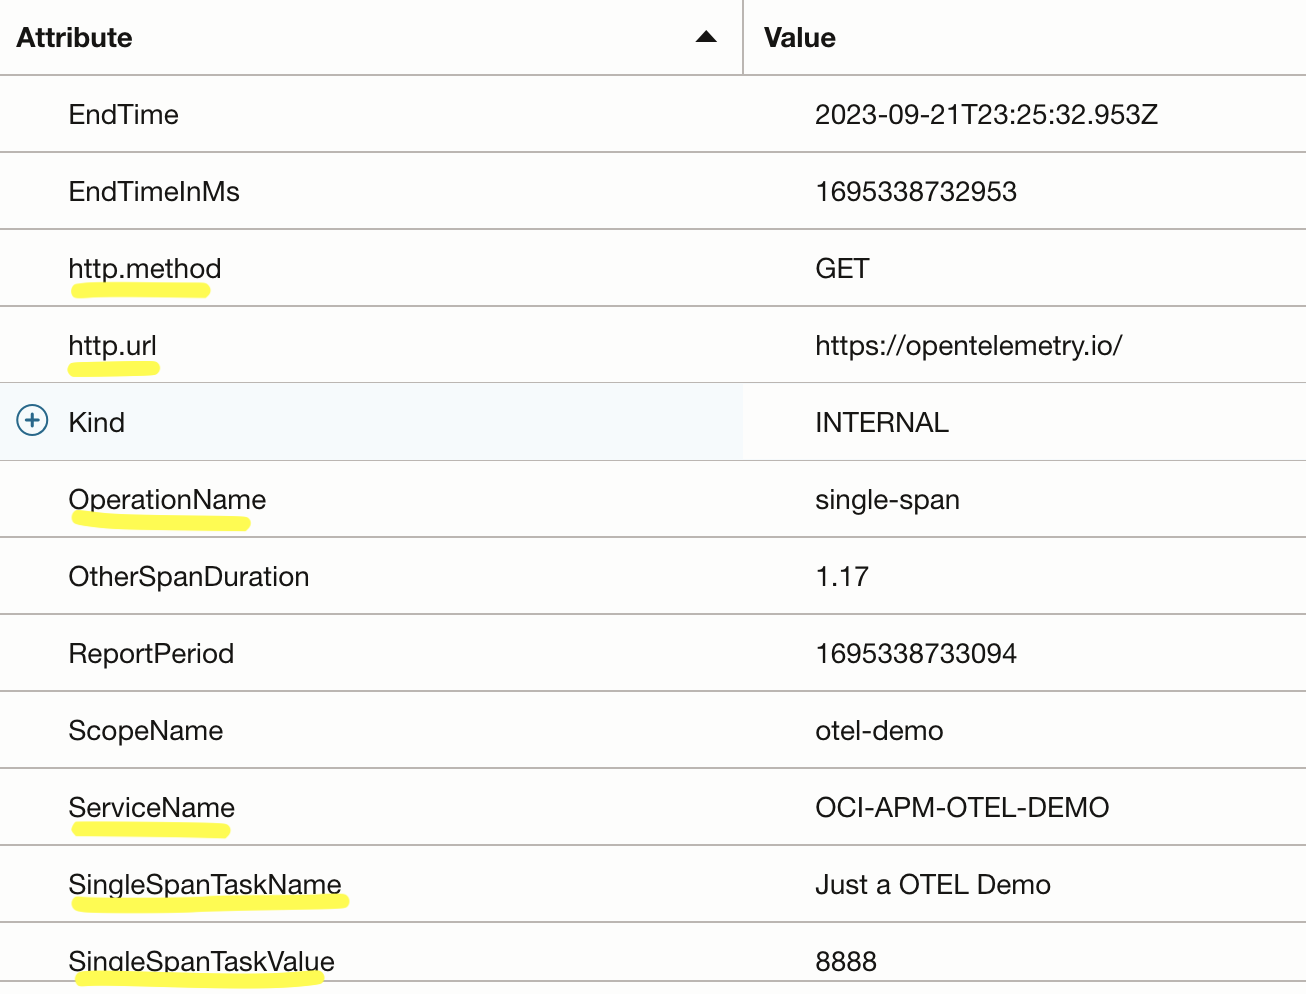
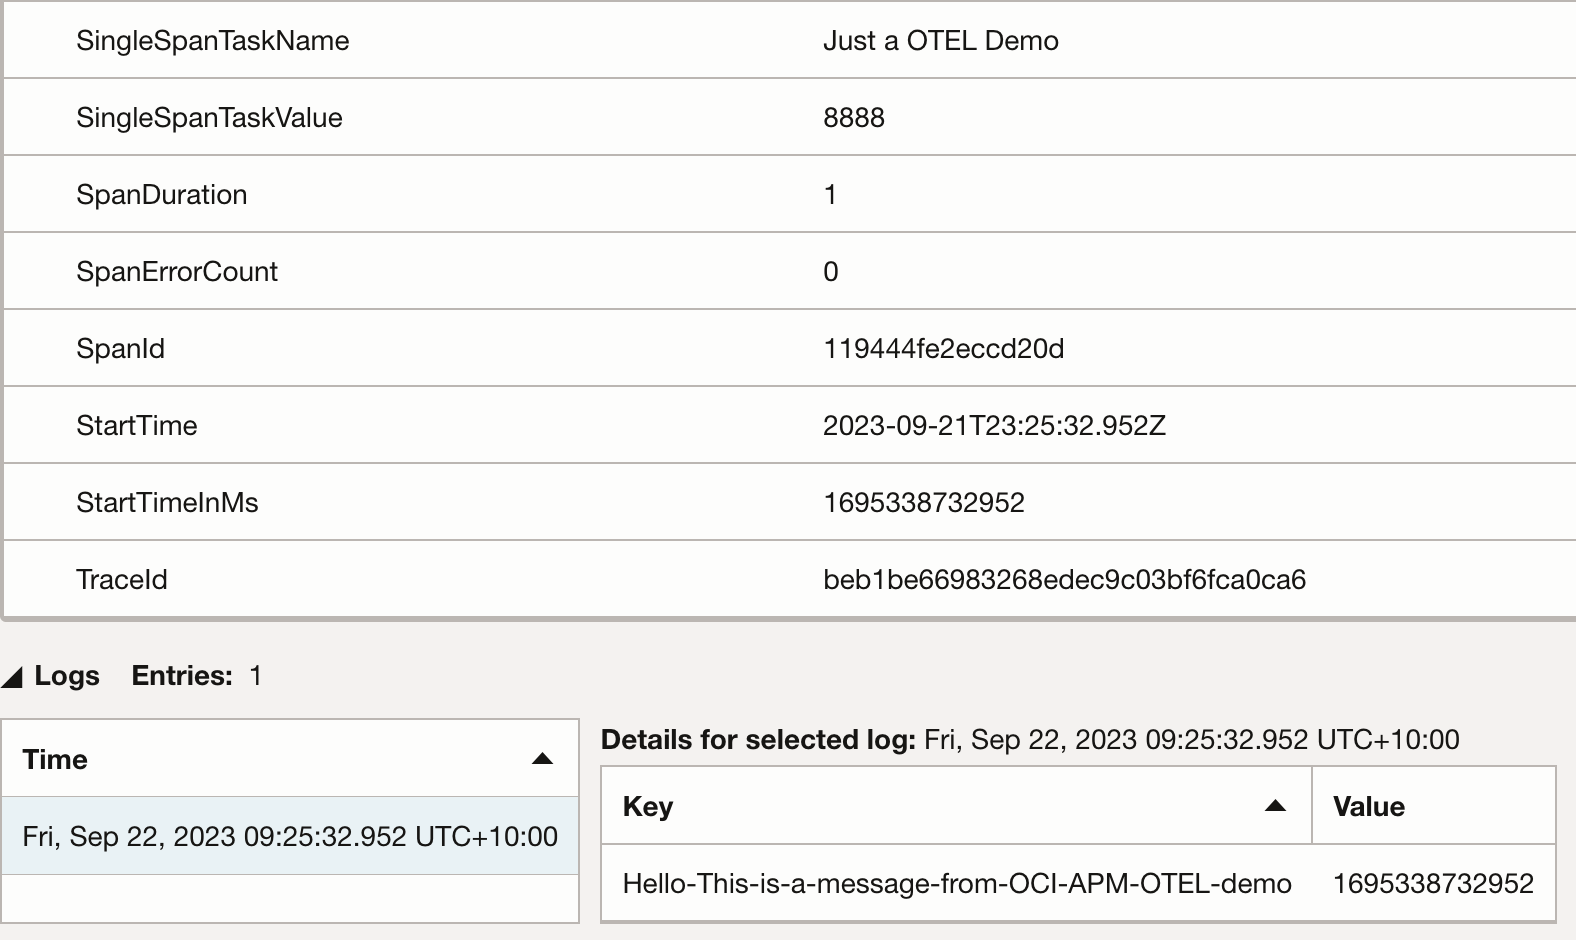
The span attributes that we added are all listed, which we can use to filter traces. The span events are shown under the log entries section. The semantic constants HTTP_URL and HTTP_METHOD are also detected.
You can configure span rules to convert span attributes from OTel naming conventions to APM naming conventions by following the Oracle documentation.
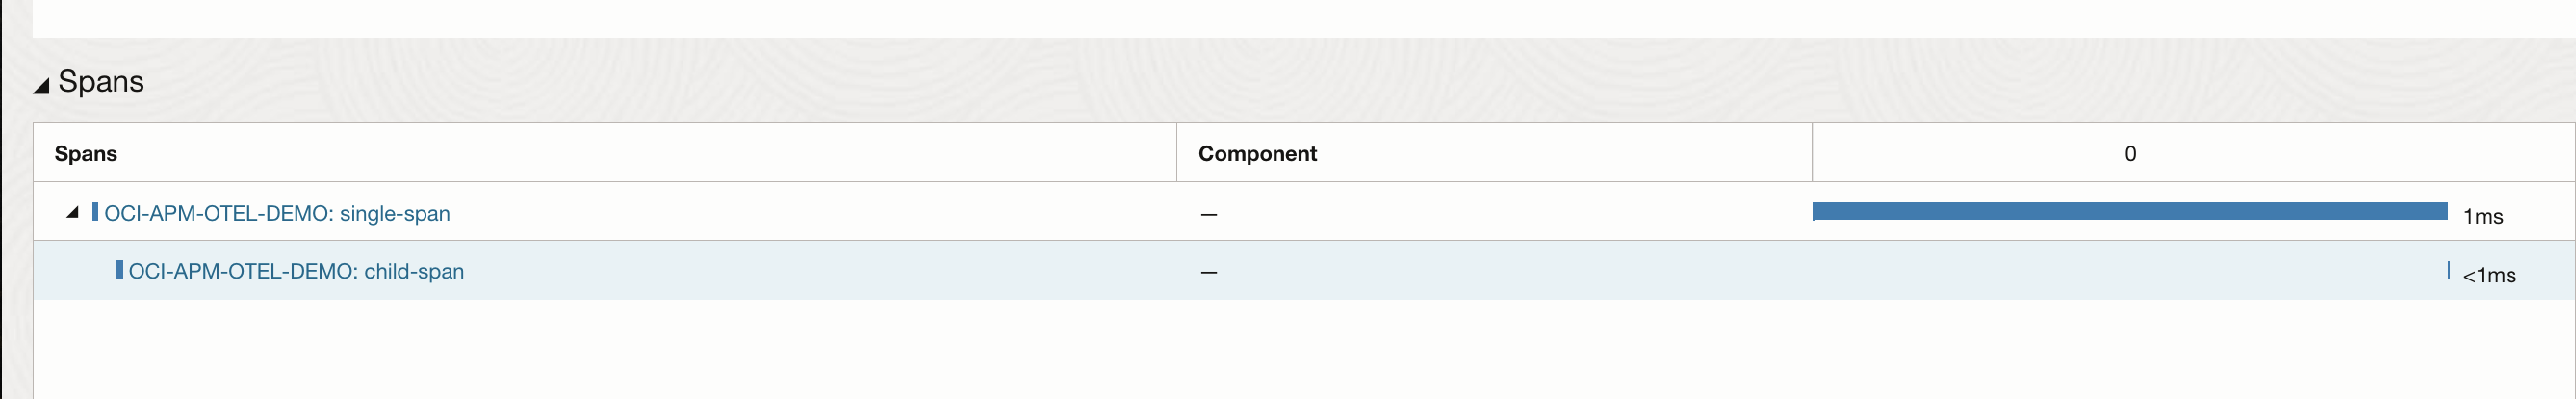
If we want to enhance the code further and add the function, child_span, and call it from inside single_span, we see two spans under one trace:
Conclusion
We delved into the fundamentals of OpenTelemetry, starting with an introduction to its core concepts. We then explored the critical components of OpenTelemetry, including the trace pipeline and its initialization process. We learned how to configure resources and span attributes to fine-tune our tracing capabilities, enhancing our observability. We also investigated span events, understanding their role in providing deeper insights into our applications. Semantic conventions were emphasized as a key aspect, ensuring that our traces are not only comprehensive but also meaningful.
To bring it all together, we explored traces using OCI Application Performance Monitoring, which allowed us to visualize and analyze our traces, gaining valuable insights into the performance and behavior of our applications. We laid a strong foundation for harnessing the power of OpenTelemetry and using OCI APM for effective observability, paving the way for more robust and insightful application monitoring and tracing.
For more information, refer to the Oracle Cloud Infrastructure Application Performance Monitoring documentation, which provides details into what we discussed and more.