How amazing would it be if your financial institution could take advantage of data the same way that Formula One (F1) does? F1 racing and trading risk might not seem immediately related, but they both involve the collection, analysis, and management of large amounts of data to make informed decisions. In this post, we look at a real F1 use case running in Oracle Cloud Infrastructure (OCI) and share a solution for trading risk analysis that we developed for one of our financial services customers.
Risk analysis
Every F1 car contains more than 300 sensors that generate 1 million data points per second. These sensors and other devices collect real-time data about the performance of the car, including speed, acceleration, engine performance, braking, tire temperature, g-forces, and actuation of controls by the driver. This data is transmitted to the team’s engineer, who use it to analyze the car’s performance, optimize equipment, and develop strategies as the driver goes through the race.
Race strategy is developed using risk scenario analysis, which provides a thorough look at a wide range of possible outcomes, including downsides, such as a pit stop that goes wrong, an unexpected competitive behavior, or a technical failure that can occur during the race. With real-time data analytics, the race strategy engineer can understand the risks and opportunities that arise from responding quickly to trends and diagnostic analysis of systems. Racing strategists also run mathematical modeling for each driver and car and a two-car team model against major rivals. As a result, the most successful F1 teams can embrace and manage risk to innovate and drive competitive advantage.
Oracle Red Bull Racing
Like most F1 teams, Oracle Red Bull Racing uses telemetry extensively to make data-driven decisions. Telemetry refers to the real-time transmission of sensor data to the race team so that they can make performance-enhancing, data-driven decisions.
Functional architecture
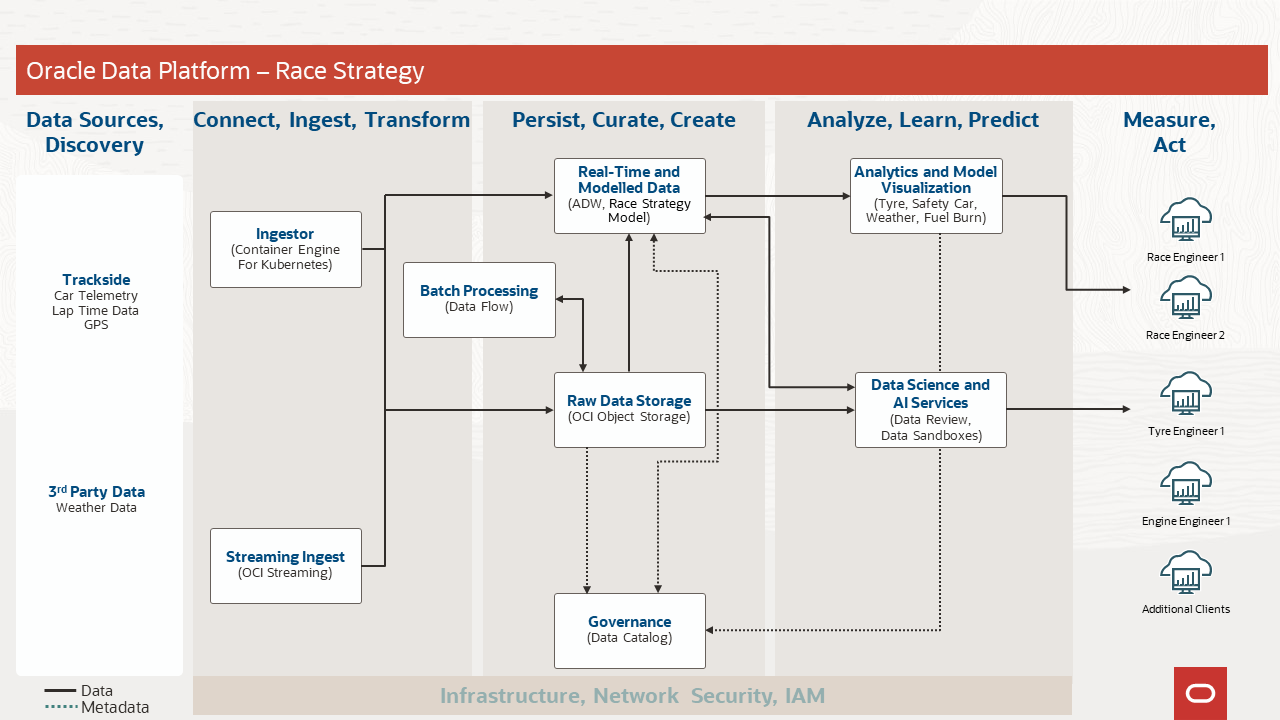
Performance tuning of the car setup
In testing, the race team can measure how the different systems on the car are performing and if they’re behaving as the engineers have predicted, which allows the team to tune the car setup to maximize performance. For instance, the team uses telemetry to measure the car’s slip angle through a corner. Knowing the slip angle and the speed of the car, you can get an idea of how the tires are stressed versus the speed achievable in the corner. To tune equation, the race engineers can change the mechanical suspension setup, camber, toe, ride height, anti-roll bars, and dampers. They make a change and measure the effect in real-time using telemetry to feed back if the change increased performance.
In your financial institution, you can gain benefits by the tuning of your systems. Imagine the process of measuring and feeding critical performance data back but in real-time, allowing you to continually tune your systems for performance.
Reactive monitoring to prevent catastrophic failure of any system
During a race event, telemetry feeds back sensor data to the pits, and any change in the data can be seen. The team can react before catastrophic failure of a system. In this case, many of the engine’s parameters, such as temperatures and pressures, have an optimal operating window. If measurements fall outside their window, the car loses performance. Variables falling too far outside their operating window can lead to catastrophic failure of the entire powertrain and result in a “did not finish” (DNF). Each subsystem of the race car has telemetry data being fed real-time to engineers behind the pit wall. They’re continually monitoring these parameters so the team can react and make changes or ask the driver to change the way they’re driving to maintain performance.
Your financial institution is the same. It needs to be able to measure its performance parameters in real-time as it operates in its changing environment. With telemetry in the cloud, you can react and make changes and performance decisions in real-time.
Proactive modelling for a competitive edge
The race team couples real-time telemetry of the current state of play with historic data, predictive models, and running billions of strategy simulations. The race engineers can proactively alter their race strategy to increase the chance of winning. For example, combine tire stress vs. speed and optimal operating windows: You get the crux of race strategy simulation. The team measures the internal (carcass) temperature and surface temperature of each tire while the car is racing and feed that back to the pits through telemetry.
The engineers plot these variables over time and a trend forms: A warm-up stage, flat plateau, and a steep drop of carcass temperature at the end of tire life. They then compare these temperature curves with lap times and a mathematical model is formed. Changing driving style changes the stress on the tire, which in turn alters the shape of the curve. Environmental factors, track temperature, roughness, and weather also change this curve.
Using historical data of these variables and the real-time telemetry data of the tires, you can begin to predict your increase in lap time, and the tires’ end-of-life. The team then runs billions of simulations using these predictive models, the results of which are fed through real-time telemetry to the strategy engineers. In this way, telemetry of real racecar sensors is augmented by real-time telemetry of modeled race car strategy.
A financial institution can use this same pattern, augmenting risk simulations with predictive models based on historical data, then continually simulating the future, and feeding that data to make strategic decisions immediately.
Continual comparison to strengthen weakness
Race teams also have data, albeit limited, on their competitors. One of the first pieces of data a driver looks at with their race engineer is a speed trace—basically the speed of the car plotted against distance on track. Using the speed traces from the entire grid, you can build a model of the theoretical perfect lap, a lap made up of the fastest sectors from all the drivers. Overlaying this information with their own speed trace, they instantly see strengths and weaknesses in the car and driver’s performance. You can quickly rank the drivers by their variance and consistency lap after lap. Anomalies in their behavior and driving style quickly become apparent. Does consistency drop over time with reduced stamina? Are the anomalies in driving style caused when under pressure from behind. When the driver is told to push, how many laps can they reliably go faster while driving with this heightened focus?
This example is one more way a financial institution can follow what an F1 team does by continually comparing with what data is available from competitors. You can quickly spot deficiencies and anomalies in behaviors and allocate resource decisions properly to turn weakness into strengths.
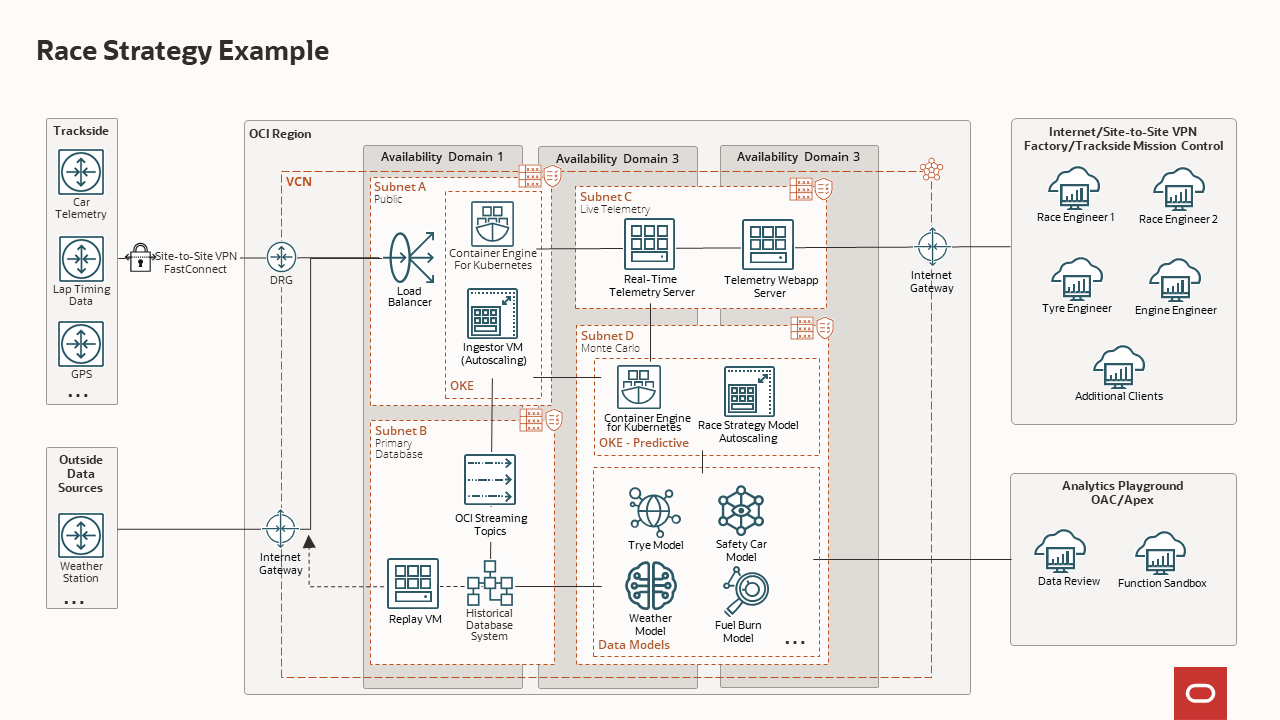
Solution architecture
A financial services use case
Similarly in financial services, risk management involves the use of streaming data to identify patterns and trends that can indicate potential risk. Some organizations are investigating data-driven ways to radically improve their ability to identify individuals or groups of individuals whose behavior can indicate a lack of compliance or propensity to lack of compliance with their standards of behavior and legal requirements. Given the nature of the industry the impact of these events can result in financial losses, fines, and reputation damage and might even undermine the viability of organization itself. Recently, we worked with a customer who wanted to use streaming data to understand high risk trading behaviors.
In this financial services case, organizations lack the capability to identify key human factors and behaviors that can indicate that an employee is under stress or engaging in activity that potentially risks breaching business guidelines or compliance rules and potentially opens the institution up to risk. Some organizations are investigating data-driven ways to radically improve their ability to identify those individuals or groups of individuals whose behavior might indicate a lack of compliance or propensity to lack of compliance with their standards of behavior and legal requirements. They can appear as employee-initiated fraud, loss, or waste. Given the nature of the industry, the impact of these events can threaten to undermine the viability of organization itself.
Detecting behaviors related to trading risk using telemetry and analytics
Financial industry investigation, research and analysis has identified that correlating behaviors and behavior patterns are present among individuals that have historically been involved in events that have resulted in significant potential and sometimes realized risk. Historically, the only way that a bank was able to receive the data it required to process and determine an individual’s behavior was one-time and often retrospective analysis. These processes were reactive in nature and not fit for purpose in ensuring the integrity of the trading compliance processes.
In this financial services use case, the organization desired to build the capability to identify key human factors and behaviors that indicate an employee is under stress or engaging in activity that potentially risks breaching business guidelines or compliance rules, potentially opening the institution up to losses, penalties, and reputational risk.
Functional architecture
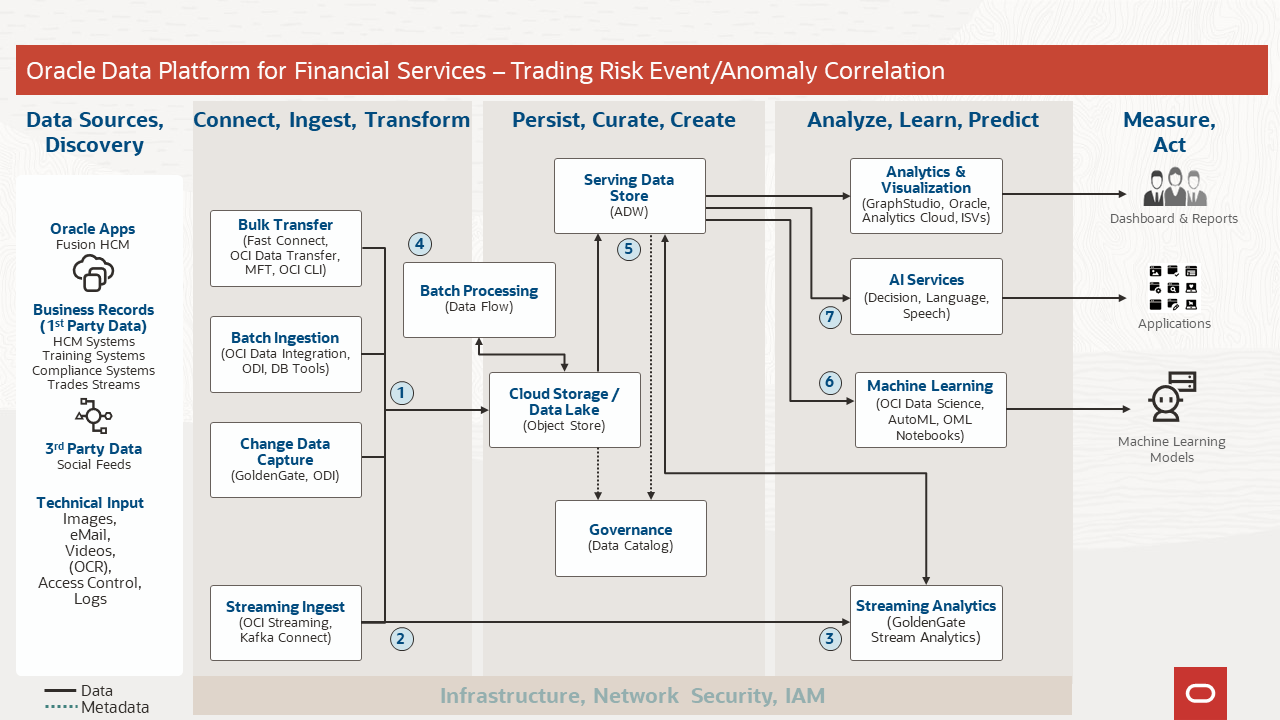
A typical financial services organization might want to implement a similar solution that can compare an individual employee against the group to identify a range of specific business events associated with that individual. These events include the following core business process driven events:
-
Business records
-
Environmental events, such as location and location access
-
IT events such as systems access including access location
-
Human resources information, including address change and attendance information
-
Communication information, such as email, instant messaging, voice communication, social, and other digital communication methods
This solution identifies an individual whose behavior events deviate from the employee model and constitute an anomaly. As a result, a supervisor can be assigned to assist the employee as a proactive intervention reducing risk and enabling the intervention to ensure employee wellbeing.
Summary
F1 teams uses data to gain a competitive edge on the racetrack. Similarly, financial organizations can use data to gain an advantage in the marketplace. Analyzing data can help identify patterns, trends, and insights that can lead to better investment decisions, risk management strategies, and improved operational efficiency. Financial services organizations can use data to identify and manage risks in their operations. Data can provide valuable insights into market trends, credit risk, fraud detection, and compliance issues.
For more information on how Oracle Cloud Infrastructure can assist you, see the following resources:
To learn more, get hands-on, and discover how Oracle can work for you
For more learning from experts, networking with peers, and innovations to explore, join us at Oracle CloudWorld in Las Vegas on September 18–21, 2023. CloudWorld is the best place to learn about Oracle solutions—including infrastructure, databases, and applications—from the people who build and use them. Register today!