Split-stack architectures are as prominent as ever. Consumers are utilizing multicloud and wide-area network (WAN) deployments to get best-in-class services at each level, stay cloud-agnostic, cut costs, and protect against disaster. While many networking advances have made such setups a reality, latency can still be introduced in multiple ways.
Latency can be especially harmful between an application and a database. Luckily, with the Oracle database, there are multiple ways to tune network parameters to optimize performance over a high-latency connection. My colleagues Emiel Ramakers and Julien Silverston recently wrote a blog discussing fetch size tuning for Oracle Database Service for Azure. In this blog, we explore the impact of latency and fetch size in a simulated network latency environment for a data warehouse and online transaction processing (OLTP) workload.
What is fetch size?
Fetch size is the number of rows retrieved per network call. By default, most Java Database Connectivity (JDBC) drivers use a fetch size of 10. If you’re reading 1,000 objects, 100 network calls are required to get the data. Increasing the fetch size to 250 results in only 4 network calls. In low-latency networks, this difference is negligible, but it’s trivial to see the impact this scale can have in a high-latency network.
Why don’t you want to make the fetch size as large as possible? As you increase fetch size, the client application uses more memory to store all the rows returned in one fetch. Fetch size isn’t one size fits all, but something to be tuned and tested before deployment
Linux Traffic Control
One way to introduce network latency is the Linux Traffic Control (TC) command. The TC command helps in policing, classifying, shaping, and scheduling network traffic. We can use it to add a delay with every network packet. Let’s see it in action.
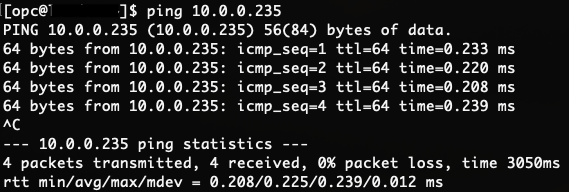
Figure 1: Normal ping
With no network delay, the average time it takes to ping the database is about 0.2 ms. Let’s add a 5-ms delay using TC.
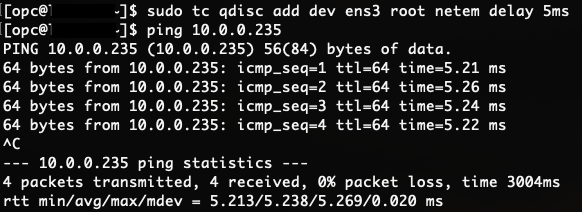
Figure 2: Ping with 5-ms delay
Figure 2 shows an average time of 5.2 ms, as expected.
Testing
Let’s run two tests for the following information:
-
Monitor the impact of varying latency and fetch size for data warehouse and OLTP workloads
-
Determine if Linux TC is a good representation of real latency
For the workload, I use a simple Python tool from our real-world performance team that generates data on the fly and measures the network latency between the client and Oracle database. This tool has both data warehouse and OLTP modes, which essentially determines how analytical/intense the SQL is, and easily allows me to vary fetch size.
Test 1: Varying latency and fetch size
Setup
The setup is simple with the client and database being in the same Oracle Cloud Infrastructure (OCI) subnet and availability domain, which a latency of .2 ms. I add 5, 10, and 15 ms of latency using TC and vary the fetch size to 20, 100, 250, and 500 for each.
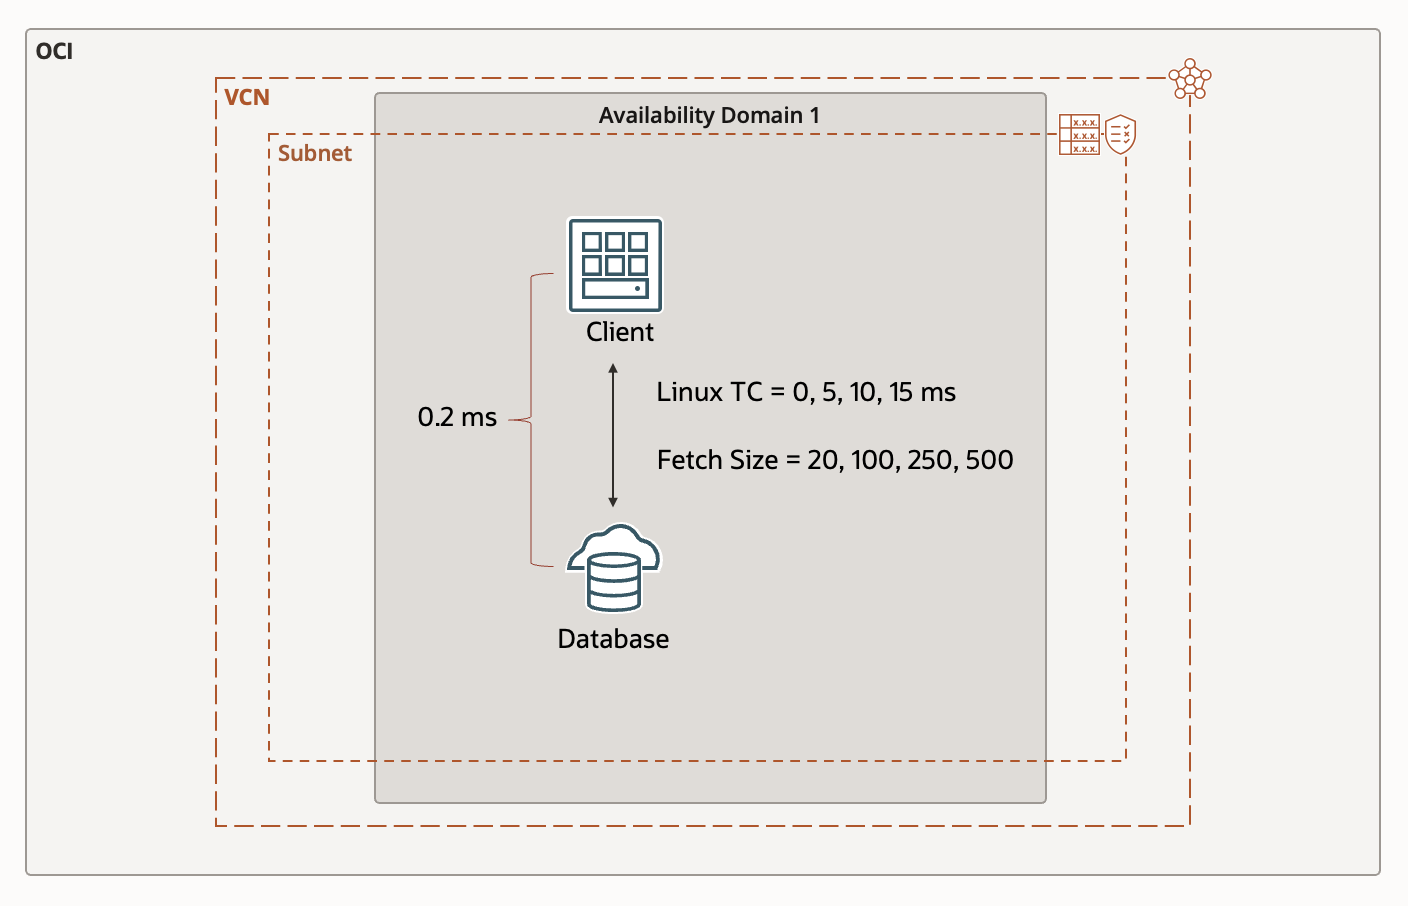
Figure 3: Test 1 setup
Analyzing client time
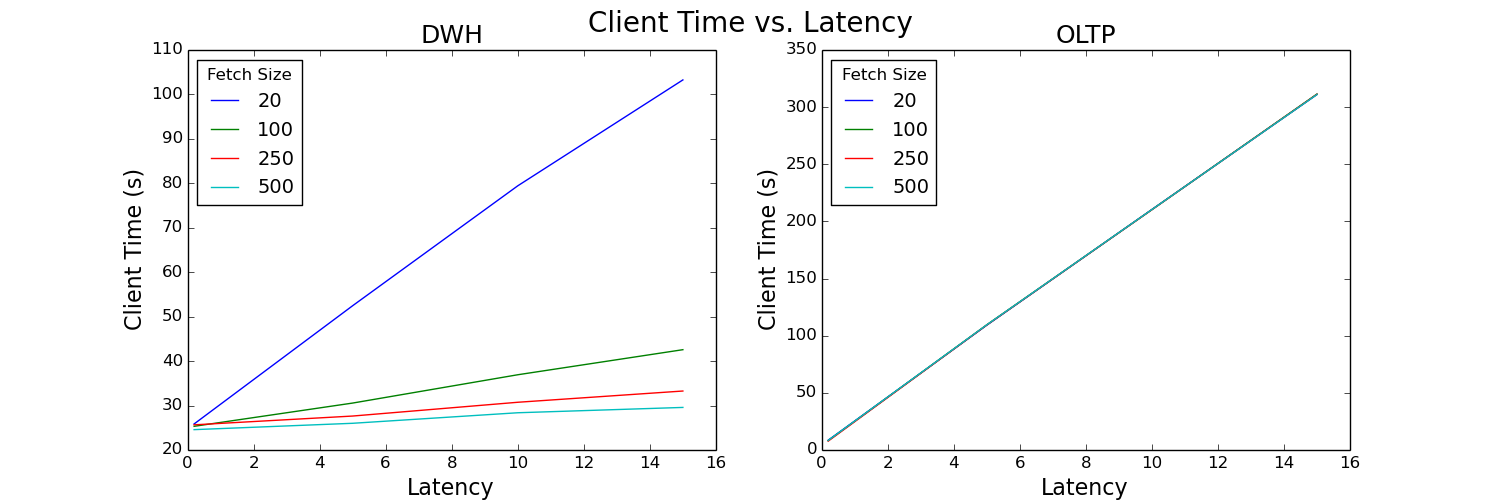
Figure 4: Client time versus latency plot
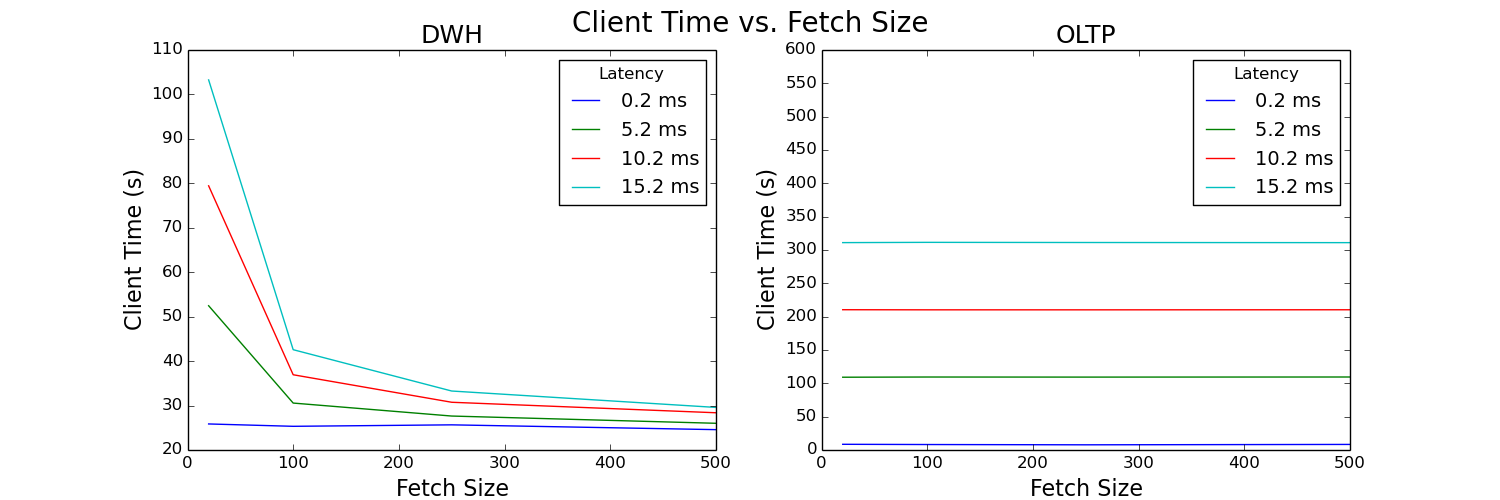
Figure 5: Client time versus fetch size plot
These plots analyze the total time it takes to run the test queries as seen by the client. The time spent on the client increases almost linearly for both data warehouse and OLTP workloads as latency increases. Fetch size has a large impact for the data warehouse workload, but almost no impact on the OLTP workload. Increasing fetch size decreases client time, but seemingly only to a certain limit. In Figure 5, the client time begins to flatten out around a fetch size of 250.
Analyzing network time
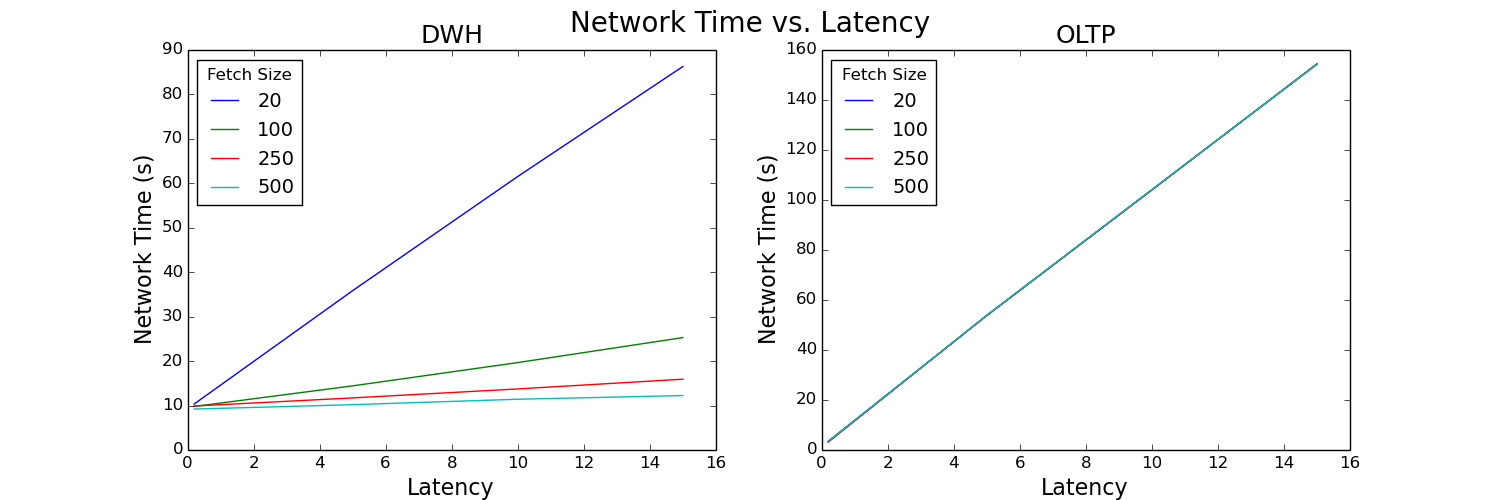
Figure 6: Network time versus latency plot
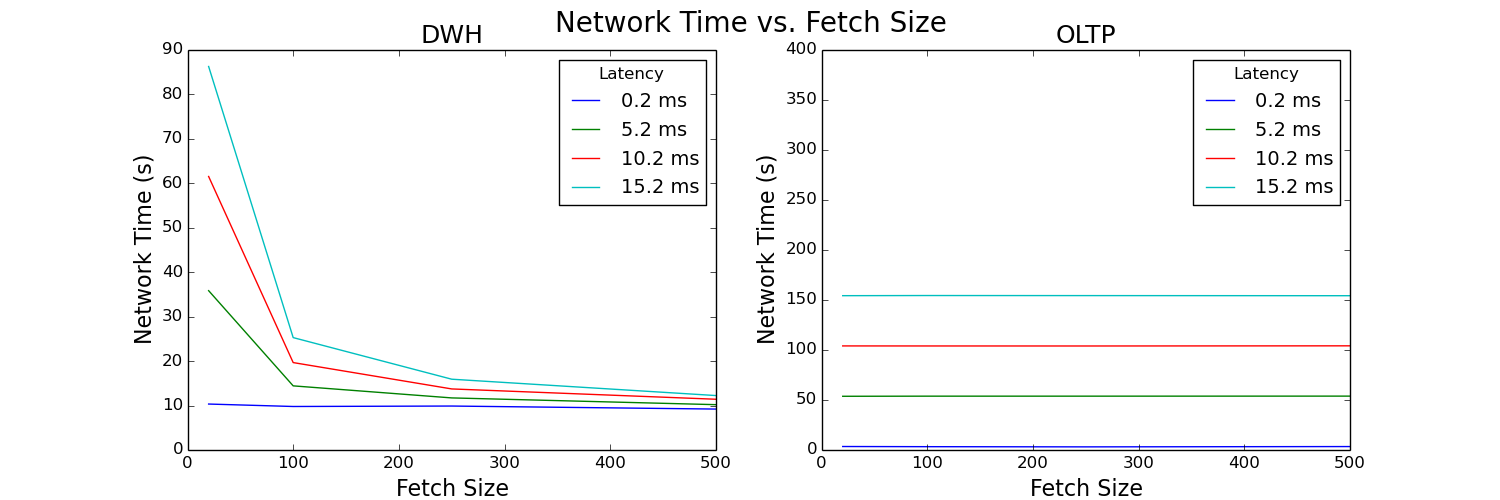
Figure 7: Network time versus fetch size plot
These plots analyze the total time spent in the network for the duration of the test and look very similar to the client time plots. This result suggests that network time is the driving factor of our test. Let’s see if we can confirm this hypothesis by looking at the percentage of overall time spent in the network.
Analyzing percent of time spent in the network
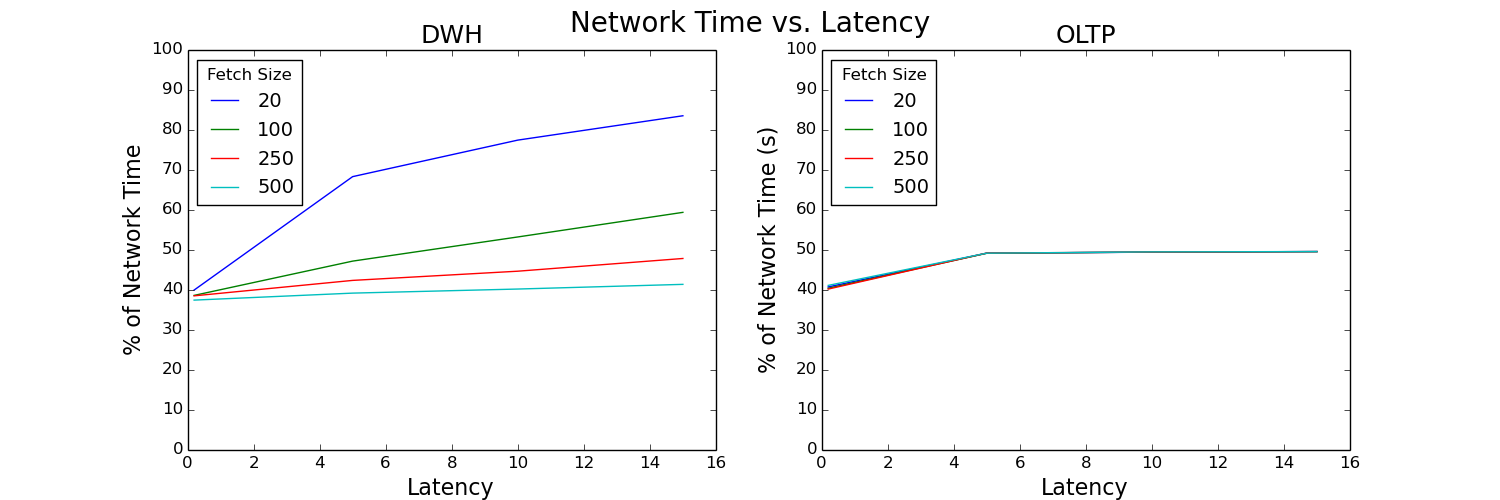
Figure 8: Percentage of network time versus latency plot
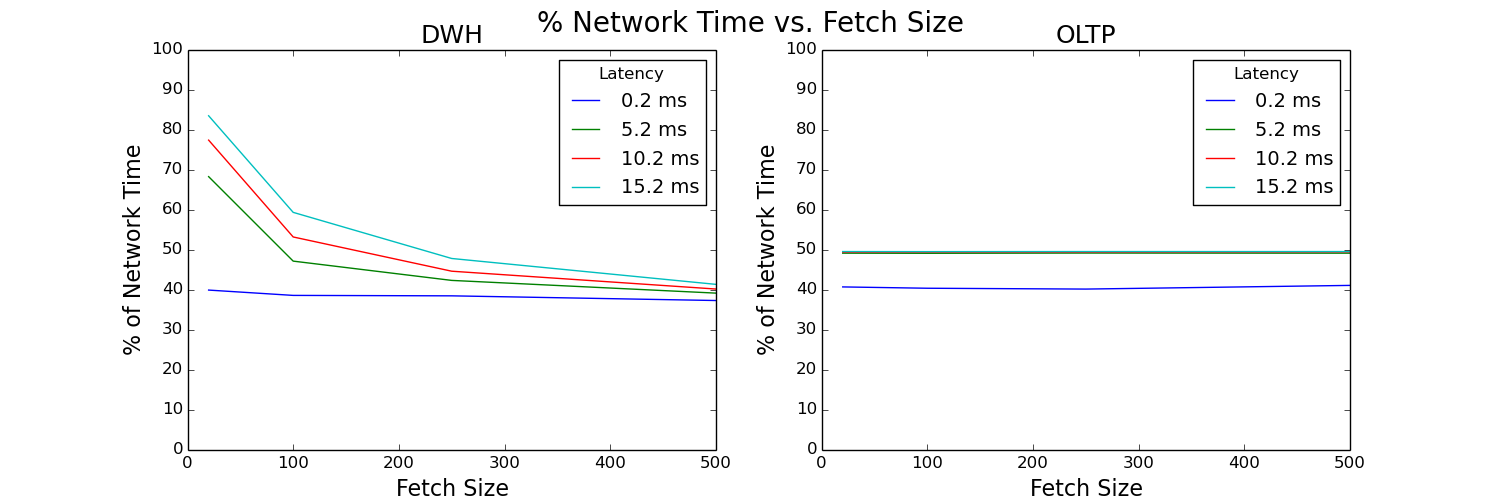
Figure 9: Percentage of network time versus fetch size plot
Percent of network time is calculated as network time divided by client time. It increases with increased latency. Without tuning fetch size, network time takes up a large percentage of the total time for the data warehouse workload. However, a properly tuned fetch size significantly improves this ratio.
SQL processing time
You might be alarmed by how large the network time percentage is. While the network does have a significant impact, it’s also important to understand this ratio fully. Client time is equal to time in the network + time in the database. So, we can rewrite our ratio as the following equation:
% Network time = network time⁄(network time + database time)
We’re really measuring the network time compared to the database time. So, if our database time is small, this ratio increases. Each of our SQL runs took the following times:
-
Average s/SQL for DWH: 0.18582
-
Average s/SQL for OLTP: 0.00026
These lengths are both quick, with OLTP being extremely quick. For real-world workloads, especially data warehouse queries with longer SQL processes, this ratio decreases. Understanding which bottleneck, the network or the database, your application is running into is important!
Test 2: Linux TC versus real-world latency
Setup
For real-world latency, the client and database are in different regions with an average latency of 76.2 ms. The simulated latency has the client and database in the same region and availability domain, and we use the TC command to simulate 76.2 ms of latency.
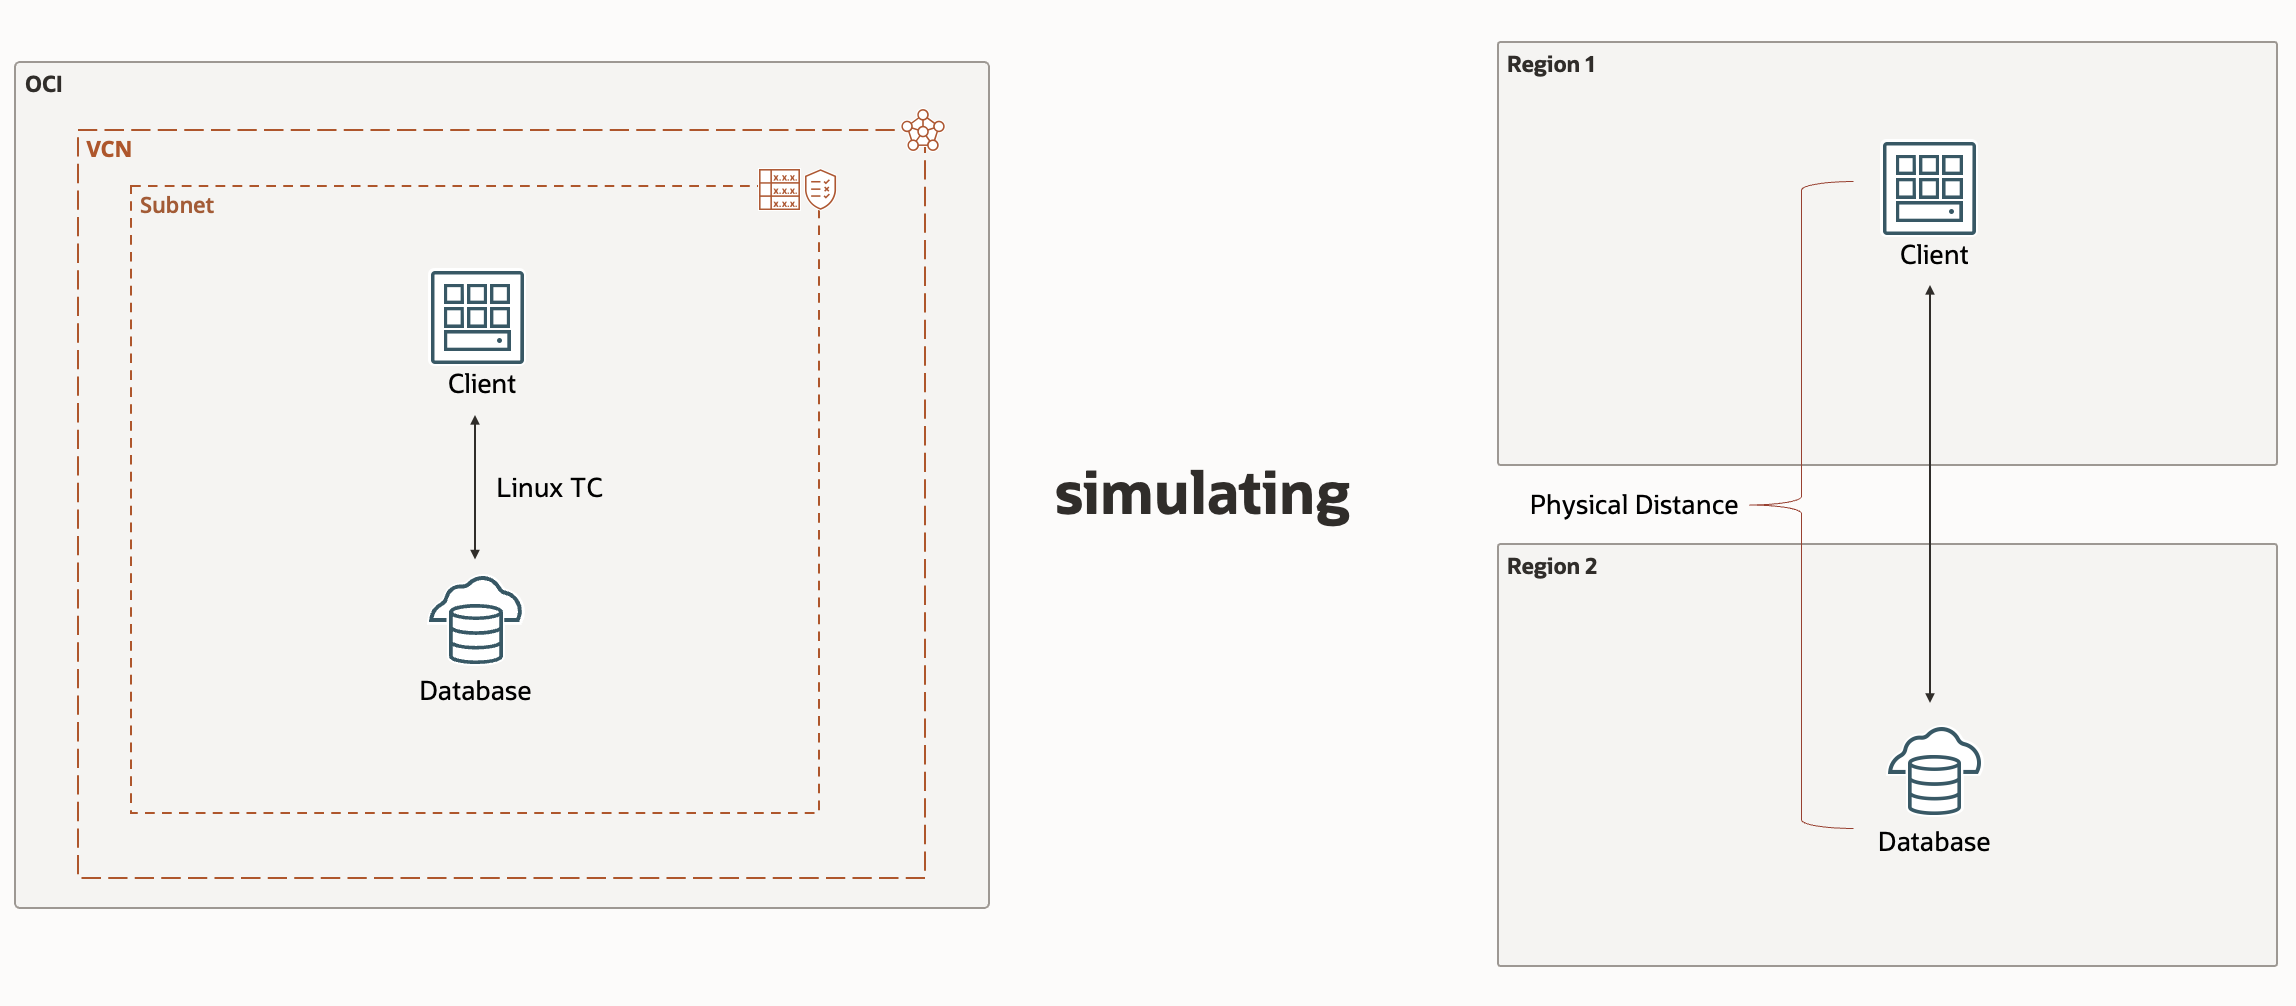
Figure 10: Test 2 setup
Results
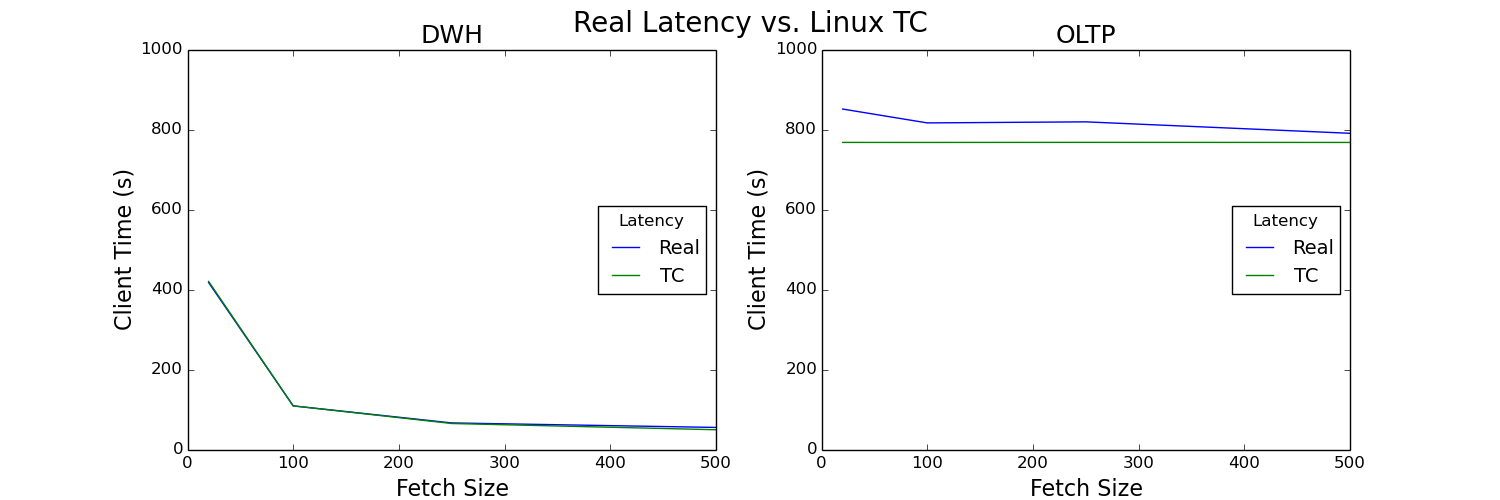
Figure 11: Test 2 results
Analysis
The results using Linux TC and real latency are almost identical for both workload types. We can safely conclude that Linux TC is an effective simulation for real-world latency for both data warehouse and OLTP workloads, making it a valuable tool for testing the impact of latency on workloads. Once again, we gets the benefits of fetch size for the data warehouse workload and negligible effect for OLTP.
Conclusion
Split-stack and WAN architectures have many advantages, but can also introduce latency as resources are deployed further from each other. Testing, tuning, and optimizing network parameters is paramount in such a setup. One such parameter to investigate is fetch size, which is the number of rows retrieved per network call. In this blog, we used Linux Traffic Control (TC) to simulate network latency and varied fetch size for a data warehouse and OLTP workload. We saw how significant an impact latency can have on an application, found fetch size has a profound influence on data warehouse but not OLTP type workloads, and that there is a limit after which increasing fetch size has a diminishing return on client time. We also confirmed Linux TC is a sufficient representation of real-world latency for both data warehouse and OLTP-workloads.
Every application and architecture are different. This means parameter values are not universal, but rather unique to a deployment. We focused on fetch size in this blog, but this is only one parameter that needs to be analyzed. I encourage you to leverage the Linux TC command to simulate latency and fully tune your application!
For more information, see the following resources: